A dashboard business view is how enterprise teams stop chasing updates across spreadsheets, emails, CRM exports, finance systems, and operations tools and start making decisions from one shared source of truth. For IT managers, operations directors, finance leaders, and analysts, the value is simple: less time assembling data, more time acting on it.
When performance data lives in different systems, teams face predictable problems:
Leaders get conflicting numbers in meetings
Managers react too late to missed targets
Analysts spend hours preparing recurring updates
Frontline teams cannot see what they own
Decision-making slows because no one fully trusts the data
A business dashboard solves this by combining the most important metrics into a single, decision-ready interface. Instead of asking, “Where is the latest file?” teams can ask, “What changed, why did it happen, and what do we do next?”
Click To Try The Dashboard
What a dashboard business view actually means
A business dashboard is a visual workspace that brings together key metrics, trends, and alerts from multiple data sources into one place. In plain language, it is a live summary of how part of the business is performing right now or over time.
For enterprise teams, a dashboard business setup is not just about charts. It is about creating a reliable operating view that supports decisions at the executive, department, and local team level.
Business dashboard definition in plain language
A business dashboard turns scattered data into a single decision-ready view by:
Pulling information from different systems
Displaying only the metrics that matter for a specific goal
Showing performance at a glance through charts, tables, and status indicators
Helping users filter, drill down, and investigate changes quickly
If a leadership team needs to understand revenue, pipeline health, service levels, and regional performance in one meeting, the dashboard becomes the common operating screen.
Dashboards vs. reports vs. spreadsheets vs. BI tools
These terms are often used interchangeably, but they serve different purposes.
Dashboards: Ongoing, visual, interactive views of performance for monitoring and decision-making
Reports: More static summaries, often produced on a schedule for formal review
Spreadsheets: Flexible tools for manual analysis, calculations, and ad hoc tracking, but often hard to govern at scale
BI tools: The broader technology layer used to connect data, model it, analyze it, and often build dashboards
A dashboard is usually the visible business layer. A BI platform is what makes that dashboard possible behind the scenes.
Why enterprise teams use dashboards
Enterprise teams use dashboards because speed and consistency matter.
A well-designed dashboard business environment helps teams:
Monitor KPIs in real time or near real time
Spot trends before they affect revenue or service quality
Identify exceptions and bottlenecks early
Align departments around the same metric definitions
Reduce manual reporting effort
Support faster, more confident decisions
In practice, dashboards are less about “seeing data” and more about improving operational response.
Core types of business dashboards and when to use each
Not every dashboard should do the same job. The best enterprise dashboard programs separate monitoring, analysis, and strategic review instead of forcing one screen to serve every audience.
Strategic dashboards
Strategic dashboards help senior leaders track long-term business goals and high-level performance. They focus on executive KPIs rather than daily task detail.
Common use cases include:
Revenue growth tracking
Margin and profitability trends
OKR or scorecard reviews
Cross-functional performance monitoring
Regional or business unit comparison
A strategic dashboard business view should stay concise. Executives need trend direction, target status, and the ability to spot where deeper review is needed.
Operational dashboards
Operational dashboards are built for day-to-day management. They help teams monitor activity, service levels, throughput, exceptions, and workflow health.
Typical examples include:
Open orders and fulfillment delays
Service desk backlog and SLA risk
Production throughput and downtime
Inventory movement and stock alerts
Daily sales activity and pipeline movement
These dashboards need to be timely, easy to scan, and built around action. If a number changes, the next step should be obvious.
Analytical dashboards
Analytical dashboards support deeper exploration. They are used by analysts, business managers, and power users to compare segments, investigate patterns, and identify root causes.
Unlike operational dashboards, analytical dashboards require more flexibility. Filters, drill-downs, and comparisons matter more than simple glanceability.
Role-based dashboards
Different teams need different views of the same business.
A sales manager needs pipeline coverage, conversion rates, and rep performance. A finance leader needs revenue realization, expense trends, and cash visibility. A support leader needs ticket volume, response times, and CSAT.
Role-based dashboards ensure that each function gets relevant metrics without losing shared business context.
The essential components of an effective enterprise dashboard
Enterprise dashboards fail when they are visually impressive but operationally weak. The most effective dashboards combine the right metrics, trustworthy data, clear ownership, and an interface that helps people act quickly.
Core elements every enterprise dashboard needs
Below are the Core Elements that make a dashboard useful in a business setting:
Business objective: The specific decision or performance question the dashboard supports
Target audience: The user group the dashboard is designed for, such as executives, analysts, or team managers
Primary KPIs: The few metrics that signal whether performance is on track
Contextual metrics: Supporting measures that help explain why the primary KPIs changed
Visual hierarchy: A layout that prioritizes the most important information first
Filters and drill-downs: Controls that let users explore by time, region, product, team, or segment
Alerts and thresholds: Signals for missed targets, anomalies, or exceptions requiring action
Data refresh logic: Clear timing for how often data updates
Ownership and governance: Defined responsibility for metric definitions, quality, and access
Actionability: A direct link between what users see and what they are expected to do next
Key Metrics (KPIs)
The specific KPI mix depends on the function, but every strong dashboard business implementation defines metrics clearly and keeps them consistent. Here is a structured KPI framework enterprise teams can use.
Revenue: Total income generated over a period; often segmented by product, region, or account
Growth rate: Percentage increase or decrease in revenue, users, volume, or output over time
Conversion rate: The percentage of leads, opportunities, or visits that become the desired outcome
Pipeline value: The total potential revenue in active sales opportunities
Forecast accuracy: How closely predicted outcomes match actual results
Cycle time: The amount of time required to complete a process from start to finish
SLA compliance: The percentage of work completed within agreed service targets
Backlog: The volume of unresolved tasks, tickets, orders, or requests waiting for action
Exception rate: The share of records or processes that fall outside expected conditions
Customer satisfaction: A score such as CSAT or NPS that reflects customer experience quality
Cost variance: The difference between planned and actual cost
Data freshness: How current the displayed data is, measured by last refresh timing
Adoption rate: The frequency and breadth of dashboard usage across intended users
These KPIs should always come with metric definitions, owners, target values, and update frequency.
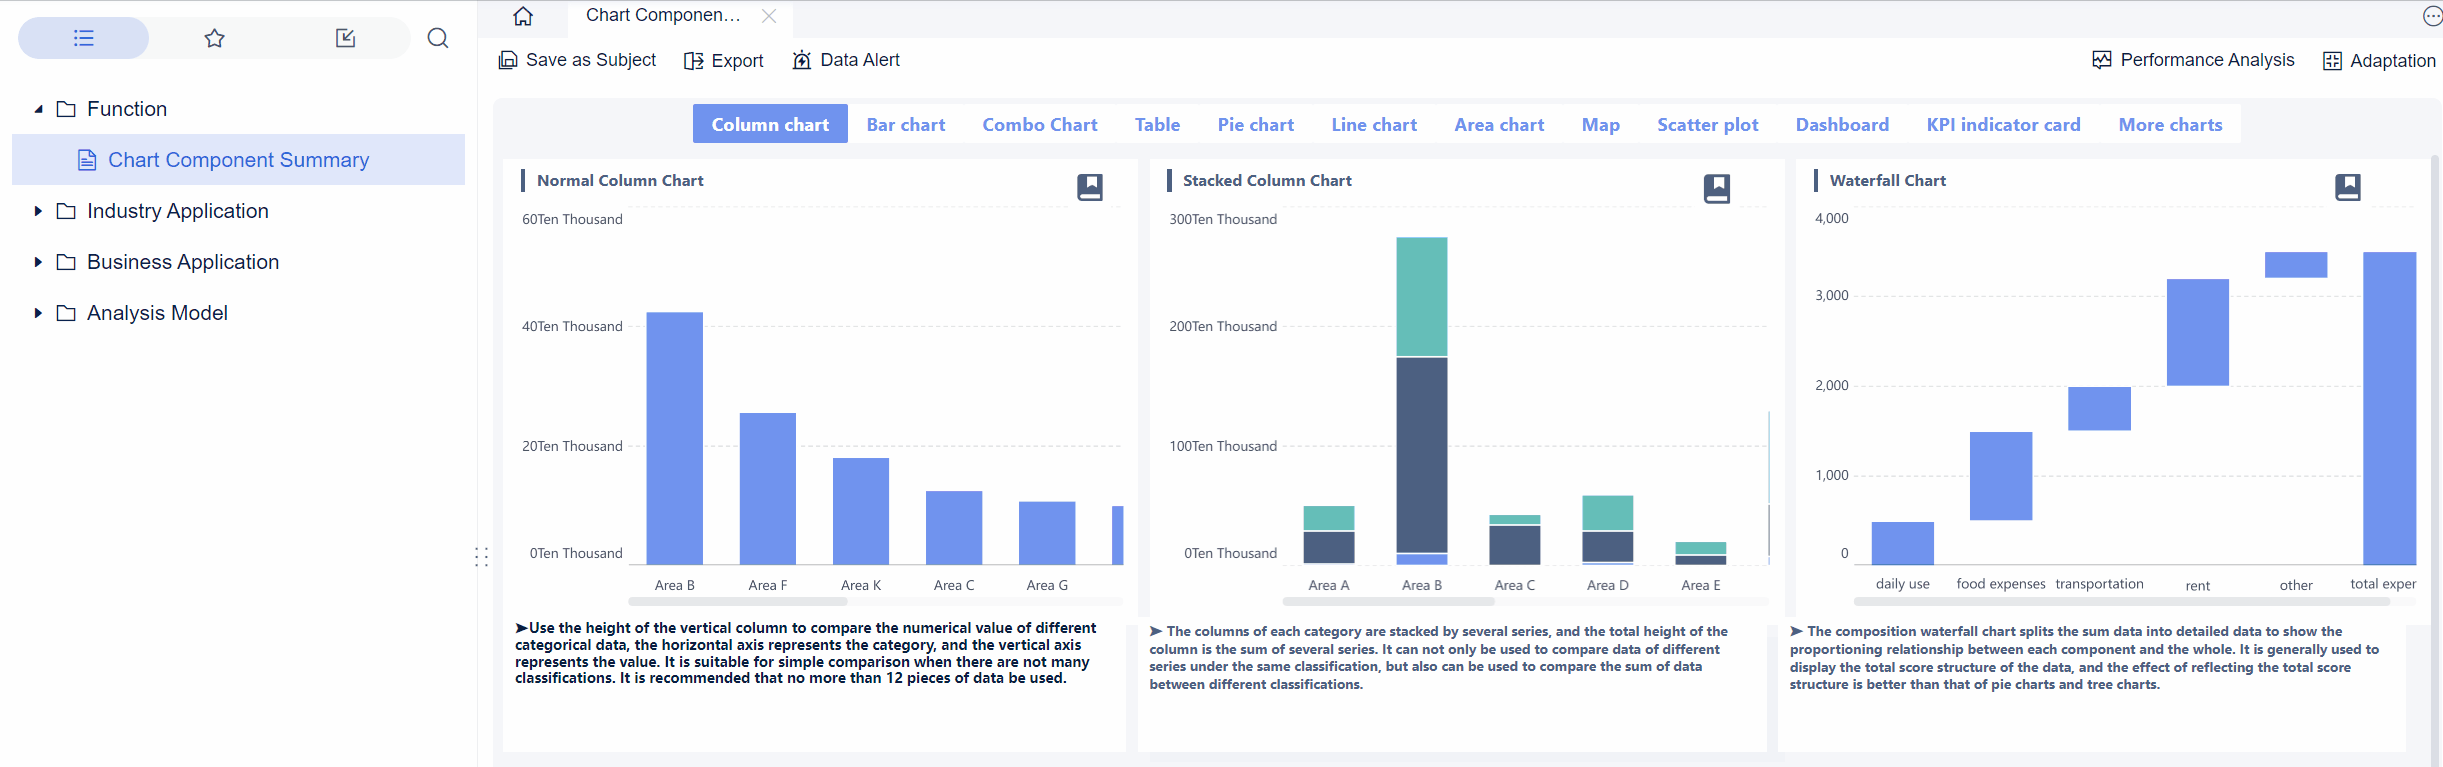
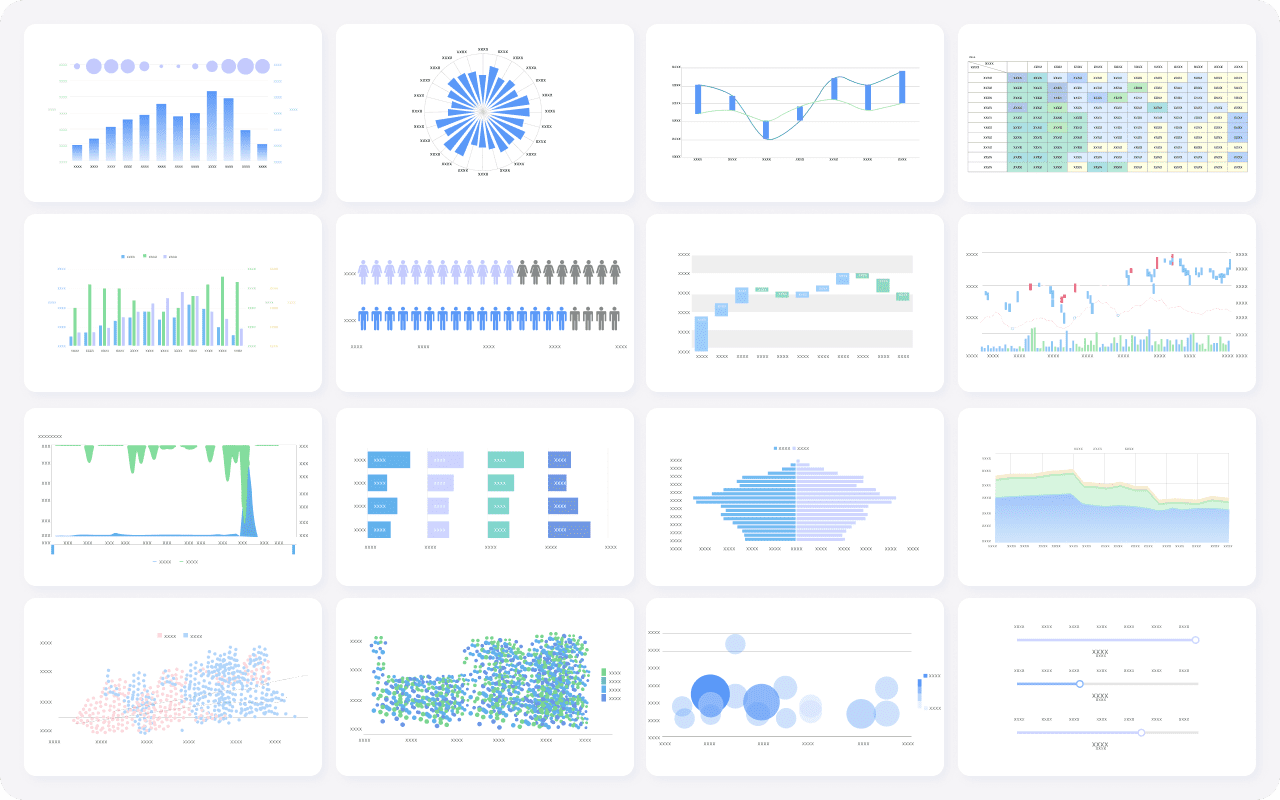
Visualizations, filters, and alerts that make dashboards useful
The best dashboard design is not about adding more charts. It is about choosing the right visualization for the right decision.
Useful dashboard components include:
Scorecards for top-line KPIs
Line charts for trends over time
Bar charts for comparisons across teams, products, or regions
Tables with conditional formatting for ranked operational detail
Maps for distributed location performance
Filters for time period, business unit, geography, and channel
Alerts for threshold breaches, anomalies, or missed targets
If a user cannot quickly tell what changed and whether it matters, the dashboard is too complex.
Why data freshness, ownership, and governance matter
A dashboard is only as trusted as its data model.
In enterprise settings, trust breaks when:
Sales and finance use different revenue definitions
Metrics refresh at inconsistent times
No one owns quality checks
Users can see numbers but not their source logic
Access controls are too loose or too restrictive
To avoid this, every dashboard should have:
A named owner
Standardized metric definitions
Documented refresh schedules
Access rules by role
Validation checks for missing, delayed, or duplicated data
Without governance, dashboards become another layer of confusion.
Usability essentials for enterprise adoption
Usability is often underestimated. Even accurate dashboards fail if they are difficult to read or slow to navigate.
Key usability practices include:
Put the most important KPIs at the top
Limit each screen to a focused decision set
Use consistent colors and labels
Avoid chart clutter and unnecessary decoration
Make filters intuitive
Support mobile access for leaders and field users
Reduce clicks to reach the next level of detail
For many enterprise users, a personalized home view is especially valuable. It gives each person immediate access to the metrics they own while preserving links to shared company-wide context.
7 practical ways enterprise teams turn scattered data into decisions
This is where the business value becomes tangible. A dashboard business strategy is not just about visibility. It changes how teams operate, coordinate, and respond.
Align KPIs across departments
Most enterprise reporting friction starts with inconsistent definitions. Sales counts booked revenue one way, finance uses another, and operations measures fulfillment on a different timeline. Meetings turn into debates instead of decisions.
A shared dashboard solves this by standardizing scorecards and KPI definitions.
Best practice:
Define enterprise metrics centrally
Assign metric owners
Publish shared scorecards by department
Use role-based dashboard views built on the same metric logic
This creates alignment without forcing every user to see the same screen.
Surface exceptions before they become problems
High-performing teams do not wait for monthly reviews to find issues. They use dashboards to spot anomalies, missed targets, and bottlenecks early.
Examples include:
A sudden drop in conversion rate
SLA breaches rising in one support queue
Delayed shipments concentrated in one region
Revenue underperformance against forecast
A spike in refund requests after a product release
Exception-based dashboards reduce noise by highlighting what needs attention first.
Connect customer, revenue, and operational signals
Scattered systems hide cause-and-effect relationships. Revenue may be down, but why? A dashboard that combines customer data, sales data, and operational data can reveal the answer.
For example:
Lower renewal rates may correlate with support backlog
Reduced conversion may align with slower response times
Margin pressure may tie back to fulfillment cost by region
Store-level performance may link to review sentiment and local engagement
This cross-functional visibility is where enterprise dashboards create real decision advantage.
Speed up recurring decision-making
A large share of management time is still spent preparing updates for meetings. Weekly reviews, forecast checks, executive summaries, and operational standups often rely on manually assembled files.
Dashboards compress that cycle.
Instead of spending hours collecting and formatting updates, teams can:
Open the latest view
Review changes against target
Drill into the outliers
Decide next actions in the same session
That shift improves not only efficiency but also decision cadence.
Give local teams visibility into location performance
Distributed enterprises often struggle with local visibility. Branches, territories, field teams, and multi-location operations need more than a company-wide average.
Location-level dashboards can track:
Listing accuracy
Reputation and review trends
Local engagement
Foot traffic proxies
Sales output by branch
Service quality by site
This helps regional managers compare locations, identify lagging areas, and replicate what top-performing sites are doing.
Personalize views by role and priority
Executives need a top-down picture. Managers need team accountability. Individual contributors need actionable metrics tied to their work. A one-size-fits-all dashboard usually satisfies no one.
Role-based personalization allows each stakeholder to focus on what they own without losing the shared operational picture.
A practical enterprise model includes:
A corporate summary view
Functional dashboards by department
Personal home views for priority metrics
Drill-through paths into detailed analysis
This balance increases adoption because each user sees immediate relevance.
Turn examples into repeatable templates
One of the fastest ways to scale dashboard programs is to stop rebuilding from scratch. Proven layouts, metric groups, and governance rules can be turned into reusable templates.
Templates help enterprise teams:
Reduce design time
Preserve KPI consistency
Accelerate rollouts across regions or business units
Improve usability through familiar structure
Lower dependence on custom one-off builds
For organizations with many teams, repeatable templates are the difference between isolated success and enterprise-wide adoption.
How to choose, launch, and improve a dashboard over time
The strongest dashboard business programs start narrow, validate quickly, and improve continuously. They do not begin with a giant enterprise rollout across every function.
Start with one decision, one audience, and a short list of must-have metrics
Do not begin with “we need a dashboard for everything.” Begin with one recurring decision.
Examples:
How should we prioritize underperforming regions this week?
Which service queues are at SLA risk today?
Are we on track to hit quarterly revenue target?
Then define:
The audience
The top 5 to 10 metrics
The refresh frequency
The action each metric is meant to trigger
That focus prevents complexity from taking over the project.
Validate data sources and define ownership early
Before design work goes too far, confirm:
Which systems provide the data
Whether the data is complete and timely
How each KPI is calculated
Who approves metric definitions
Who owns access, updates, and quality control
This is the step many teams rush past, and it is exactly where trust problems begin.
Roll out in phases and improve based on feedback
A practical enterprise rollout usually follows this path:
Launch a pilot for one team or decision workflow
Validate KPI relevance and usability
Add filters, alerts, and drill-downs based on user behavior
Expand to adjacent functions using shared metric logic
Standardize successful designs into templates
This phased approach lowers risk and improves adoption.
4 best practices from a seasoned consultant
If you are implementing a dashboard in an enterprise setting, these practices consistently deliver better outcomes:
1. Design for a meeting, not for a wall of data
Build the dashboard around the exact review conversation it will support. If the dashboard cannot structure a weekly meeting or daily standup, it is probably too broad.
2. Define thresholds before building visuals
Know what “good,” “at risk,” and “off track” mean before choosing chart types. Threshold clarity makes alerts and color logic meaningful.
3. Separate monitoring from analysis
Use one dashboard for quick status monitoring and another for deeper root-cause exploration. Trying to combine both often creates clutter.
4. Track dashboard adoption as a KPI
If leaders want dashboards to shape decisions, they should measure usage, repeat visits, time saved, and reduction in manual reporting effort.
Practical checklist before building your next dashboard
Use this checklist before starting:
Is there one clearly defined business decision this dashboard supports?
Is the target audience specific?
Are KPI definitions agreed across stakeholders?
Are data sources validated and refresh timing documented?
Is there an owner for metric quality and access control?
Are targets, thresholds, and alerts defined?
Is the layout prioritized around the most important metrics?
Are role-based views needed?
Can users drill into exceptions easily?
Is mobile or field access required?
Have you limited the dashboard to essential metrics?
Is there a feedback loop for improvement after launch?
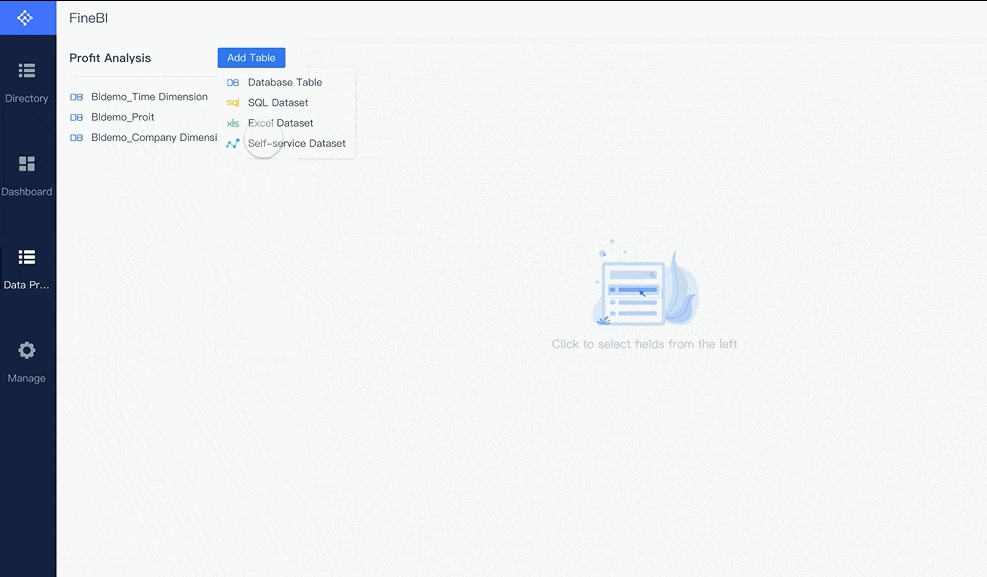
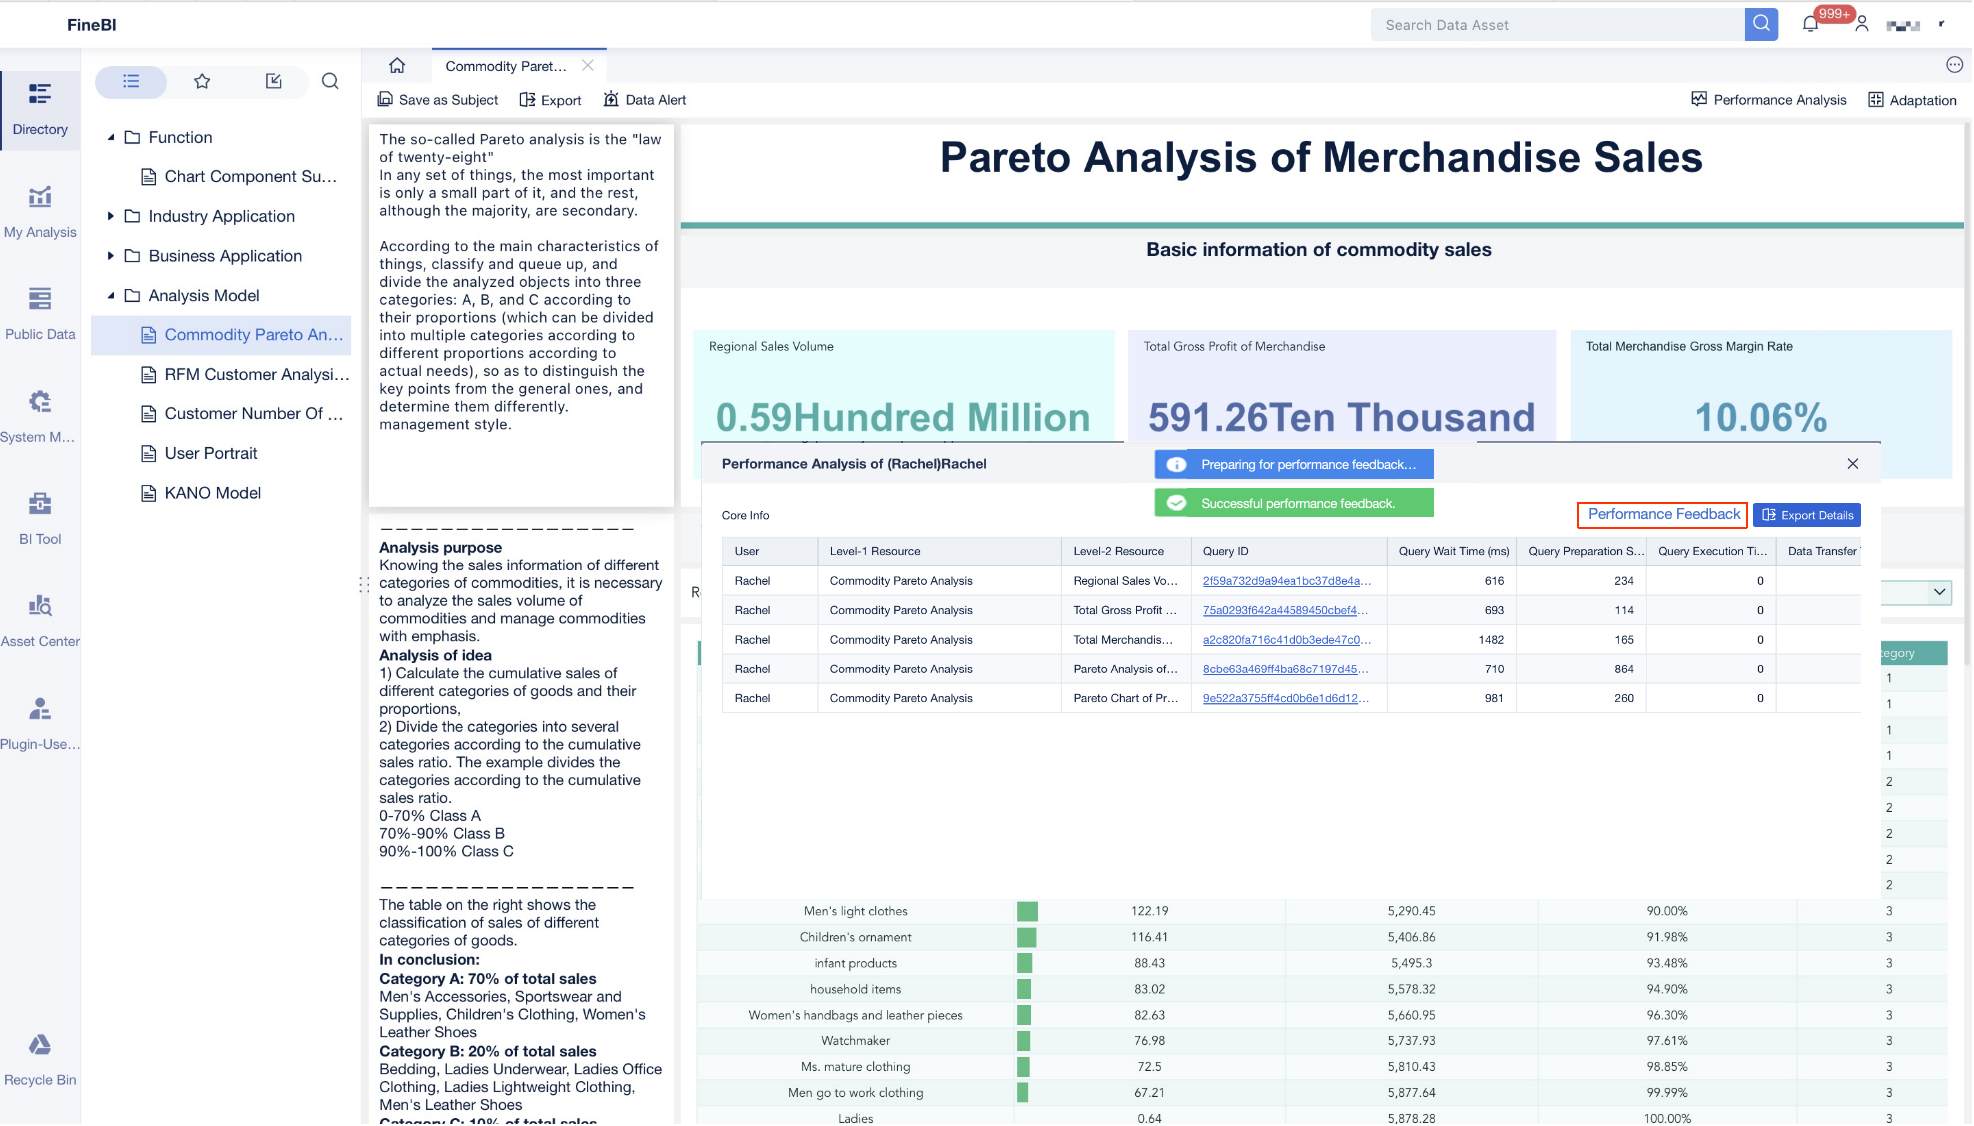
Building this manually is complex; use FineBI to utilize ready-made templates and automate this entire workflow.
For enterprise teams, the challenge is not understanding why dashboards matter. The challenge is building trusted, scalable, role-based dashboards without creating another layer of reporting work. FineBI helps solve that problem by giving organizations a faster path from scattered data to governed, decision-ready dashboards.
Create strategic, operational, analytical, and role-based views
Standardize KPI definitions across departments
Enable self-service exploration without sacrificing governance
Automate recurring reporting workflows and reduce manual preparation time
Personalize home views for different stakeholders
For IT managers, that means better control and lower reporting sprawl. For analysts, it means less repetitive dashboard rebuilding. For executives and department heads, it means faster visibility into the metrics that drive action.
If your current dashboard business process still depends on spreadsheets, static reports, and last-minute data assembly, the opportunity is clear: move from fragmented reporting to a governed dashboard model that supports real enterprise decision-making. FineBI is built to help you do exactly that.
FAQs
A business dashboard is a visual view that combines key metrics from different systems into one place. It helps teams monitor performance, spot changes quickly, and make decisions from shared data.
A dashboard is usually interactive and updated regularly for ongoing monitoring, while a report is more static and often reviewed on a schedule. Dashboards are built for fast decisions, whereas reports are often used for formal summaries.
The main types are strategic, operational, and analytical dashboards. Many organizations also create role-based dashboards so each team sees the metrics most relevant to their work.
A business dashboard should include the KPIs tied to a specific goal, along with trends, status indicators, and enough context to explain performance. The best dashboards focus on the few metrics people need to act on instead of showing everything available.
Enterprise teams use dashboards to reduce manual reporting, align everyone on the same definitions, and respond faster to risks or opportunities. They also improve trust in data by giving teams one consistent view of performance.
Product Trial
FineReport
Pixel-perfect reports · Interactive dashboards · Easy data entry · Digital twins