An ERP report is the operational control layer that turns raw business transactions into decisions leaders can act on. For IT managers, finance leaders, operations directors, and business analysts, the challenge is rarely a lack of data. It is fragmented visibility, conflicting KPI definitions, delayed reporting cycles, and too much manual consolidation across finance, inventory, procurement, and sales. A strong ERP report solves that by bringing core business data into one decision-ready view, so teams can detect issues faster, control performance tighter, and act with confidence.
Click To Try The Dashboard
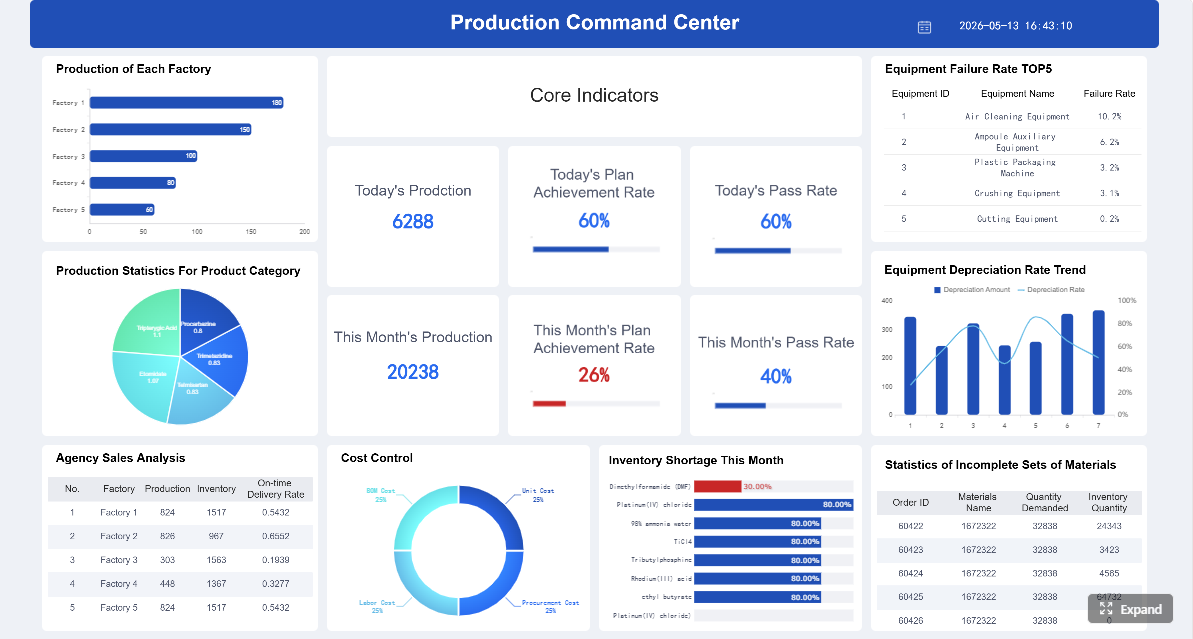
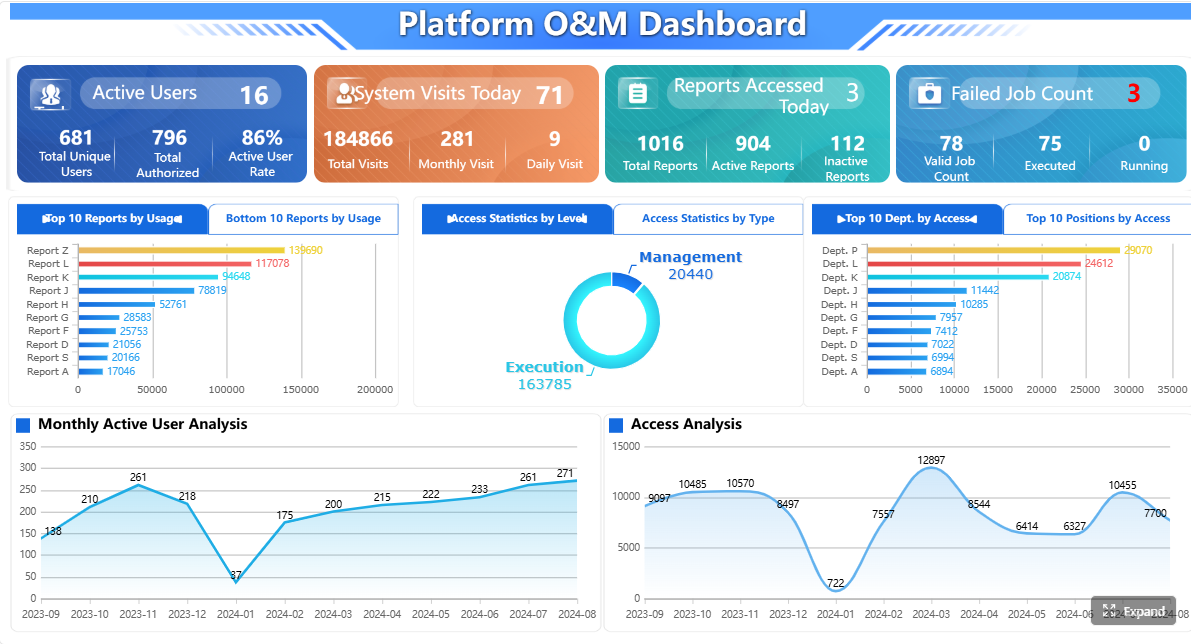
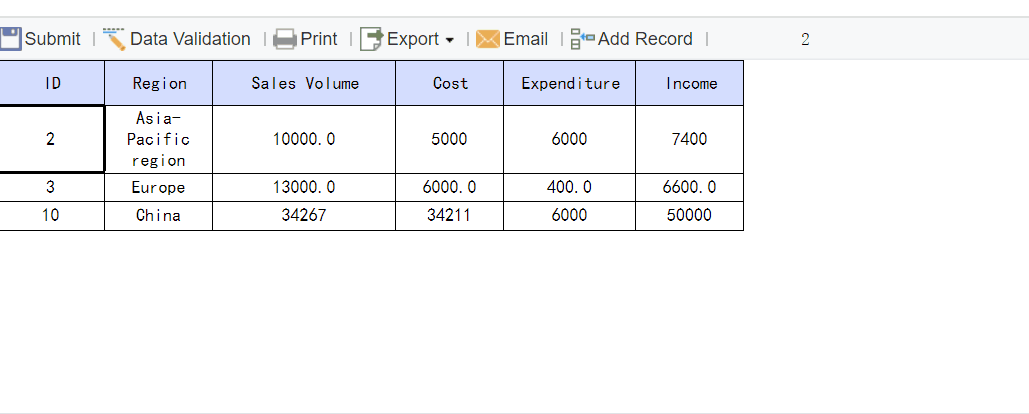
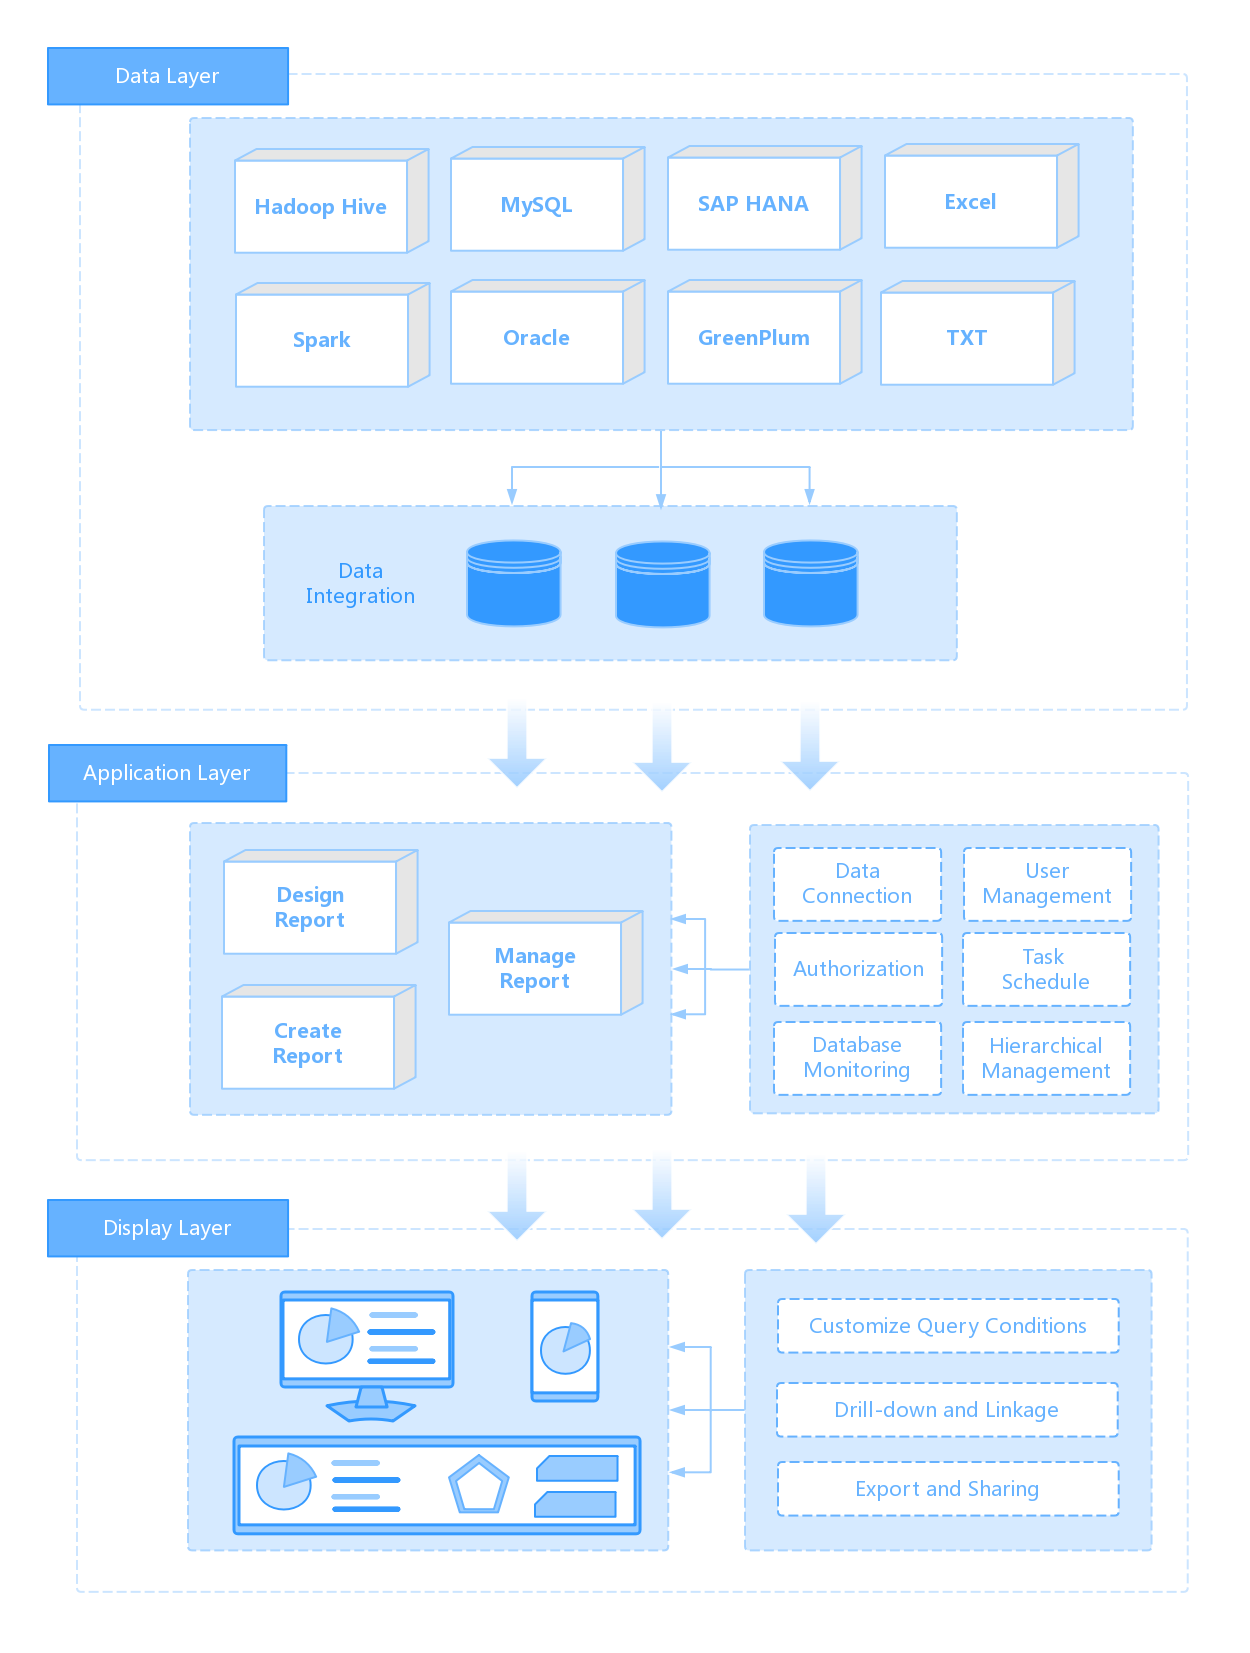
All reports in this article are built with FineReport
An ERP report is a structured output from an enterprise resource planning system that summarizes business performance, transactions, exceptions, or trends. In plain language, it tells decision-makers what is happening across the company, why it matters, and where action is needed.
Instead of reviewing separate spreadsheets from each department, leaders use ERP reporting to connect the business end to end. A CFO can see revenue and cash flow alongside receivables. A supply chain manager can track inventory, purchase orders, supplier lead times, and fulfillment accuracy in one environment. An operations director can monitor production, delays, and cost variances without waiting for manual updates.
The business value is straightforward:
Better visibility: one shared view across departments
Faster decisions: less time spent gathering and reconciling data
Stronger control: earlier detection of exceptions, gaps, and overruns
Higher performance: KPI tracking aligned to business goals
More accountability: clear ownership of numbers and actions
An effective ERP report also reduces cross-functional friction. When finance, procurement, warehouse, sales, and service teams work from the same reporting logic, conversations shift from debating numbers to improving outcomes.
How ERP Reporting Works Across the Business
What Is Enterprise Resource Planning (ERP)?
Enterprise Resource Planning, or ERP, is a system that manages core business processes in a shared data environment. It typically brings together finance, procurement, inventory, manufacturing, order management, HR, and customer-related operations under one platform or tightly connected architecture.
The key advantage of ERP is not just process automation. It is data consistency across the business. When a sales order is created, inventory levels, billing records, procurement needs, and financial postings can all update through connected workflows. That makes ERP reporting far more reliable than disconnected reporting models built from isolated departmental tools.
Where ERP report data comes from
ERP report data usually comes from multiple modules and operational events inside the business. Common sources include:
Finance and accounting: general ledger, accounts payable, accounts receivable, fixed assets, budgeting
Sales and order management: quotes, sales orders, invoices, returns, channel activity
Inventory and warehouse: stock balances, movement history, location-level availability, shrinkage
Procurement: purchase requisitions, purchase orders, supplier performance, receiving records
Manufacturing and operations: work orders, production output, downtime, scrap, labor utilization
Customer service: cases, response times, escalations, service resolution
Projects and costing: project budgets, actual costs, resource allocation, profitability
In mature environments, ERP reports may also combine data from CRM, MES, WMS, e-commerce platforms, banking systems, or external market feeds. The goal is to create a trusted reporting layer without losing the transactional integrity of the ERP core.
ERP reporting can be delivered in several ways, depending on the decision speed required.
Scheduled reports are generated on a daily, weekly, or monthly cadence. They are useful for financial close, compliance summaries, executive reviews, and recurring departmental reporting.
Dashboards present interactive KPI views for continuous monitoring. These are ideal for business users who need a live snapshot of performance, trends, and exceptions.
Real-time views pull near-live data from operational workflows. They are most valuable in environments where timing matters, such as order fulfillment, inventory control, production, and cash management.
Exception-based alerts notify users when thresholds are breached. For example:
inventory falls below safety stock
budget variance exceeds tolerance
supplier lead time slips beyond target
overdue receivables pass a risk threshold
order fulfillment accuracy drops below SLA
For most organizations, the best ERP reporting setup combines all four. Scheduled reporting supports governance, dashboards support management, real-time views support operations, and alerts support intervention.
The KPIs That Matter Most in an ERP Report
The best ERP report does not try to show everything. It focuses on the few metrics that directly influence decisions. Below is a structured KPI framework that works well for most enterprises.
Key Metrics (KPIs)
Revenue Trends: Measures sales performance over time to identify growth, decline, and seasonality.
Gross Margin: Shows profitability after direct costs and helps monitor pricing and cost efficiency.
Budget Variance: Compares actuals against budget to highlight overspend or underperformance.
Days Sales Outstanding (DSO): Tracks how quickly receivables are collected and signals cash flow health.
Inventory Turnover: Measures how efficiently inventory is sold and replaced during a period.
Order Cycle Time: Tracks the time from order receipt to delivery, indicating operational speed.
Procurement Efficiency: Evaluates purchasing performance through lead times, cost savings, and PO cycle metrics.
Fulfillment Accuracy: Measures whether orders are delivered correctly, completely, and on time.
Customer Retention: Indicates how well the business keeps existing customers over time.
On-Time Delivery: Tracks the percentage of orders delivered as promised.
Sales Pipeline Conversion: Measures how efficiently opportunities convert into closed business.
Case Resolution Time: Tracks how quickly customer issues are resolved by support or service teams.
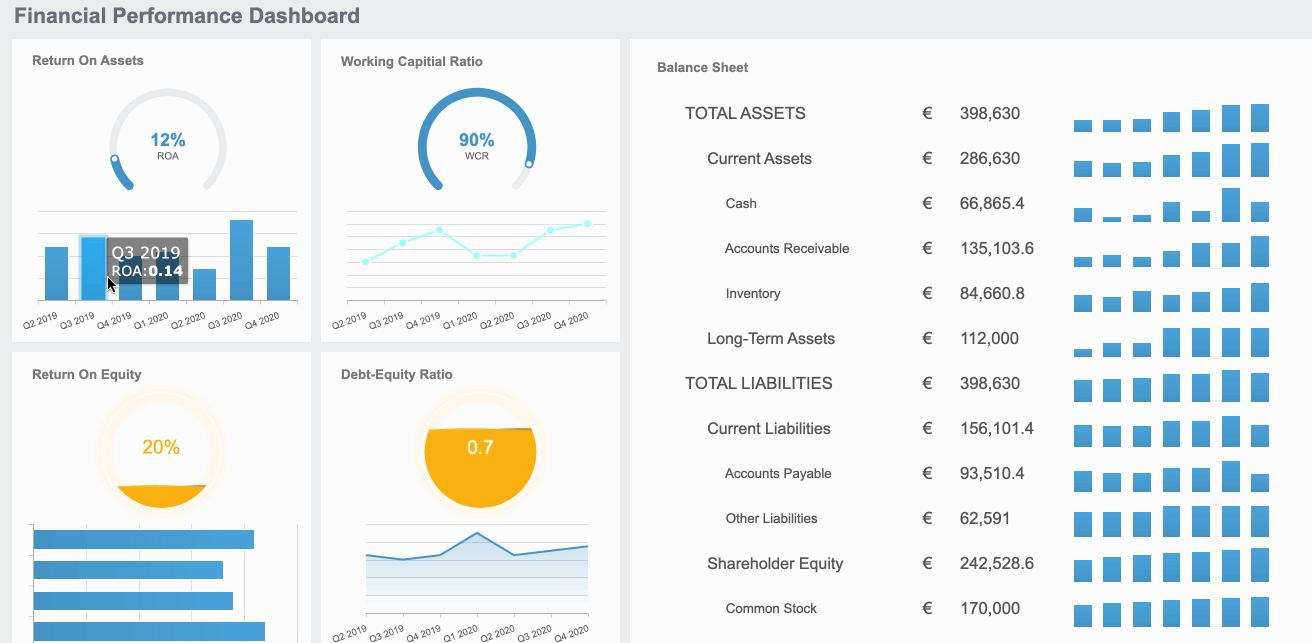
Financial reporting is often the most mature part of ERP reporting because it supports executive planning, compliance, and cash control. The most useful financial and cash flow KPIs include:
Revenue trends: Analyze by product, region, customer segment, or channel to identify where growth is real and where it is weakening.
Gross margin: Monitor by business line to detect pricing pressure, cost inflation, or product mix changes.
Budget variance: Compare actuals to budget, forecast, and prior period to highlight management action points.
Days sales outstanding: Track collection efficiency and working capital exposure.
Operating expense ratio: Show whether overhead is rising faster than revenue.
Cash conversion cycle: Connect receivables, inventory, and payables to reveal liquidity efficiency.
The real value of these KPIs comes from context. Revenue growth without margin quality can be misleading. Low expenses with delayed receivables can still create cash risk. ERP reports should present relationships, not isolated numbers.
Operations and supply chain reporting is where ERP data becomes highly actionable. These KPIs help leaders improve throughput, reduce waste, and protect service levels.
Inventory turnover: Indicates whether stock is moving efficiently or capital is tied up in slow-moving items.
Order cycle time: Reveals process delays from order entry through picking, shipping, and invoicing.
Procurement efficiency: Measures purchase order processing speed, supplier lead time, and sourcing effectiveness.
Fulfillment accuracy: Shows the percentage of orders shipped correctly and completely.
Stockout rate: Highlights missed sales or service risk caused by insufficient inventory.
Supplier performance: Monitors quality, timeliness, and consistency across vendors.
When operations leaders review these metrics together, they can spot tradeoffs early. For example, aggressive inventory reduction may improve turnover but damage on-time delivery if replenishment is not synchronized.
Customer, sales, and service KPIs
ERP reporting is not just internal. It also supports revenue quality and customer experience.
Customer retention: A strong signal of product, pricing, service, and delivery effectiveness.
On-time delivery: Closely tied to customer satisfaction and account stability.
Average order value: Reveals shifts in customer buying behavior.
Case resolution time: Measures service responsiveness and operational support quality.
Return rate or complaint rate: Identifies quality or fulfillment issues affecting loyalty.
These KPIs matter most when linked back to operational drivers. If retention falls, the ERP report should help answer whether the issue came from delayed delivery, service backlog, pricing erosion, or product availability.
Creating a Successful ERP Reporting Strategy
A successful ERP reporting strategy does not start with chart design. It starts with business decisions. The question is not “What can we report?” but “What decisions must this report improve?”
Steps to Build a Successful ERP Reporting Strategy
1. Start with business goals and stakeholder decisions
Define the business outcomes first. Common goals include improving cash flow, reducing inventory carrying cost, increasing fulfillment accuracy, or shortening month-end close. Then map each goal to the people making decisions.
For example:
CFO: cash flow, budget control, margin management
COO: throughput, order cycle time, operational cost
This keeps the ERP report focused on action, not information overload.
2. Limit reporting to decision-focused metrics
Choose a short list of KPIs that directly support intervention. If a metric does not influence a decision, it probably does not belong on the main report.
A practical rule is to prioritize:
strategic KPIs for executives
operational KPIs for managers
exception metrics for frontline response
This layered design prevents over-reporting and improves adoption.
3. Standardize KPI definitions and cadence
One of the most common reporting failures is not technical. It is definitional. Different teams calculate the same metric in different ways.
Standardize:
KPI formulas
time ranges
source systems
reporting frequency
data refresh timing
metric owners
approval workflows
If “on-time delivery” means one thing to sales and another to logistics, trust breaks quickly. ERP reporting must create a single operational language.
4. Establish governance, validation, and role-based access
Good ERP reports depend on disciplined data governance. Set rules for data entry, validation, exception handling, and user permissions.
At minimum, define:
who owns each data domain
how data quality issues are logged and corrected
what validation rules apply before reports are published
which users can view, edit, approve, or distribute reports
This reduces manual rework and protects sensitive information.
5. Review and refine continuously
ERP reporting should evolve with the business. A quarterly review cycle helps retire unused reports, update KPI thresholds, and align reporting with changing priorities.
A practical ERP report template should make reporting repeatable, clear, and decision-oriented. Every report should include the following essentials:
Objective: What decision or management outcome the report supports
Audience: Who uses the report and at what level
KPIs: The core metrics included, with approved definitions
Filters: Business unit, region, product line, supplier, customer segment, or location
Time range: Daily, weekly, monthly, quarterly, YTD, rolling 12 months
Comparisons: Versus budget, forecast, previous period, target, or benchmark
Exceptions: Threshold breaches, anomalies, overdue items, or trend warnings
Actions: Required next steps, owners, and due dates
A good template also separates summary insights from detailed drill-downs. Executives need fast interpretation. Analysts need traceability. Operations teams need issue-level visibility.
After the framework is in place, the next step is execution discipline.
Common ERP Reporting Challenges and How to Solve Them
Most ERP reporting problems are predictable. The good news is they are also fixable with the right operating model.
Poor data quality is the most common issue. Missing master data, duplicate records, delayed postings, and inconsistent transaction practices all degrade reports. The solution is stronger front-end controls, validation rules, and data ownership by domain.
Inconsistent KPI definitions create mistrust. Finance, sales, and operations often use different formulas for similar measures. Solve this with a KPI dictionary, governance committee, and formal approval process for changes.
Siloed reporting happens when business units export their own data and build separate reports. This may feel faster locally, but it breaks enterprise alignment. A centralized reporting model with role-based views is usually the better answer.
Over-reporting is another major risk. Too many charts and metrics reduce focus. If everything is important, nothing is. Reports should highlight what changed, what matters, and what needs action now.
Low user adoption often means the report was designed around data availability instead of user workflow. Involve actual stakeholders in design, testing, and rollout. Train them on interpretation, not just navigation.
Several trends are reshaping how enterprises use ERP reports today:
AI-assisted analysis: Systems increasingly detect anomalies, summarize trends, and suggest root causes automatically.
Self-service dashboards: Business users expect filtered, interactive access without relying on IT for every variation.
Predictive reporting: Historical data is no longer enough. Teams want demand forecasts, cash projections, and supply risk warnings.
Exception-first design: Rather than scanning full reports, managers want alerts for what needs immediate attention.
Cross-platform integration: ERP reporting is becoming more connected with CRM, HR, logistics, and external planning tools.
The operational implication is clear: reporting is shifting from backward-looking review to forward-looking control.
The 2026 ERP Report: what to watch
Looking ahead to 2026, enterprise leaders should expect three themes to become even more important.
Automation maturity will increase. More reporting workflows will be scheduled, validated, distributed, and escalated automatically. Manual spreadsheet consolidation will continue to lose ground.
Data unification will become a bigger priority. Companies will push harder toward common business definitions, shared data models, and fewer reporting silos across ERP and adjacent platforms.
KPI personalization will expand. Executives, plant managers, finance controllers, and service leads will all expect tailored ERP reports based on their role, thresholds, and workflow needs.
In other words, the future ERP report is not just a document. It is an adaptive decision interface.
Building this manually is complex; use FineReport to utilize ready-made templates and automate this entire workflow. For most enterprises, the real challenge is not understanding what an ERP report should include. It is building a scalable reporting system that pulls data from multiple modules, standardizes KPI logic, supports role-based views, and delivers dashboards, scheduled reports, and alerts without constant IT rework.
FineReport helps solve that problem by enabling teams to:
connect ERP and business data sources in one reporting layer
automate scheduled distribution and permission control
support drill-down analysis for finance, supply chain, sales, and service teams
That means faster deployment, stronger reporting governance, and less dependency on manual spreadsheet preparation. For organizations that want enterprise-grade visibility without rebuilding reporting from scratch, FineReport is a practical accelerator.
If your team is still stitching ERP reports together manually, this is the moment to move to a governed, automated model.
An ERP report helps teams turn transaction data into a clear view of business performance, risks, and trends. It supports faster decisions across finance, inventory, procurement, sales, and operations.
Most ERP reports pull from core modules such as finance, sales, inventory, procurement, and operations. More advanced setups may also combine CRM, warehouse, manufacturing, or banking data for a fuller picture.
The most important KPIs depend on the business, but common ones include revenue, gross margin, inventory turnover, cash flow, receivables aging, procurement cycle time, and order fulfillment accuracy. Strong ERP reporting focuses on metrics tied directly to business goals and operational control.
It depends on the decision being made. Executive and compliance reports may run on a scheduled basis, while operational dashboards often need near-real-time updates and alerting.
An effective ERP report uses consistent KPI definitions, trusted data, and a format that makes action clear. It should reduce manual consolidation, highlight exceptions early, and give different teams one shared version of the truth.
Product Trial
FineReport
Pixel-perfect reports · Interactive dashboards · Easy data entry · Digital twins