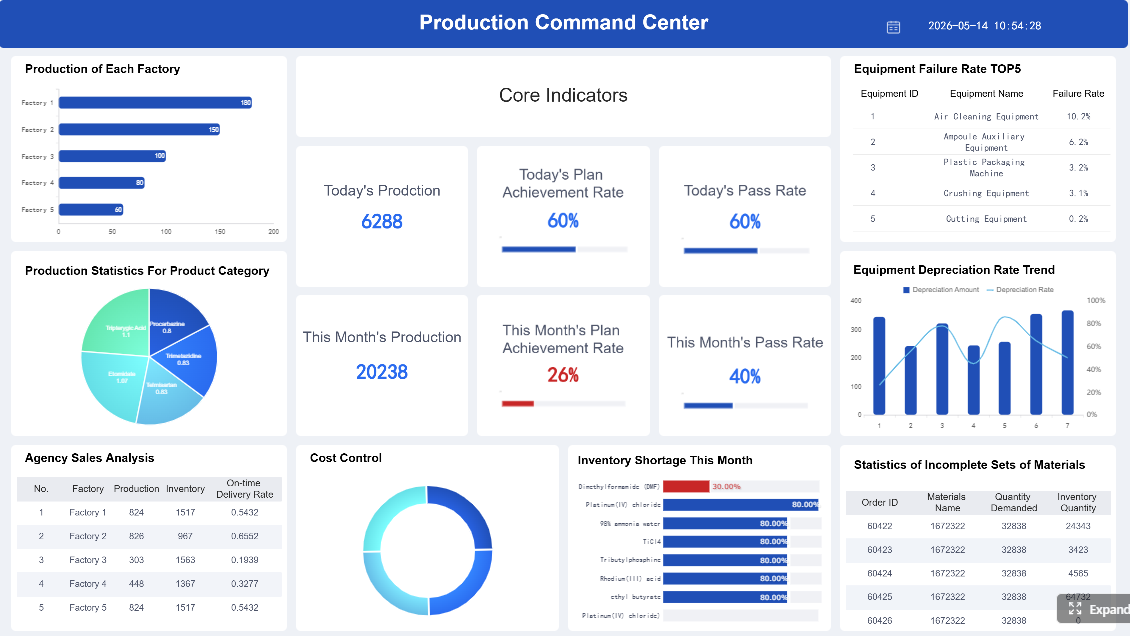
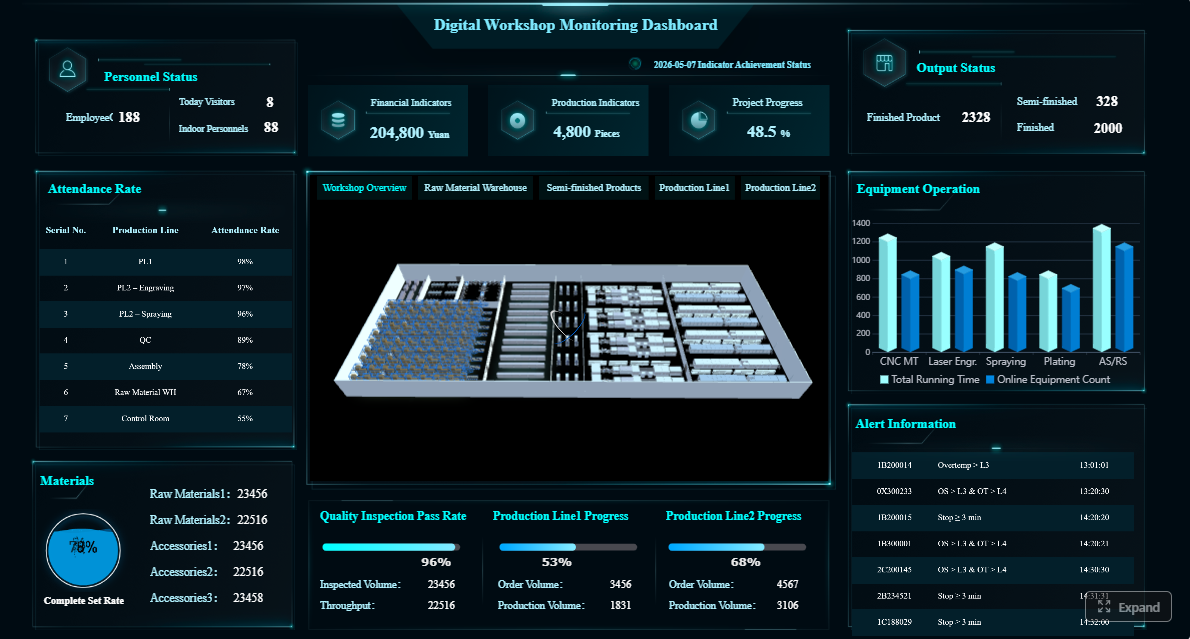
A production report is the operating document manufacturers use to track what was planned, what actually happened, what went wrong, and what needs action next. For supervisors, plant managers, and operations leaders, its business value is simple: it turns raw shop-floor data into decisions on output, labor, downtime, quality, and schedule recovery before small issues become missed orders, excess scrap, or margin erosion.
Click To Try The Dashboard
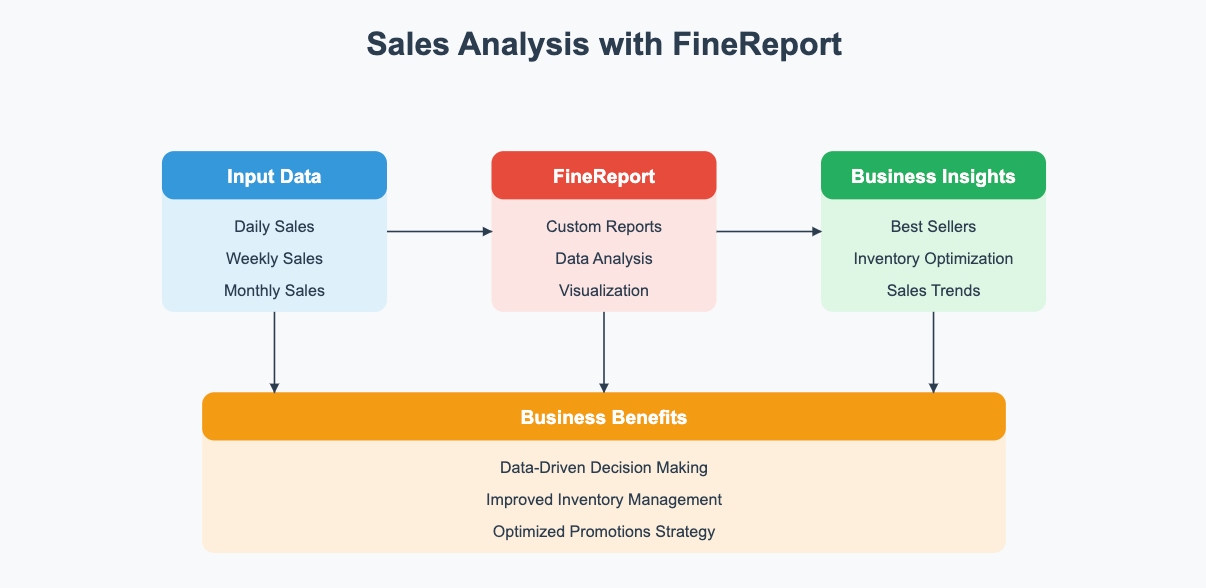
All reports in this article are built with FineReport
A production report in a manufacturing context is a structured record of production performance over a defined period, usually by shift, day, week, or month. It helps teams monitor output, efficiency, quality, downtime, labor usage, and exceptions across lines, machines, and work centers.
Unlike a broad operational dashboard, which often gives a live high-level view across many business functions, a production report is more focused and accountable. It documents the actual state of manufacturing performance for a reporting period and usually includes comments, causes, and follow-up actions. It also differs from a one-time performance summary, which may only provide an executive recap without the operational detail needed for corrective action.
Timely production reporting matters because manufacturing losses compound quickly. A missed target in the first shift can create overtime in the second. An unlogged stoppage can distort capacity planning. A quality issue without root-cause notes can repeat across multiple batches. That is why supervisors use production reports for immediate control, plant managers use them for resource and schedule decisions, and leadership teams use them to monitor cost, service risk, and operational discipline.
What to Include in a Production Report
A useful production report should balance speed, clarity, and decision value. It should not be overloaded with every available data point. Instead, it should include the metrics and context required to explain performance and trigger action.
Core production KPIs
At the center of every production report is a compact KPI set. These measures should be consistently defined across teams and reported in the same format every cycle.
Key Metrics (KPIs)
Output volume: Total units, batches, or weight produced during the reporting period.
Planned vs. actual production: Compares target output with actual results to show attainment gaps.
Cycle time: Time required to complete one unit or batch under current operating conditions.
Throughput: Volume produced over a specific time period, often used to assess line flow.
Scrap rate: Percentage or quantity of material or units lost due to defects or process waste.
Rework: Units requiring correction before release, signaling hidden quality and labor loss.
Downtime: Total lost production time, often categorized as planned or unplanned.
Labor utilization: Degree to which available labor hours are converted into productive output.
Machine uptime: Percentage of time equipment is available and running as intended.
On-time completion: Share of jobs or orders completed within the planned time window.
Overall Equipment Effectiveness (OEE): Composite measure of availability, performance, and quality, used when equipment-centric analysis is needed.
These KPIs are the core elements most teams need before they can make decisions on staffing, maintenance, scheduling, or process improvement.
Numbers alone rarely explain performance. A production report should also capture the operating context behind the metrics so managers can distinguish a controllable issue from a temporary constraint.
Useful supporting details include:
Shift date and time
Shift team or supervisor
Production line, work center, or machine ID
Product code, SKU, batch, or order number
Material usage and shortages
Maintenance events
Quality exceptions and defect categories
Safety or operational incidents
Bottleneck notes
Causes of variance
Corrective actions already taken
This contextual layer is what makes a production report actionable. If actual output missed target by 8%, the report should say whether the loss came from feeder jams, labor shortage, material delay, changeover overruns, or first-pass quality problems.
Report layout and structure
The best production report layout is easy to scan in under two minutes. Shop-floor teams need speed. Decision-makers need hierarchy. A strong structure typically includes:
Summary section
A top-line view of planned vs. actual output, key losses, and overall status.
KPI table
A compact table of core production KPIs with targets, actuals, and variance.
Exceptions log
A list of major downtime events, defects, shortages, or schedule disruptions.
Root-cause notes
Brief commentary on why variances happened, ideally using standardized reason codes.
Next-step actions
Assigned actions, owners, and due times to close the loop.
For readability, use clear labels, conditional formatting, and restrained color coding. Highlight only what needs attention. Do not bury critical losses in dense spreadsheet tabs or long narrative comments.
The daily production report is the most common reporting cadence in manufacturing because it aligns with operational control. It is fast enough to detect problems early and structured enough to support trend analysis when rolled up over time.
When to use a daily report
Daily reporting works best when operations need close tracking of output, downtime, defects, staffing, and schedule adherence. It supports:
Shift handoffs by documenting unresolved issues and production status
Short-interval control by showing whether targets are drifting during the day
Rapid response to downtime, bottlenecks, labor shortages, or quality losses
At the daily level, the most useful metrics are usually output, downtime, scrap, rework, labor availability, and plan attainment. Weekly and monthly reviews can then focus more on trend stability, recurring loss patterns, cost impact, and strategic improvement priorities.
A practical daily production report template should include the essentials without creating administrative drag. Typical sections include:
Date
Shift
Production line or work center
Planned output
Actual output
Downtime
Defects
Staffing
Comments
Approvals
A simple spreadsheet or Excel template can standardize daily reporting for many plants, especially in the early stages of process maturity. The key is not sophistication. The key is consistency. If definitions, timing, and ownership are unclear, even a polished template will produce weak decisions. If those basics are strong, even a simple sheet can drive accountability.
How Production Reporting Supports Better Decision-Making
A production report is not valuable because it stores data. It is valuable because it helps operations teams decide what to do next. That is the difference between passive reporting and performance management.
From raw data to action
Recurring production data helps teams identify trends that are easy to miss in real time. For example, a line may appear stable on a single day, but weekly reporting may reveal recurring downtime after changeovers. Monthly reporting may show that one product family consistently drives higher scrap. A labor issue may only become visible when output, absenteeism, and overtime are viewed together.
Production reports support data-driven decisions in areas such as:
Staffing: Adjust headcount, skill mix, and shift coverage based on utilization and output gaps
Maintenance: Prioritize chronic-failure assets using downtime frequency and duration
Scheduling: Rebalance production plans when actual throughput diverges from assumptions
Inventory: Anticipate shortages or overproduction based on actual run rates and material consumption
Quality control: Target defect categories and recurring rework sources before they spread
Different stakeholders need different views of the same production report data.
Supervisors use reports to manage shift performance. They need quick visibility into output losses, machine stoppages, staffing gaps, and escalation points. Their focus is immediate containment.
Plant managers use production reports for capacity planning, resource allocation, maintenance prioritization, and continuous improvement. They need to understand repeat losses, systemic bottlenecks, and where intervention will deliver the biggest gain.
Executives rely on summarized production reporting to monitor cost pressure, service level risk, operational consistency, and plant performance over time. They need concise trends, not raw events, but the summary must still tie back to reliable operational data.
Daily vs. Monthly Production Reporting
Reporting cadence changes the purpose of the production report. Daily reporting is for control. Monthly reporting is for learning, alignment, and structural improvement.
What changes by reporting cadence
A daily production report focuses on immediate execution. It answers questions such as:
Did we hit today’s plan?
Where did we lose time?
What defects or disruptions need action now?
What must the next shift know?
A monthly production report is used for trend analysis and cross-period comparison. It answers questions such as:
Which lines or sites are consistently underperforming?
Are downtime and scrap improving or worsening?
Are labor and machine resources aligned with demand?
Which losses justify process redesign or capital investment?
For multi-site or multi-line operations, a monthly production report index can help organize recurring reports by:
Site
Line
Team
Product family
KPI category
Reporting month
That structure makes reporting scalable and easier to govern across large manufacturing environments.
Many production reports fail not because of poor tools, but because of poor reporting discipline. Common mistakes include:
Tracking too many metrics: Too much data weakens focus and slows decision-making.
Missing context behind variances: A number without cause is rarely actionable.
Inconsistent definitions: If teams define downtime, output, or scrap differently, comparisons become meaningless.
Delayed reporting: Late reports reduce response speed and trust in the process.
No ownership or follow-up: If reports do not trigger action, they become administrative artifacts.
To avoid these mistakes, every reported number should connect to a decision, an owner, or a next step.
How to Build a Useful Production Report Process
A strong production report process starts with decisions, not templates. First define what the report must help people decide. Then choose the metrics, layout, and frequency that support those decisions.
Here are practical best practices I recommend to manufacturing teams:
Start with decision points
Identify the recurring questions each audience must answer. Supervisors may need shift recovery signals. Plant managers may need asset loss ranking. Executives may need monthly trend summaries. Build the production report backward from those needs.
Standardize KPI definitions and timing
Agree on what counts as downtime, rework, planned output, and completed production. Set fixed reporting cutoffs and submission times. This protects comparability across shifts and sites.
Capture cause codes, not just totals
Do not stop at aggregate downtime or scrap. Require structured cause categories and short notes. This is what turns reporting into root-cause analysis.
Assign accountability for action items
Every major exception should have an owner, due date, and status. Production reporting should close the loop, not just document loss.
Review and refine regularly
As production goals, systems, and stakeholder needs evolve, the report format should evolve too. Remove low-value fields. Elevate recurring issues. Keep the report lean and decision-oriented.
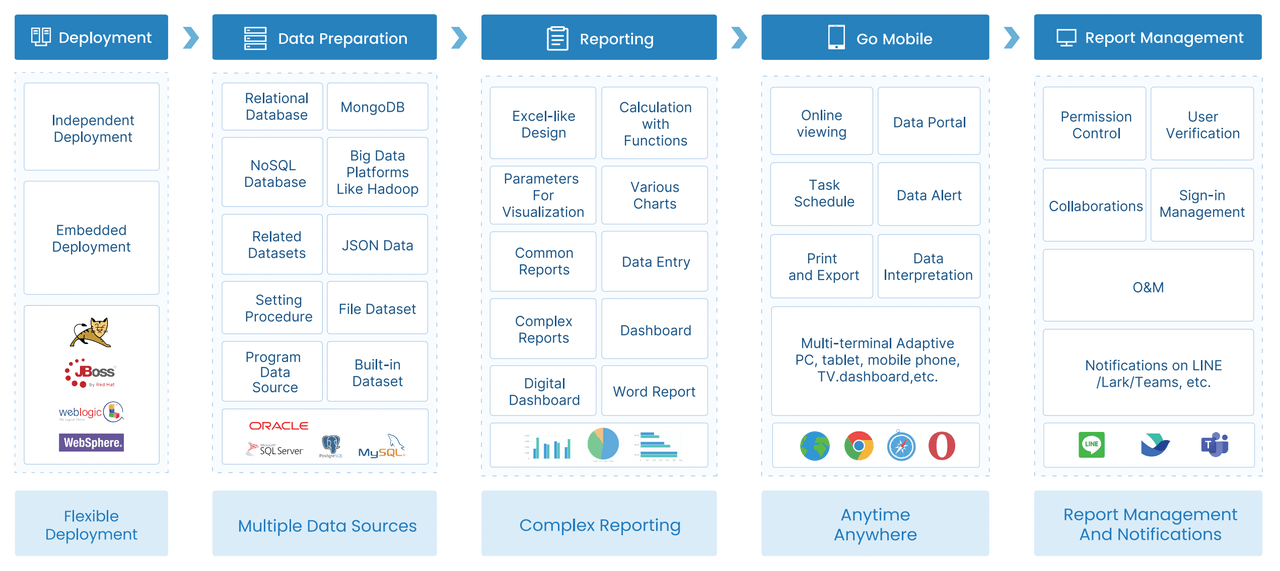
These practices are much easier to sustain when reporting is automated, visual, and integrated with plant data rather than manually consolidated across spreadsheets.
Build Smarter Production Reporting with FineReport
Building this manually is complex; use FineReport to utilize ready-made templates and automate this entire workflow. For enterprise manufacturers, the challenge is not just creating a production report once. The challenge is maintaining a reliable reporting system across shifts, lines, plants, and stakeholders without version confusion, delayed updates, or inconsistent KPI logic.
FineReport helps teams build production reports that are operationally useful and executive-ready. With it, you can:
Connect production data from multiple systems
Standardize KPI definitions across sites
Create daily and monthly production report templates
Visualize planned vs. actual output, downtime, scrap, and OEE
Add exception logs, approvals, and drill-down analysis
Automate report generation and distribution by schedule
That means less time collecting numbers and formatting spreadsheets, and more time acting on the insights. For manufacturers trying to improve throughput, reduce losses, and increase reporting discipline, that is the real value.
If your current production report process depends on manual exports, fragmented Excel files, and delayed follow-up, it is time to upgrade to a system built for speed, accuracy, and action.
A production report helps manufacturers compare planned output with actual results, explain performance gaps, and decide what action to take next. It gives supervisors and managers a clear view of output, downtime, quality, labor, and schedule risk.
Most production reports include output volume, planned versus actual production, downtime, scrap rate, rework, labor utilization, machine uptime, and OEE when equipment performance matters. The best KPI set is small, consistent, and tied to operational decisions.
A dashboard usually gives a live, high-level view of operations, while a production report records performance for a specific shift, day, week, or month. Reports also tend to include causes, comments, and follow-up actions for accountability.
The right frequency depends on the production environment, but many manufacturers create reports by shift or by day. Faster reporting cycles help teams catch losses early and recover schedules before issues spread.
A useful production report combines KPIs with operational context such as machine, line, shift, defect cause, downtime reason, and corrective action. This makes it easier to move from raw data to staffing, maintenance, scheduling, or quality decisions.
Product Trial
FineReport
Pixel-perfect reports · Interactive dashboards · Easy data entry · Digital twins