You might feel nervous the first time you see a financial report example. Do not worry. You can understand every part of a financial report example if you break it down step by step. Each term and number has a simple meaning. With the right financial report example, you can see how money moves in a business in Malaysia. Tools likeFanRuanand FineReportmake the process much easier. Try using these tools as you learn.
What Is Financial Report Example
Financial statements give you a clear picture of a company’s financial health. You use these reports to see how much money comes in, how much goes out, and what remains. As a business user or a beginner in Malaysia, you rely on financial statements to understand if a company is making a profit, managing its debts, and using its resources wisely. These documents help you make smart decisions, whether you run a business in Malaysia or want to learn about one.
FanRuan and FineReport make financial statements easier to read and understand. With these tools, you can view data in simple charts and tables. You do not need to be an expert to spot trends or find important numbers. FineReport lets you connect to different data sources, so you see all your financial information in one place. This saves you time and helps you avoid mistakes.
Financial statements matter because they help you answer key questions about a business in Malaysia. You can see if the company is profitable, if it can pay its debts, and if it uses its resources well. Here are some reasons why financial statements are important:
Gross profit margin shows how well the company manages costs.
Net income percentage tells you how much profit remains after all expenses.
Days in accounts receivable reveal how quickly customers pay.
Current ratio signals if the company can meet short-term obligations.
Comparing results to industry averages and past periods helps you spot strengths and weaknesses.
Analyzing cash flow alongside income statements prevents you from making wrong assumptions about profits and cash.
Budget comparisons let you see if the company meets its goals.
Watching economic trends helps you prepare for changes in the market.
With FanRuan and FineReport, you can visualize these indicators and spot patterns quickly. You gain confidence as you review financial statements and make better decisions for your business in Malaysia or studies.
Main Sections Overview of Financial Report Example in Malaysia
When you look at a financial report, you see three main sections: the balance sheet, the income statement, and the cash flow statement. Each section gives you a different view of a company’s financial health. You can use these sections together to get a complete picture. FineReport helps you bring all this information together in one place, making it easier to analyze and visualize your data.
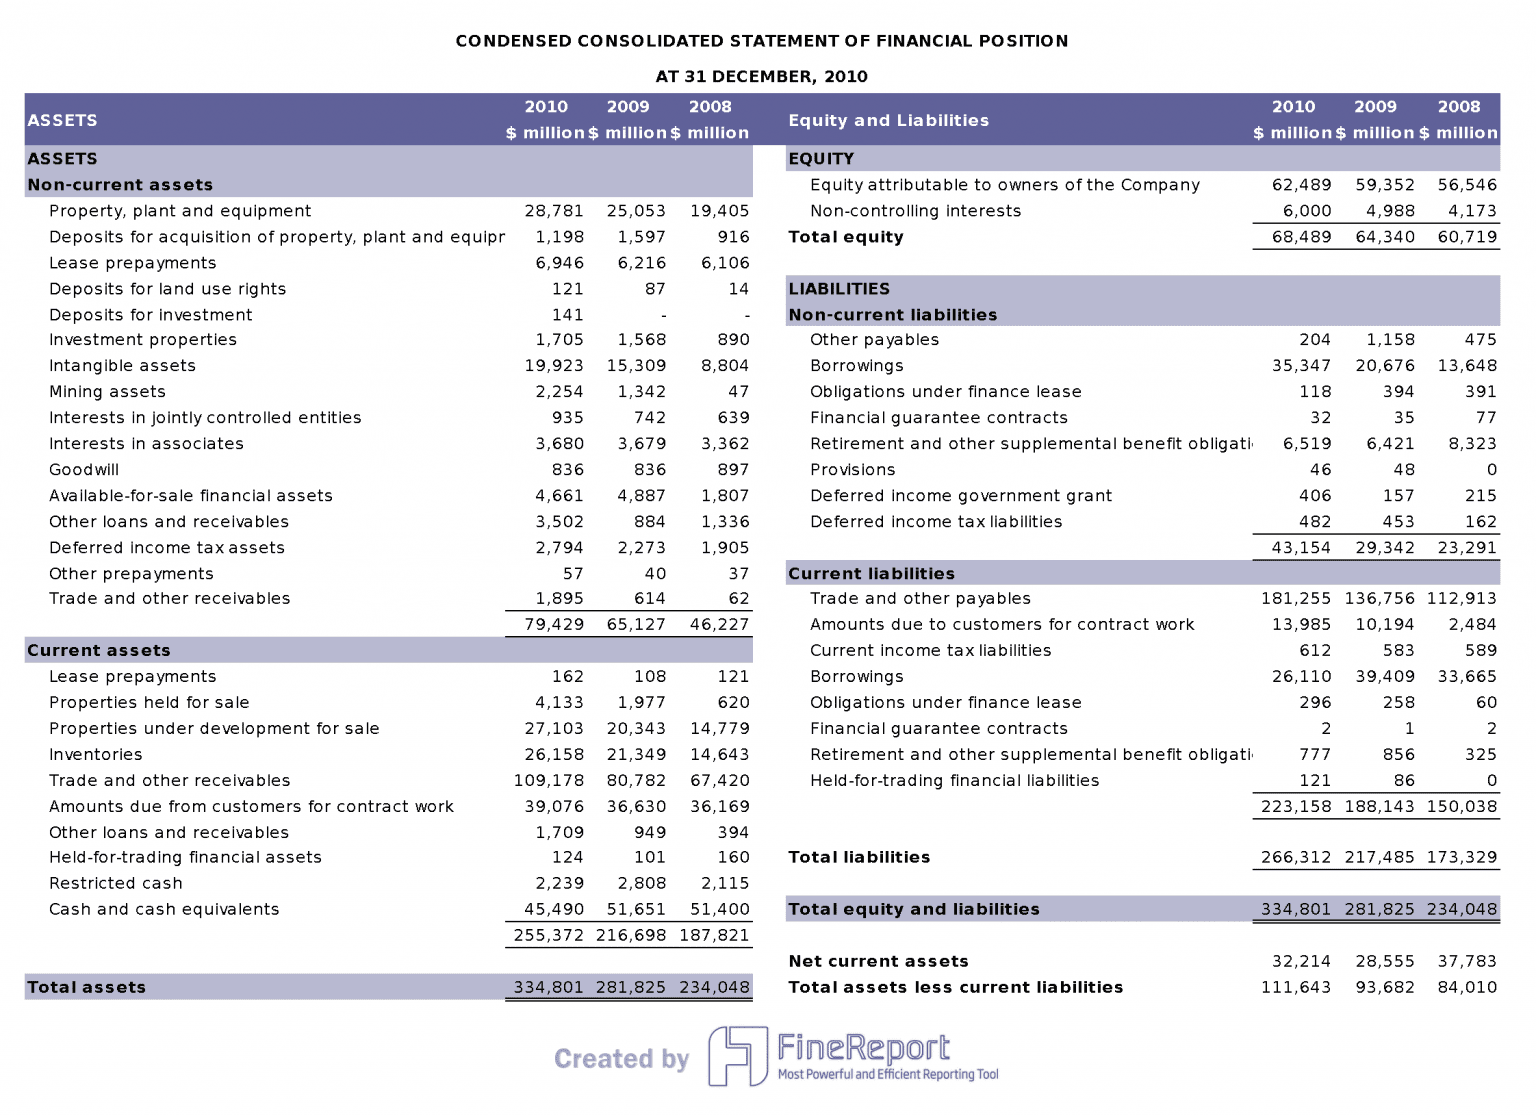
Balance Sheet
The balance sheet shows what a company owns and owes at a specific point in time. You see assets, liabilities, and equity. This section helps you measure the company’s stability and risk. You can check if the company has enough assets to cover its debts. The balance sheet also lets you compare how much money comes from owners versus lenders.
Tip: Use the balance sheet to spot trends in assets and debts over time. FineReport can display these trends in easy-to-read charts.
You can find important numbers on the balance sheet, such as:
Debt-to-equity ratio (shows how much debt the company uses compared to equity)
Current ratio and quick ratio (measure short-term liquidity)
Asset composition (tangible vs. financial assets)
Days to collect receivables and days to sell inventory
Numerical Indicator
Definition / Formula
Why It Matters
Debt-to-Equity Ratio
Total Liabilities / Equity
Measures risk and leverage
Return on Assets (ROA)
Net Income / Total Assets
Shows how well assets create profit
Inventory Turnover
Cost of Goods Sold / Average Inventory
Reveals how quickly inventory sells
Receivable Turnover
Net Credit Sales / Average Accounts Receivable
Tracks how fast you collect payments
Companies test long-term assets for impairment. If an asset’s value drops, they write it down. This keeps the balance sheet reliable. Assets are also amortized over time, which helps you compare companies across industries.
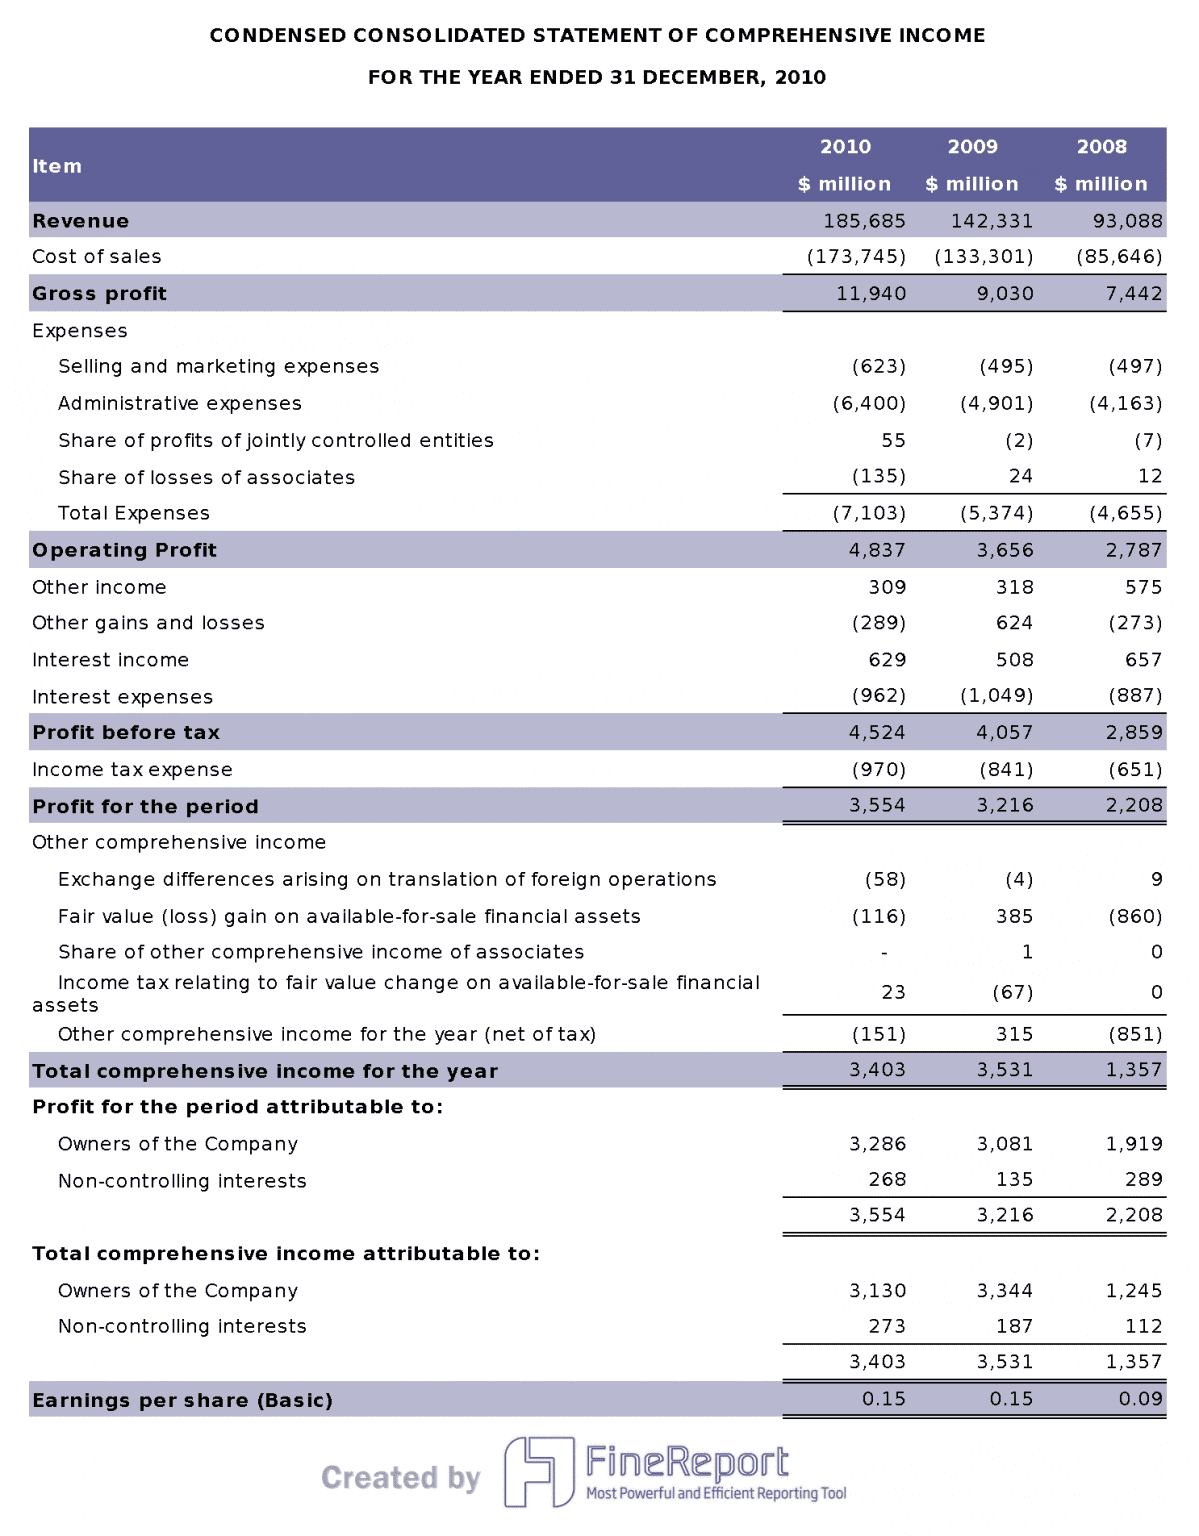
Income Statement
The income statement tells you how much money the company made and spent during a period. You see revenue, expenses, and profit. This section helps you understand if the company is making money or losing it. You can track growth, spot cost problems, and see how well the company controls spending.
Note: FineReportcan show these numbers side by side, so you can compare them easily.
Key performance indicators from the income statement include:
Revenue (top line)
Net profit (bottom line)
Gross margin
EBITDA (operating performance)
Net profit margin
Current ratio
Burn rate
These numbers help you see if the company is growing, staying stable, or facing trouble.
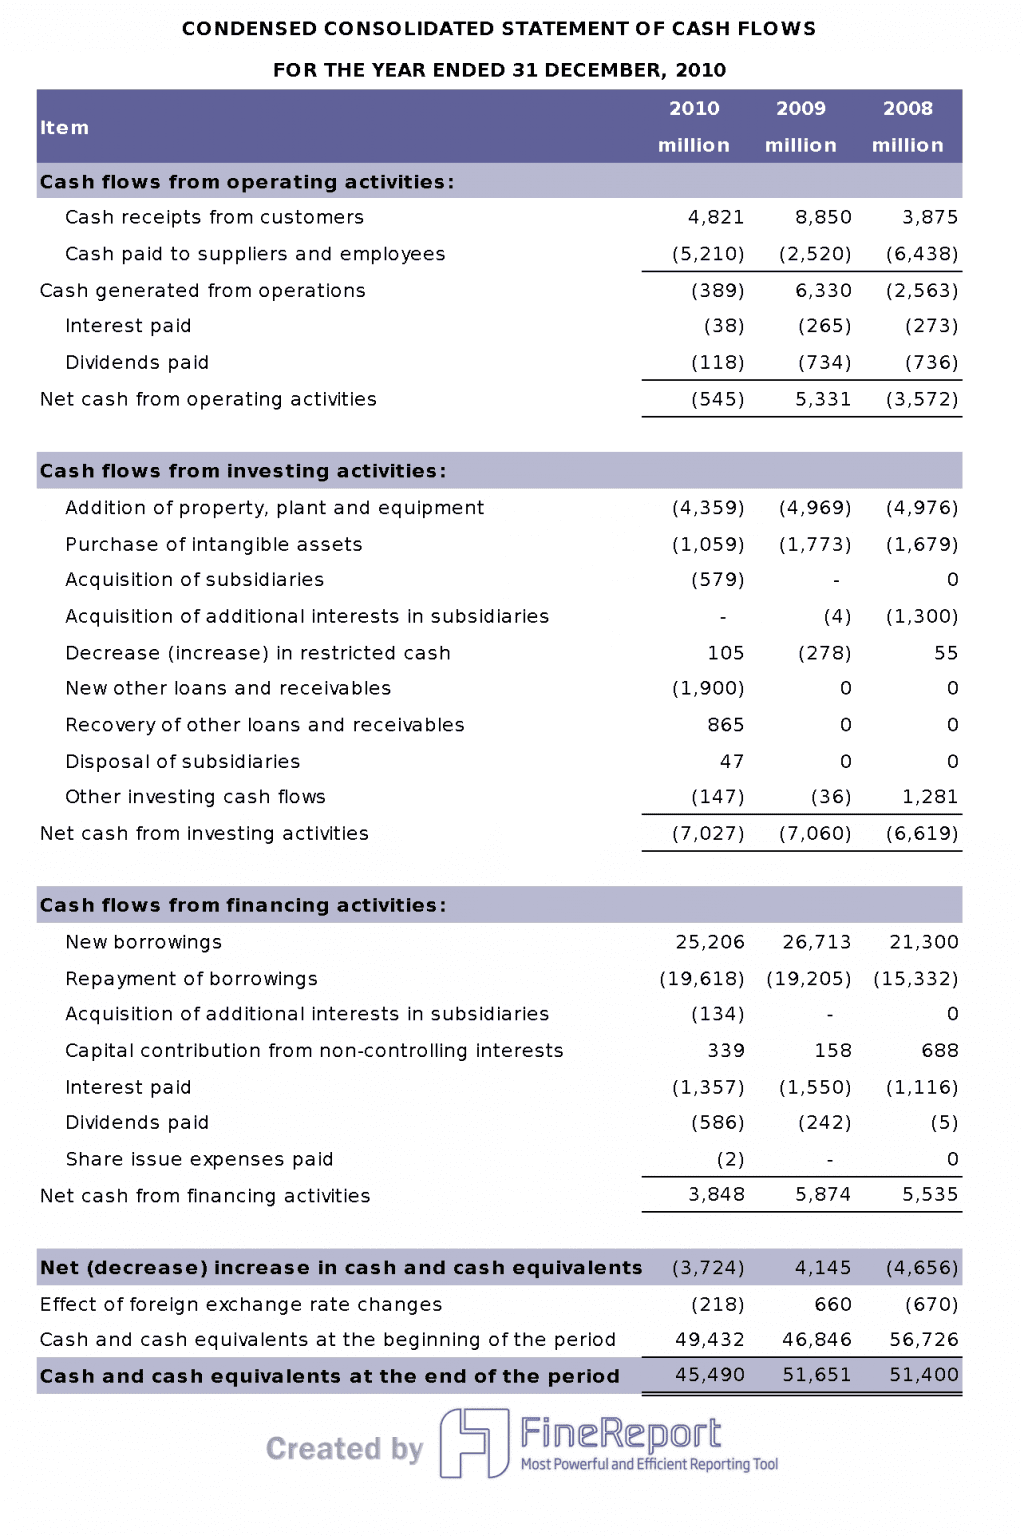
Cash Flow Statement
The cash flow statement tracks the movement of cash in and out of the business in Malaysia. You see cash from operations, investing, and financing. This section helps you know if the company can pay its bills and invest in growth. You can spot if profits are real or just on paper.
You can use the cash flow statement to:
Check liquidity status
See where cash comes from and where it goes
Measure free cash flow for investments
Track net increase or decrease in cash
To get the most from the cash flow statement, use methods like:
Trend analysis (look for patterns over time)
Comparative statements (compare with past periods or other companies)
Forecasting models (predict future cash flows)
Key metrics (free cash flow, cash flow margin)
FineReport lets you visualize these trends and compare cash flows with other financial data. This makes it easier to spot problems or opportunities.
When you use the balance sheet, income statement, and cash flow statement together, you get a full view of a company’s financial health. FineReport brings all these sections into one dashboard, so you can analyze, compare, and make better decisions.
When you start understanding financial statements, you unlock the story behind a company’s numbers. You see how well a business in Malaysia manages its money, meets its obligations, and grows over time. Let’s break down the key parts you should focus on.
Key Ratios
Financial ratios help you measure a company’s health. You use these ratios to compare numbers from the balance sheet, income statement, and cash flow statement. By looking at these ratios, you can quickly spot strengths and weaknesses.
Here are some of the most important financial ratios and their healthy benchmarks:
Tip: Compare these financial ratios to industry averages. This helps you see if a company is leading or lagging behind its peers.
You should also track these ratios over several years. This shows you if the company is improving or facing trouble.
What to Look For
When you review financial statements, look for patterns and warning signs. Trends tell you if the company is moving in the right direction. Red flags warn you about possible problems.
Watch for these patterns:
Sharp increases in cash or cash equivalents may signal irregularities.
Big changes in accounts receivable or inventory can point to manipulation.
Large jumps in profit, especially if not matched by peers, could mean financial statement fraud.
High or unstable debt levels may show financial distress.
Delayed or skipped dividend payments can be a warning sign.
If dividend payments do not match cash flow, check for earnings management.
Compare financial distress scores with industry peers to spot manipulation.
You can also use these steps to deepen your analysis:
Analyze cash flow statements to see if core operations generate enough cash.
Use financial ratios over time and against industry peers to check financial health.
Separate profits from normal operations and one-time gains.
Read the Management Discussion and Analysis (MD&A) for management’s view.
Consider nonfinancial factors like brand strength and market share.
Prepare forecasted financial statements to predict future results.
Apply valuation methods to estimate company value.
Note: Use horizontal, vertical, and ratio analysis to detect unusual changes. Data analytics tools can help you spot outliers and trends quickly.
Using FineReport for Analysis
You can make your financial analysis much easier and more accurate with tools like FanRuan and FineReport. FineReport lets you connect to multiple data sources, so you see all your financial statements in one place. You can use drag-and-drop features to build custom dashboards and reports.
FineReport’s visualization tools help you:
Create interactive charts and dashboards that show trends and outliers.
Drill down into specific data points for deeper understanding.
Adjust chart types, colors, and filters to highlight important information.
Update your reports in real time as new data comes in.
With FineReport, you can compare financial ratios across years and against industry benchmarks. You can spot trends, identify red flags, and make better decisions. The platform supports advanced analysis, such as OLAP and scenario modeling, which helps you forecast future performance and plan for growth.
FineReport’s dashboards make understanding financial statements simple. You see the big picture and the details, all in one place.
By using these tools and focusing on key financial ratios, you gain a deeper understanding of a company’s financial health. You can spot opportunities, avoid risks, and support smarter business decisions in Malaysia.
Common Mistakes and Questions of Financial Report Example
Confusing Terms
When you first look at financial statements, you may feel overwhelmed by unfamiliar words. Many beginners struggle with terms like “accruals,” “depreciation,” or “amortization.” You might also mix up assets and liabilities or confuse revenue with profit. If you want to learn how to read a balance sheet, you need to know that assets are what the company owns, while liabilities are what it owes. Equity is the value left for owners after paying debts.
Learning how to read an income statement means understanding the difference between gross profit and net profit. Gross profit is what remains after subtracting direct costs from revenue. Net profit is what is left after all expenses. When you study how to read a cash flow statement, you see the difference between cash from operations, investing, and financing. Each section tells a different part of the company’s story.
Tip: Keep a glossary of common financial terms nearby. This helps you quickly check any word you do not understand.
Typical Errors
You may make some common mistakes when you start reading financial statements. These errors can lead to wrong conclusions about a company’s health.
You might skip vertical or horizontal analysis, missing important trends in the income statement.
You may not notice unusual spikes or drops in numbers, which could signal problems.
Many beginners do not use financial ratios, so they miss key insights about liquidity, efficiency, or profitability.
You might forget to compare current data with past years or industry averages.
Some people do not investigate big differences or unexplained changes in the numbers.
You may not update cash flow forecasts, which makes it hard to judge if the company can pay its bills.
Misunderstanding gross margin or net profit margin can lead to mistakes about business performance in Malaysia.
Studies show that about 59% of accountants make multiple errors each month. Paper-based invoices have a 39% chance of containing an error. These numbers show that even professionals can struggle, so it is normal to make mistakes as a beginner.
How to Avoid Them
You can avoid many mistakes by following a few simple steps:
Always review the definitions of key terms before you start. This helps you understand how to read a balance sheet, how to read an income statement, and how to read a cash flow statement.
Use vertical and horizontal analysis to spot trends and outliers. Look for numbers that change a lot from one period to the next.
Calculate and review financial ratios. These ratios help you measure liquidity, profitability, and efficiency.
Compare your results with previous years and industry standards. This gives you context for your analysis.
Investigate any large or unusual changes in the numbers. Ask questions if something does not make sense.
Update your cash flow forecasts regularly. This helps you track if the company can meet its obligations.
Quick Reference Checklist of Financial Report Example in Malaysia
Step-by-Step Guide
You can make reviewing financial reports much easier by following a clear, step-by-step process. This approach helps you avoid missing important details and builds your confidence over time. Here is a simple checklist you can use every time you review a financial report:
Gather all relevant documents, such as the balance sheet, income statement, and cash flow statement.
Read the introduction or summary to understand the company’s goals and recent changes.
Review the balance sheet to see what the company owns and owes.
Examine the income statement to check revenue, expenses, and profit.
Analyze the cash flow statement to track how money moves in and out.
Calculate key financial ratios, such as current ratio and return on assets.
Compare results with previous years and industry averages.
Look for trends, unusual changes, or red flags.
Read the notes and management discussion for extra context.
Use visualization tools like FineReport to create charts and dashboards for deeper analysis.
Tip: Following a checklist can save you time and reduce errors. For example, Tanger Outlets shortened their year-end close from three weeks to two by using an integrated checklist and software.
Organization
Efficiency Improvement Description
Numerical Data / Metric
Mission Health
Accelerated book closing process using checklist
Closed books 15% faster
KPJ Healthcare
Reduced personnel for closing group accounts
From 4 people to 1 person
Tanger Outlets
Shortened year-end close with checklist and software
Reduced close time from 3 weeks to 2
A step-by-step guide helps you break down complex reports, such as how to read an annual report, into manageable parts. This method improves your understanding and supports better decision-making.
Practical Tips for Building Confidence When Reviewing Financial Report Example
You can build your confidence by practicing good financial habits and using practical review tips. Here are some ways to strengthen your skills:
Create and track a budget to understand your income and expenses.
Pay bills on time using reminders or automatic payments.
Check your credit report regularly to monitor your financial health.
These habits help you become more comfortable with financial reports and boost your financial literacy. Studies show that people who follow practical tips and work with advisors score higher on financial literacy tests and feel less stress.
Measure
Result
Interpretation
Retirement Income Literacy Score (Advised vs Non-Advised)
38% vs 27%
Higher scores show better literacy.
Financial Well-Being Scale Score (Advised vs Non-Advised)
50% vs 41%
Improved well-being with guidance.
Financial Anxiety Reduction
20% less anxiety
Less worry about finances.
Financial Stress Reduction
25% less stress
Lower stress levels.
When you use a checklist and practical tips, you gain the skills to understand how to read an annual report and other financial documents. FineReport can help you generate reports quickly, visualize trends, and review data efficiently. With regular practice, you will feel more confident and make smarter financial decisions.
Best Financial Report Example & Sample in Malaysia
Choosing the right template helps you understand financial data faster and make better decisions. You can use dashboards to see important numbers at a glance. Here are three of the most useful templates you can try.
Financial Performance Dashboard
A financial performance dashboard gives you a clear view of how your business in Malaysia is doing. You can track spending, compare budgets, and spot trends. This dashboard brings together key metrics in one place, so you do not have to search through different reports.
Here is a table showing some important metrics you might see:
Financial Performance Metrics
Purpose/Advantage Highlighted
Year-to-date budget vs. actuals (current and previous years)
Enables tracking of spending accuracy and forecasting, improving financial control
Provides detailed insight into cost drivers and resource allocation
Salary actuals by month and funding source
Allows monitoring of payroll expenses and funding efficiency over time
Operating expense line-item detail with variance calculation
Facilitates identification of budget deviations and operational efficiency
Budget adjustments and open purchase orders
Enhances transparency and real-time financial status awareness
Anticipated results and unspent funds rollover
Supports strategic planning and sustainability assessment
Dashboards like this help you make decisions quickly. You see all the important numbers in one place, which reduces confusion and helps you focus on what matters most.
You can use FineReport to build these dashboards. The tool lets you connect to different data sources and update your dashboard in real time.
A financial KPI dashboard shows you the most important key performance indicators for your business in Malaysia. You can track growth, profits, and costs. This dashboard helps you see if your business in Malaysia is healthy and where you need to improve.
You can also track special KPIs for startups, such as net burn, cash runway, and cash zero date. These numbers show how long your business in Malaysia can last and when you might need more funding.
With a KPI dashboard, you can see trends and spot problems before they get bigger. FineReport makes it easy to create and customize these dashboards for your needs.
Financial CFO Dashboard
A financial CFO dashboard gives you the tools to guide your company’s strategy. You can track revenue, expenses, and cash flow in real time. This dashboard helps you make fast decisions and manage risks.
Here are some key facts about CFO dashboards:
A 5% increase in customer retention can boost profits by up to 95%.
Companies using customer lifetime value insights often see a 14% rise in revenue.
Real-time cash flow forecasting can lower working capital needs by 15-20%.
You should check revenue variance if it changes by more than 5%. Review expense variance if it moves by more than 3%.
Real-time data lets you make decisions in minutes, not days.
You can track metrics like revenue growth rate, gross margin, EBITDA, operating expenses, cash flow forecasting, customer acquisition cost, debt-to-equity ratio, and variance to budget. FineReport helps you bring all these numbers together, so you can see the big picture and act quickly.
A CFO dashboard supports better planning and helps you keep your business in Malaysia on track. You can use it to spot risks, find new opportunities, and improve overall performance.
You now know how to read a financial report example step by step. Use the checklist and practice with real reports to build your skills. FineReport helps you see patterns and make better choices. When you use these methods, you gain:
More accurate understanding of financial relationships in each financial report example
Better identification of what drives returns
Stronger risk management and forecasting
These habits support your journey toward financial literacy. Keep learning and you will feel more confident every time you review a report.
Click the banner below to try FineReport for free and empower your enterprise to transform data into productivity!
Real-time insights to optimize production, logistics, and decisions.
FAQ
What is the easiest way to start reading a financial report?
Start with the summary or introduction. Look for the balance sheet, income statement, and cash flow statement. Use a checklist to guide you. FineReport can help you organize and visualize the data for easier understanding.
How do I know if a company is profitable?
Check the net profit on the income statement. Compare revenue and expenses. Use the net profit margin ratio. If the number is positive and growing, the company is likely profitable.
What tools can help me analyze financial reports?
You can use FineReport to connect data sources, create dashboards, and visualize trends. The tool helps you spot patterns, calculate ratios, and generate reports quickly. This makes analysis easier for beginners.
Why do financial statements use so many terms?
Financial statements follow accounting rules. Each term has a specific meaning. You can keep a glossary nearby. Over time, you will learn what each term means and how it affects the report.
How often should I review financial reports?
You should review reports every quarter and at year-end. Regular reviews help you spot trends, catch problems early, and make better decisions. Many companies use monthly dashboards for ongoing monitoring.