A strong reporting system helps you track key metrics, improve coordination, and support your strategy in Malaysia. Look for user-friendlyreporting tools that offer seamless integration and scalability. Systems that adapt quickly and provide real-time reporting drive better business performance. The table below highlights how effective performance report processes support business success.
Statistic
Supporting Detail
Organizations with effective performance practices are 4.2x more likely to achieve organizational success
Shows strong correlation between performance management and success
Demonstrates trend towards alignment with business goals through technology
Key Takeaways
Start by defining clear business goals and choose KPIs that directly support those goals.
Involve stakeholders from different teams to ensure the system meets real needs and gains wide acceptance.
Look for a performance report system with strong integration to connect all your business tools and data sources.
Choose software that can scale as your business grows, handling more data and users without slowing down.
Pick a user-friendly system with easy-to-use features to encourage quick adoption and efficient reporting.
Use advanced analytics and visualization tools to turn data into clear insights and support faster decisions.
Align your reporting system with your company’s strategy to boost employee engagement and improve results.
Test software options thoroughly, consider pricing and support, and build a strong business case before making your final choice.
Define Business Needs for Performance Report System Malaysia
Before you select a performance report system, you need to define your business needs. This step sets the foundation for effective performance management software and ensures your reporting tools deliver real value.
Set Objectives
Start by setting clear objectives for your performance management system. When you know what you want to achieve in Malaysia, you can choose the right reporting features and avoid wasted effort. Companies that set ambitious, measurable goals see real results. For example, look at how different organizations benefit from clear objectives:
Company in Malaysia
Objective Setting Approach
Outcome / Metric Achieved
Company A
Clear, ambitious objectives with measurable key results
30% revenue increase within one year
Company B
Inclusive goal-setting and regular feedback loops
35% improvement in employee engagement
Intel
Clarity and shared understanding of objectives
20% increase in project completion rates
Spotify
Clear objectives with quantifiable key results
35% increase in user engagement
Various Companies (Study Data)
Use of OKRs with transparency and collaboration
Up to 35% improvement in employee retention and 30% increase in productivity
When you define your objectives, you guide the selection of relevant reporting metrics and ensure your performance management software supports your business strategy.
Tip: Defining clear strategic goals before creating performance reports ensures your reporting meets its intended purpose and helps you select the right KPIs.
Identify KPIs
Next, identify the key performance indicators that matter most to your business in Malaysia. KPIs help you track progress and measure success in your performance management system. They offer a simple, quantitative way to monitor complex business activities Malaysia. When you choose the right KPIs, you make your reporting more effective and actionable.
KPIs enable continuous quality improvement by benchmarking and comparing performance metrics.
Internal assessments using KPIs help you learn from achievements and errors, providing accountability and feedback.
KPIs facilitate monitoring progress, decision-making, and support accreditation and ranking processes in Malaysia.
Overcoming challenges in selecting and implementing KPIs allows better performance tracking and organizational improvement.
To get the most from your KPIs, follow these steps:
Understand each KPI’s definition, data sources, and measurement context.
Analyze KPI data for trends, patterns, and anomalies using statistical and visualization methods.
Compare KPI results against targets to assess progress toward goals.
Identify root causes of performance issues affecting KPIs.
Make informed decisions to adjust strategies and interventions in Malaysia based on KPI analysis.
Communicate KPI results clearly to stakeholders to build support and transparency.
KPIs play a critical role in performance reporting and decision-making. They help you focus your performance management software on what truly matters for your business. Here is an interactive demo created by FineReport, click to experience it.
Involve Stakeholders
You should always involve stakeholders when defining your business needs for a performance management system in Malaysia. Stakeholder engagement improves decision-making and ensures your reporting addresses real business questions. When you collect feedback from stakeholders, you capture valuable insights and avoid missing important requirements.
Stakeholder engagement in Malaysia improves the relevance and feasibility of your performance management software.
Involving diverse groups, such as employees, managers, and IT staff, helps you identify and correct weaknesses in your reporting process early.
Collaboration fosters knowledge sharing and leads to better reporting outcomes.
Creating a safe, open environment empowers participants and encourages honest feedback.
Stakeholder involvement shapes your performance management system and reporting tools in Malaysia, making them more effective and accepted across your business. This approach increases the likelihood of success and supports long-term performance improvement.
Key Features in Performance Report System in Malaysia
When you evaluate a performance report system, you need to focus on the key features that drive business value. These features help you get the most from your performance management software and ensure your reporting supports your goals. Let’s explore three essential areas: integration options, scalability, and user-friendliness.
Integration Options
Integration is one of the most important features in any performance management system. You want your performance report system to connect smoothly with other business tools. Integration with other systems allows you to pull data from multiple sources, making your reporting more accurate and complete.
A strong integration framework helps you break down data silos. When your performance management software links with HR, finance, and operations platforms, you get a full view of your business performance in Malaysia. This connection supports better decision-making and reduces manual work.
Note: A case study from the Friuli Venezia Giulia Region in Italy shows that integrated IT systems and shared objectives enable better performance and risk management. When organizations use separate software for each function, they face more obstacles and less effective reporting.
You should look for these integration features:
Support for APIs and data connectors to link with databases, cloud services, and third-party apps.
Real-time data synchronization to keep your performance management system up to date.
Flexible options for integration with other systems, so you can adapt as your business grows.
Integration options make your reporting more powerful and help your performance management software deliver actionable insights.
Scalability
Scalability is another key feature you cannot ignore. As your business grows in Malaysia, your performance management system must handle more data, users, and reporting needs. A scalable performance report system supports your growth without slowing down or losing accuracy.
The need for scalability becomes clear when you look at how fast data and business demands increase. Here is a table that highlights some important metrics:
Increase from thousands to millions of jobs processed
Algorithmic trading CAGR
12% compound annual growth rate through 2026
Data scale
Need to handle billions of files and large datasets
SaaS ARR growth velocity
3-4x YoY growth from $1M to $10M ARR
Storage scalability
Clusters can scale linearly to petabytes of capacity
You need a performance management software that can scale with your business in Malaysia. This means it should support more users, larger datasets, and more complex reporting as your needs change. Scalability ensures your performance management system remains reliable and efficient, even as your company expands.
User-Friendliness
User-friendliness is a critical factor in the success of any performance management software. If your team in Malaysia finds the system easy to use, they will adopt it quickly and use it more often. User-friendliness and adoption go hand in hand. A simple, intuitive interface helps everyone—from managers to analysts—create and view reports without heavy training.
Modern performance report systems offer features that boost user-friendliness:
Visual and interactive elements make reports easier to understand and explore.
Filters and real-time data help you answer questions and spot trends fast.
Pre-made templates save time and automate reporting tasks.
Customization options allow you to align reports with your KPIs and company branding.
Sharing features let you collaborate with your team in Malaysia and control access to sensitive data.
User-friendliness and adoption improve productivity and reporting efficiency. When your performance management system is easy to use, you spend less time on training and more time on analysis. This leads to faster decision-making and better business performance in your Malaysia business.
Tip: Choose a performance report system that balances advanced features with user-friendliness. This approach ensures your team in Malaysia can use all the key features without feeling overwhelmed.
Analytics and Visualization
Analytics and visualization stand at the heart of any effective performance report system. You need these features to turn raw data into clear, actionable information. When you use advanced analytical capabilities, you can quickly spot trends, identify issues, and make better decisions.
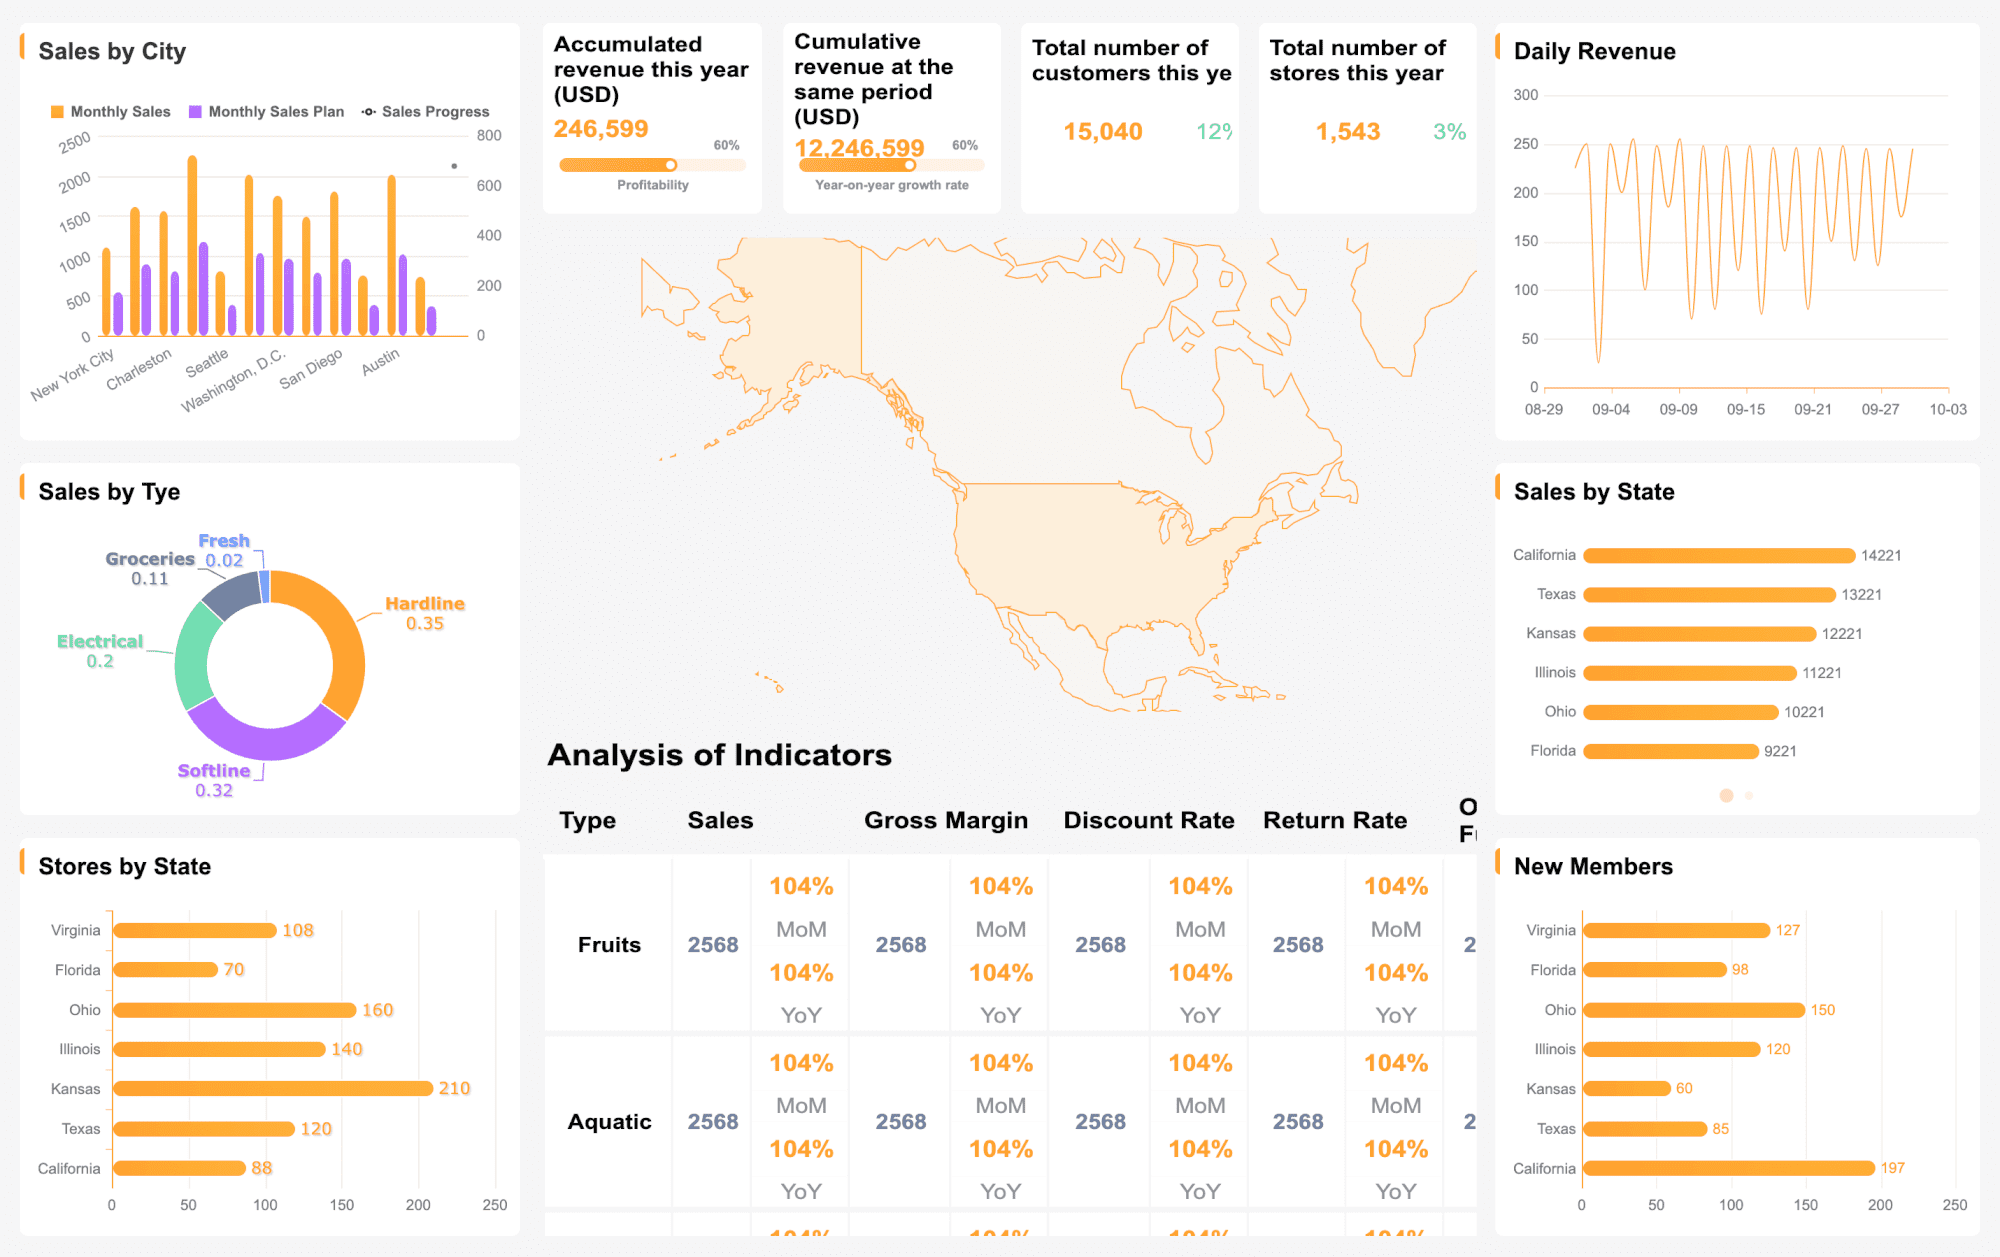
A strong performance reporting dashboard gives you a real-time view of your business in Malaysia. You see key metrics and patterns as they happen. This level of reporting and analytics helps you respond to changes faster and stay ahead of problems.
Modern systems offer a wide range of analytics features. These include interactive charts, automated reporting, and customizable dashboards. You can explore your data visually, which makes complex information easier to understand. With dashboard customization, you decide which metrics matter most and how you want to see them.
Visualization tools improve data accessibility and insights. They let you drill down into details or zoom out for a big-picture view. You can filter, group, and compare data with just a few clicks. This flexibility supports better reporting and analytics across your organization.
Here are some ways analytics and visualization improve your performance reporting system:
Centralized oversight lets you manage data from multiple sources in one place.
Automated data insights highlight quality issues and compliance risks.
Intuitive visualization tools give you quick access to important evidence and progress.
Tailored reports help you find and fix problems faster in Malaysia.
Automation and visualization reduce the time you spend searching for answers.
Integration with other systems ensures seamless data exchange and real-time monitoring.
Proactive risk management becomes possible when analytics highlight potential issues early.
These features build trust in your data and support smarter decisions.
You benefit from advanced analytical capabilities in several ways:
Consistent terminology and cohort building make your studies repeatable and reliable.
Collaboration and sharing features improve communication and reproducibility.
Automated reporting delivers results in minutes, giving you actionable insights fast.
Transparent, standards-based design ensures your data remains trustworthy.
Access to NLP-enriched data expands your ability to generate real-world evidence.
These advanced features improve monitoring, analysis, and reporting effectiveness.
You want a system that supports both automated reporting and manual exploration. This combination increases accessibility for all users, regardless of technical skill. When you have strong analytics and visualization, you unlock the full value of your data. You gain better data accessibility and insights, which drive business growth and efficiency.
A modern dashboard should adapt to your needs. You can customize views, set alerts, and share findings with your team in Malaysia. Real-time reporting ensures you always work with the latest information. These features make your reporting and analytics process more powerful and user-friendly.
Match Features to Business Goals for Performance Report System Malaysia
Align with Strategy
You need to make sure your performance management software supports your business strategy in Malaysia. When you align the features of your performance report system with your company’s goals in Malaysia, you help everyone move in the same direction. Research shows that employees who understand how their work connects to business objectives become more productive and engaged. You can see these benefits in several ways:
Employees aligned with organizational goals are 35% more efficient and productive.
80% of aligned employees describe themselves as very productive.
70% of aligned employees feel a strong sense of belonging.
Alignment reduces disengagement and turnover by clarifying growth paths.
Structured performance conversations and regular check-ins help maintain alignment.
Unified performance management dashboards connect individual contributions to strategic goals, improving visibility and decision-making.
When you use a performance management system that focuses on strategic clarity, you get better reporting and more actionable insights. A Harvard Business Review case study found that companies improved outcomes by 20% after aligning reporting with their corporate strategy. You can also see faster reporting and better project management when you break down silos and use centralized KPI tracking.
Customization
Customization is key if you want your performance management software to fit your business in Malaysia. Every company has unique processes and goals. You should look for a performance management system that lets you tailor workflows, fields, and evaluations. This way, your performance reporting framework matches your company’s culture and needs in Malaysia.
Tailor system workflows to match your existing performance processes.
Configure custom fields and evaluations to capture unique review needs.
Align performance goals with larger business objectives.
Set SMART goals that are specific, measurable, achievable, relevant, and time-bound.
Automate reminders for regular manager-employee check-ins.
Customize reports and dashboards for different leadership levels.
Many organizations in Malaysia use frameworks like 360-degree feedback or Management by Objectives. These methods work best when you adapt them to your company’s strategy. Customization helps you track progress, foster feedback, and ensure your performance reporting framework reflects your priorities. With dashboard customization, you can focus on the metrics that matter most to each team in Malaysia.
A strong performance management system gives you the tools to make better decisions. Performance reporting should go beyond simple snapshots. You need features that help you understand trends and spot real issues. Statistical Process Control charts, for example, help you see if changes in performance are normal or need attention. This approach prevents you from reacting to normal fluctuations and helps you focus on true problems.
Statistical modeling and predictive analysis also play a big role. These methods use historical data to forecast issues and optimize resource allocation. For instance, Google used predictive analysis to cut data center cooling costs by 40%. Quality control tools like SPC and reliability growth models help you monitor and improve performance over time. When your performance management software includes these features, your reporting becomes more reliable and supports smarter decisions.
Your performance reporting framework should give you clear, data-driven insights. This helps you allocate resources, manage risks, and improve results. With the right performance report system, you can turn data into actionable insights and drive your business in Malaysia forward.
Evaluate Business Reporting Software Malaysia
Research Solutions
You need to start by researching different business reporting software options. This step helps you understand what each solution offers and how it fits your business needs. Look for platforms in Malaysia that support your performance management software goals and provide strong integration with your existing systems.
A comparison table can help you see the differences between leading business reporting software. For example:
Customizable dashboards, drag & drop report design, data source connectors, rich visualization, data entryfunctions, support for all mainstream databases, 19+ HTML5 chart types with 3D/dynamic effects
Call center reporting focus, operational insights, monitoring key statistics for call centers
Companies seeking to manage and improve reporting operations
Call centers needing reporting solutions
Support
Phone support, 24/7 live support, online support
Phone support, 24/7 live support, online support
API
Offers API
Offers API
Pricing
$1.00 one-time, free version, free trial
$150.00/month/user, free version, free trial
Company Info
FanRuan Software, founded 2006, China
eMetrix Systems, founded 2012, United States
FineReport by FanRuan stands out for its customizable dashboards, drag-and-drop report design, and support for all mainstream databases. It also offers advanced analytics and visualization features. You should consider these strengths when evaluating business reporting software for your performance management system.
Test FineReport by FanRuan
Testing business reporting software is a crucial step. You want to see how well the platform supports your performance management software needs. FineReport by FanRuan provides a free trial, so you can explore its features before making a decision.
When you test FineReport, focus on user-friendliness and adoption. The drag-and-drop interface makes it easy to create reports and dashboards. You can connect to multiple data sources and use advanced analytics to uncover insights. FineReport also supports real-time data updates, which is essential for a modern performance management system.
Peer reviews show that FineReport has a customer satisfaction rating of 4.3, slightly higher than some competitors. Large enterprises and government organizations often choose FineReport for its strong analytics, custom reporting, and reliable vendor support. You can access 24/7 support channels, which helps you resolve issues quickly and keep your business in Malaysia running smoothly.
FineReport also offers low to medium risks in compliance, security, integration, and migration. This makes it a safe choice for your business reporting software needs in Malaysia.
Tip: During your trial, test how easily you can build reports, connect data sources, and share insights with your team. Check if the platform meets your performance management system requirements.
Pricing plays a big role when you select business reporting software. You want a solution that fits your budget and delivers value for your business in Malaysia. FineReportby FanRuan offers flexible pricing, including a $1.00 one-time option, a free version, and a free trial. This makes it accessible for businesses of all sizes in Malaysia.
Other platforms, such as The Reporting Engine, may charge $150.00 per month per user. You need to compare these costs with the features and support each platform provides. FineReport’s pricing structure, combined with its strong analytics and user-friendliness, gives you a cost-effective solution for your performance management software.
When you compare pricing, also consider the long-term value. Look at vendor support, training, and scalability. FineReport’s robust support and flexible integration options help you scale your performance management system as your business in Malaysia grows.
Note: Always review the total cost of ownership, including support and future upgrades, before making your final decision.
Assess Support
When you choose business reporting software, support and training matter as much as features. Reliable support ensures your performance management software works smoothly every day. If you run into issues, you want fast answers and clear guidance. Good vendor support helps you solve problems quickly and keeps your business running without delays.
You should look at several aspects when you assess support for business reporting software:
Customer service quality: Check if the vendor offers 24/7 support, live chat, or phone help. Fast and friendly service makes a big difference when you need help.
Training resources: See if the vendor provides tutorials, webinars, or user guides. These resources help your team learn the performance management software faster.
Communication: Vendors should offer clear and prompt communication. Personalized responses show that the vendor values your business and wants to help you succeed.
Customer references: Ask for references from other companies. Their experiences can tell you how reliable the vendor’s support is.
Qualification and expertise: Review the vendor’s training programs and staff qualifications. Well-trained support teams solve issues more efficiently.
Tip: Always test the support channels during your trial period. Send questions to the help desk and see how quickly and clearly they respond.
A strong support system for business reporting software includes more than just answering questions. It covers onboarding, troubleshooting, and ongoing updates. You want a vendor who helps you set up your performance management software and keeps you informed about new features or security updates.
Many experts recommend that you vet vendors beyond just pricing. Look for quality control, timely delivery, and the ability to handle your unique needs. Good support builds trust and helps you get the most from your business reporting software.
You should also consider scalability. As your company grows, your performance management software will need to handle more users and data. Make sure the vendor can support your growth with training and resources for new team members in Malaysia.
Here is a checklist to guide your evaluation:
Does the vendor offer multiple support channels?
Are training materials easy to access and understand?
Can you reach support quickly during critical times?
Do customer reviews mention positive support experiences?
Will the vendor help you scale your performance management software as your needs change?
Choosing business reporting software with strong support ensures you get value now and in the future. Your team in Malaysia will feel confident using the performance management software, knowing help is always available.
Performance Report System Malaysia Framework
A strong performance reporting framework helps you organize, track, and improve your business results. When you set up a clear structure, you make it easier to collect data, monitor progress, and review outcomes. This process supports better decision-making and ensures your team stays focused on what matters most.
Set Up Framework
You start by building a performance reporting framework that matches your business goals. Begin with a clear plan. Define what you want to measure and why. Use a structured approach to avoid fragmented measurement and ensure your reporting covers all important areas.
Researchers developed an integrated healthcare performance measurement framework by reviewing literature, mapping terms, and validating constructs. They grouped 110 performance terms into 12 constructs, covering patient, population, delivery organization, and system perspectives. These constructs measure coverage, accessibility, effectiveness, safety, efficiency, and equity. This method shows the value of a theoretical foundation for comprehensive, transparent, and multifaceted performance reporting. It also highlights the need to separate performance management from quality improvement, giving clarity and coherence to your reporting efforts.
You can see how different cases apply these ideas:
Case/Study
Country
Methodology
Setting
Purpose
Dos Santos et al. (2015)
Brazil
Case study
Public health system in a Southeastern town
Used Analytic Network Process and Balanced Scorecard for performance evaluation
Mutale et al. (2016)
Zambia
Interventional/Mixed Methods
Three rural districts
Proposed framework for evaluating health system strengthening intervention
Kruk and Freeman (2008)
N/A
Literature review
Health system
Proposed framework for health system performance assessment and indicator review
These examples show that a well-designed performance reporting framework uses multiple perspectives and constructs. This approach helps you avoid incomplete or misleading assessments.
Monitor Progress
Once you set up your performance reporting framework, you need to monitor progress. Regular tracking helps you see if your business is moving in the right direction. You should collect and analyze data on your chosen indicators. This step gives you real-time reporting and helps you spot trends early.
A structured performance reporting framework, like the one used by EVIPNet Europe, improves business outcomes by ensuring transparency and accountability. The framework uses a theory of change and outcome mapping. It focuses on contributions to outcomes, not just direct results. By selecting the right indicators, you measure progress, find challenges, and share knowledge across your team. This process supports continuous learning and adaptation, making your business strategies more effective in Malaysia.
Follow these steps to monitor progress:
Define performance indicators that match your business objectives.
Set baselines to understand your starting point.
Track data regularly to measure progress.
Analyze results to see if you meet your targets.
Share findings with stakeholders for transparency and engagement.
Adjust your performance reporting framework as needed to stay relevant.
This cycle keeps your performance reporting framework aligned with your business goals and supports ongoing improvement.
Review Results
Reviewing results is a key part of your performance reporting framework. You compare your data against baselines and targets. This step helps you evaluate effectiveness and efficiency in Malaysia. When you review results, you gain actionable insights that guide your next steps.
A regular review process increases data accessibility and insights. It also improves accessibility for all users. You can identify what works and what needs change. Sharing results with your team builds trust and encourages accountability. Adjust your performance reporting framework based on feedback and evidence. This keeps your reporting useful and up to date.
A strong performance reporting framework supports your business by making data easy to access, understand, and use. You get a clear view of your performance, which helps you make better decisions and drive success.
Avoid Common Pitfalls in Performance Report System Malaysia
When you select a performance reporting system, you want to avoid common mistakes that can slow down your progress or reduce the value of your investment. Many companies face challenges when they overcomplicate choices, ignore user input, or underestimate integration needs. By learning from these pitfalls, you can make smarter decisions and get the most from your performance reporting tools.
Overcomplicating Choices
You might think that more features or complex models will improve your performance reporting. However, adding too many options can make your system harder to use and understand. Research shows that simple models often work better than complicated ones. For example:
The Akaike Information Criterion (AIC) helps balance model complexity and accuracy. It penalizes systems with too many parameters, which can lead to overfitting and unreliable results.
Econometric studies show that models with fewer, well-chosen features provide more reliable predictions than those packed with unnecessary details.
Experts in discrete-choice experiments often disagree about the best complex methods. Many recommend using simpler, well-validated approaches for clarity and practical use.
When you keep your performance reporting system simple, you make it easier for everyone to interpret results and act on insights. You also reduce the risk of errors and make your system more robust.
Tip: Focus on the features and metrics that matter most for your business goals. Avoid adding extra layers that do not support your performance strategy.
Ignoring User Input
If you leave users out of the selection process, your performance reporting system may not meet their needs. Real-world studies highlight the risks of ignoring user feedback. Consider the following findings:
Study Type
Description
Key Findings
Iterative Usability Tests
Simulated ICU environment tested IV pump usability.
Found issues with alarms and displays; validated usability objectives.
Field Studies
Beta versions in hospitals, user surveys, and interviews.
Revealed alarm annoyance and data entry problems, showing real user challenges.
Summative Usability Tests
Nurses performed tasks in hospital scenarios.
Achieved high task completion; minor issues fixed; confirmed user input is vital.
Product Introduction
Data from initial users after launch.
Showed lab testing alone is not enough; ongoing feedback is critical for safety and usability.
Surveys can help you understand user attitudes, but they do not always reflect real behaviors. Users may forget or misreport how they use a system. Observational methods and performance-based tests give you more reliable data. Combining surveys with usability testing and analytics helps you catch problems early and build a better performance reporting experience.
Note: Involve users from different departments when you choose and test your performance reporting system. Their feedback will help you avoid costly mistakes and improve adoption.
Underestimating Integration
Many organizations underestimate the importance of integration when choosing a performance reporting system. If your system cannot connect with other tools, you may face data silos and incomplete performance insights. Integration allows you to bring together data from HR, finance, sales, and operations. This unified view supports better performance reporting and decision-making.
When you plan for integration from the start, you make it easier to scale your performance reporting as your business grows. You also reduce manual work and improve data accuracy. A strong integration strategy ensures your performance reporting system delivers the full picture, helping you track progress and reach your goals.
Remember: Integration is not just a technical detail. It is a key part of building a reliable and effective performance reporting system.
Make the Final Choice for Performance Report System
Weigh Pros and Cons
You reach the final stage of selecting a performance report system by weighing the pros and cons of each option. This step helps you make a rational decision that fits your business needs. Use tools like pros and cons lists, SWOT analysis, or decision matrices to compare alternatives. These methods help you see the strengths and weaknesses of each system clearly.
Advantages of a strong reporting system include motivating employees, recognizing high performance, and aligning with your business goals.
Drawbacks may involve increased competition among employees, short-term focus, or complexity in setup.
By listing these factors, you ensure that you consider every angle before making your choice. This approach maximizes positive outcomes and helps you avoid surprises after implementation. Careful evaluation also accounts for how each system will impact your team and your business as a whole.
Tip: Take time to research and weigh these factors. A systematic review leads to a more informed and confident decision.
Build Business Case
Building a solid business case is essential before you commit to a new performance report system. Start by defining clear objectives for what you want to achieve. Collect and integrate data from different sources to support your goals. Choose tools that match your business needs, such as those that offer strong analytics and easy data visualization.
A retail chain improved inventory and marketing decisions by analyzing monthly and regional sales trends. They used descriptive analytics and integrated data from multiple sources. An e-commerce company reduced cart abandonment by studying user behavior and adjusting marketing tactics. Both examples show that a strong business case relies on robust data collection and clear objectives.
Follow these steps to build your business case:
Set measurable goals for your reporting system.
Gather and prepare data from across your business.
Select tools that support your objectives and allow for easy reporting.
Use data visualization to present your findings and justify your choice.
A well-prepared business case demonstrates the value of your chosen system. It shows how the system will improve decision-making, efficiency, and customer satisfaction.
Get Buy-In
Securing buy-in from executives and stakeholders is a key part of a successful rollout. When you show how the new system benefits the entire business, you increase support and adoption. Use pilot data to highlight short-term wins and demonstrate long-term value.
Stakeholders care about ease of use, productivity, and problem-solving. Address these points to gain their trust. When executives support your choice, they provide strategic direction and resources. Their involvement helps you overcome challenges and keeps the project on track.
Involve executives early to align financial and operational decisions with your project.
Include diverse teams, such as marketing and operations, to ensure the system meets broad business needs.
Share objective data and measurable outcomes to build confidence in your decision.
Encourage early adopters to share their experiences and listen to feedback from frontline users.
Performance reports increase transparency and help executives make better decisions. This leads to improved business outcomes and faster approval processes. When you secure buy-in, you set the stage for a smooth and successful implementation.
Selecting the best performance report system starts with a clear plan. You should follow these steps:
Set clear objectives and choose KPIs that match your strategy.
Real-time insights to optimize production, logistics, and decisions.
FAQ
What is a performance report system?
A performance report system helps you track, analyze, and present key business metrics. You use it to measure progress, spot trends, and make better decisions. It brings all your important data together in one place.
How do you choose the right KPIs for your reports?
Start by looking at your business goals. Pick KPIs that show progress toward those goals. Ask your team for input. Make sure each KPI is clear, measurable, and relevant to your strategy.
Why is integration important in reporting software?
Integration lets you connect your reporting system to other tools, like HR or finance software. This gives you a complete view of your business. You save time and reduce errors by pulling data from different sources automatically.
Can you customize reports for different teams?
Yes! Most modern systems let you create custom dashboards and reports. You can show each team only the data they need. This makes your reports more useful and keeps everyone focused on their goals.
What makes a reporting system user-friendly?
A user-friendly system has an easy interface, clear menus, and drag-and-drop features. You can build reports without coding. Training is simple. Your team can start using the system quickly.