A fleet management dashboard gives you a central place to view and control all your vehicles, drivers, and logistics in one screen, helping you make smarter decisions with real-time insights and data. You see the benefits when you use real-time data and centralized control. For example, you can respond quickly to changing conditions and plan routes better. The table below shows how these features improve operational efficiency:
Benefit
Impact on Operations
Real-time data
Faster decisions and reduced response times
Live vehicle and driver info
Better communication and team alignment
GPS tracking
Efficient routes and less wasted mileage
Predictive maintenance
Fewer breakdowns and longer vehicle life
FineReport lets you transform your fleet management dashboard with advanced tools and real-time insights. You gain control, improve communication, and keep your vehicles running smoothly.
What Is a Fleet Management Dashboard
Core Functions and Purpose
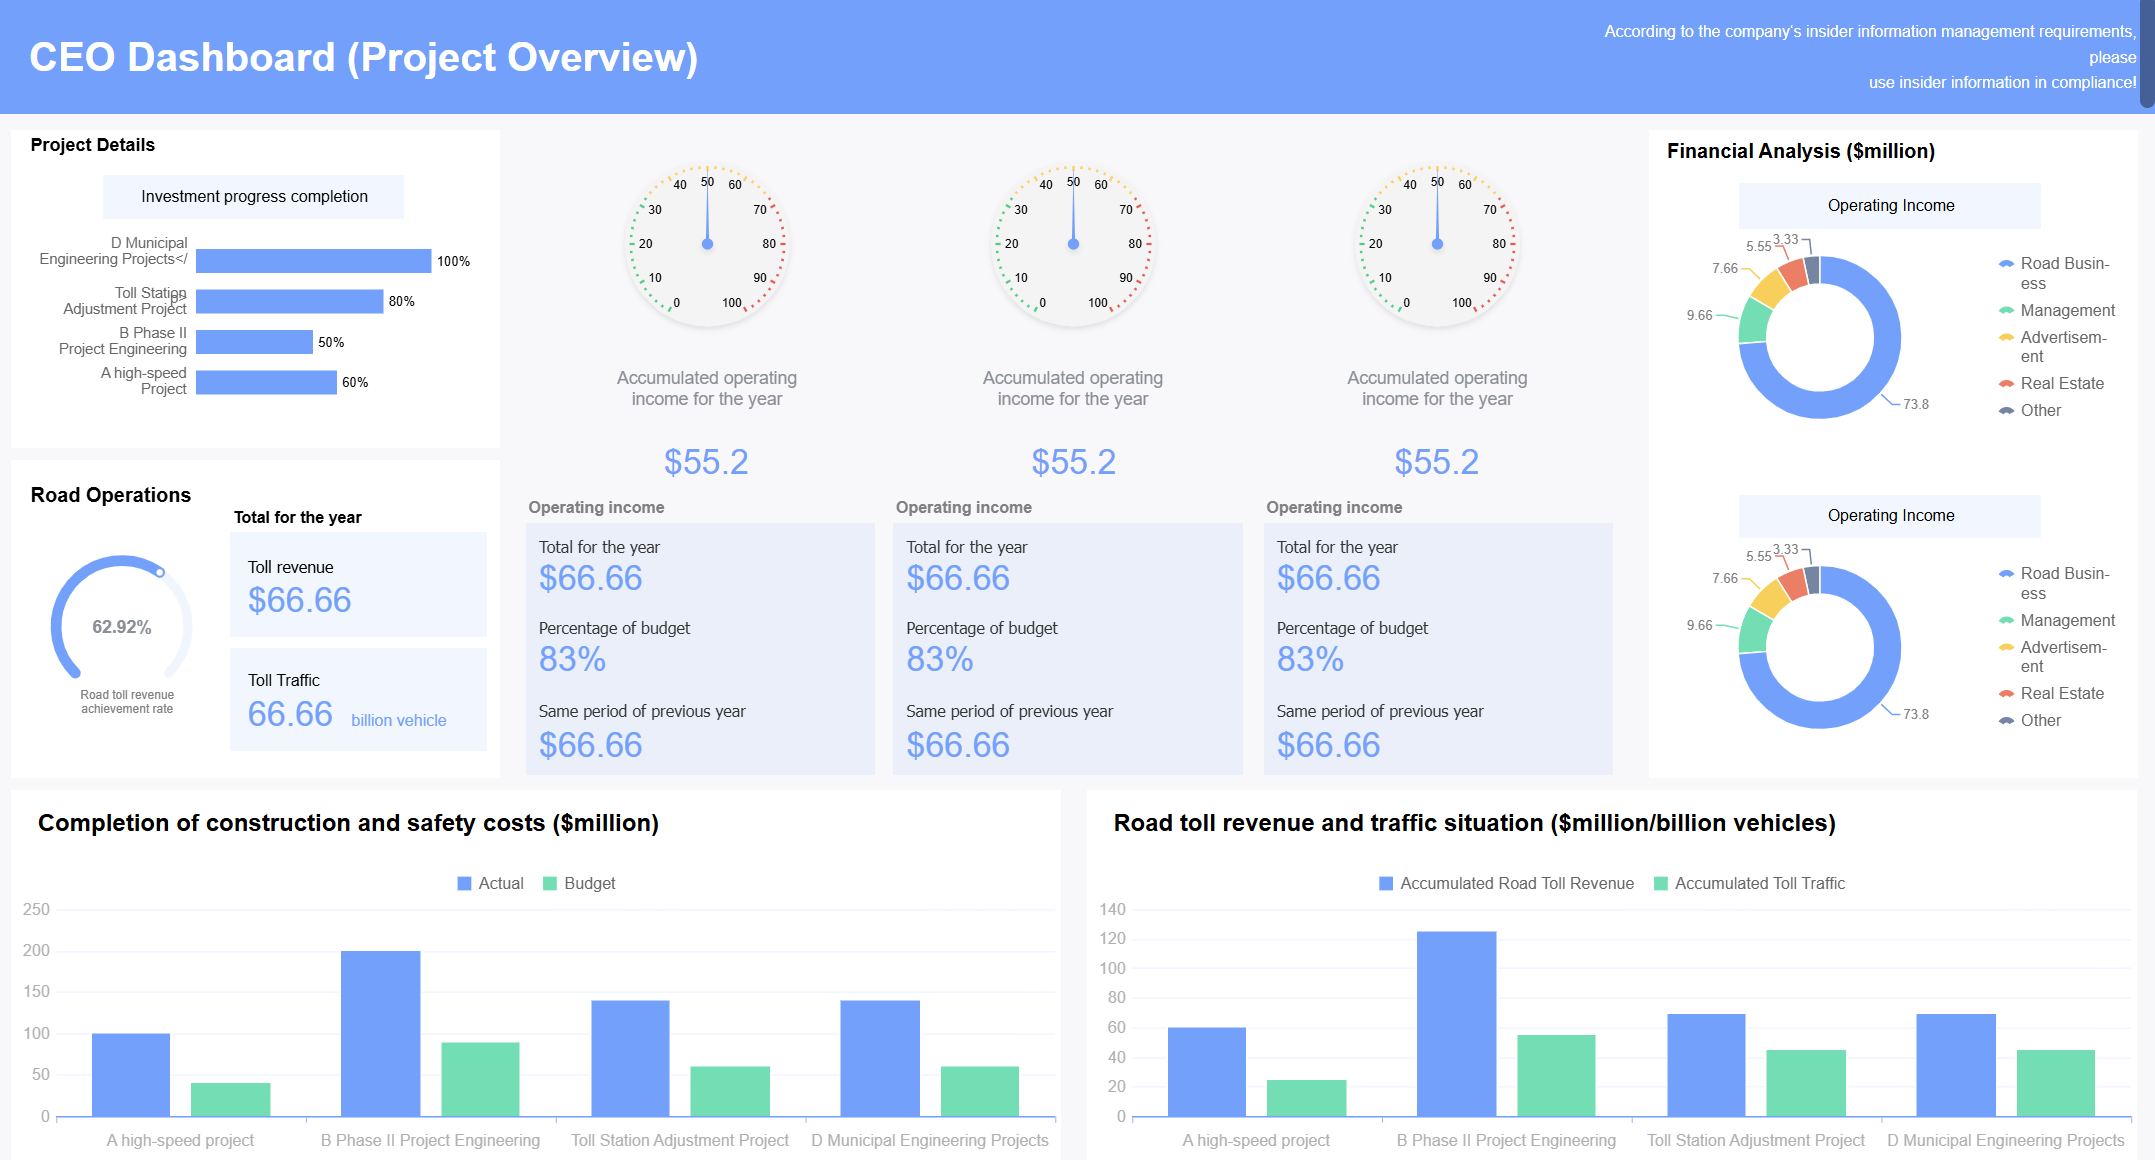
You use a fleet management dashboard to see everything about your vehicles and drivers in one place. This dashboard acts as your command center. It gives you real-time insights into vehicle operations, driver performance, and overall fleet efficiency. You can track GPS locations, fuel usage, maintenance schedules, and compliance metrics. The dashboard helps you monitor and optimize your fleet from a single interface.
Tip: A fleet management dashboard lets you compare historical and current performance data quickly. You spot trends and make better decisions.
Here is a table showing the main functions and objectives of a fleet management dashboard:
Function/Objective
Description
Improved Operational Efficiency
Streamlines workflows and offers actionable insights for smoother and cost-effective operations.
Enhanced Driver Safety
Provides alerts for risky driving behaviors and promotes accountability among drivers.
Streamlined Compliance and Reporting
Tracks regulatory requirements and automates record-keeping for faster audits and filings.
You rely on these features to keep your fleet running smoothly. The dashboard gives you full visibility into performance, expenses, live activity updates, and critical alerts.
Who Uses Fleet Management Dashboards
Many people in your organization benefit from a fleet management dashboard. You might be a fleet manager who needs to oversee daily operations. Operations managers use the dashboard to coordinate logistics and schedules. Drivers check their routes and receive updates. Maintenance teams monitor vehicle health and plan repairs. Finance and procurement teams analyze costs and manage budgets.
Fleet Managers
Operations Managers
Drivers
Maintenance Teams
Finance & Procurement Teams
Each role uses the dashboard for different reasons. You may want to improve efficiency, boost safety, or control costs. The dashboard supports all these goals by providing the right data at the right time.
How a Fleet Management Dashboard Works
Real-Time Data Integration
You rely on a fleet management dashboard to connect all your vehicles, drivers, and logistics into one centralized platform. FineReport makes this possible by integrating data from multiple sources, including GPS, sensors, and maintenance records. You see real-time updates on vehicle locations, driver activities, and fuel usage. This immediate access to data helps you make better decisions and respond quickly to changing conditions.
The shift from legacy systems to modern dashboards has transformed fleet operations. You no longer wait for delayed reports. Instead, you get real-time insights that let you optimize routes and improve efficiency. When you use technologies like AI, IoT, and cloud-based systems, you automate tasks and gather extensive data for analysis. FineReport’s advanced reporting capabilities give you customized visualizations and instant alerts.
Technology
Description
AI
Automates tasks and predicts maintenance issues.
IoT
Collects data from connected vehicles and smart sensors.
Cloud-based systems
Improves data access and scalability, reducing IT costs.
Advanced reporting
Delivers custom reports and real-time alerts for smarter decisions.
User Interface and Accessibility
A fleet management dashboard must present complex data in a simple, intuitive layout. FineReport’s dashboard design focuses on clarity, making it easy for you to find actionable insights. You see essential features like live maps and fleet health indicators. The mobile-first design lets you monitor operations from anywhere, giving you full control even when you are away from your desk.
Live maps and health indicators keep you informed.
Mobile-First Design
Monitor your fleet from any location.
Actionable Insights
Visual cues highlight urgent alerts and important events.
Automation and Alerts
Automation and alerts play a key role in proactive fleet management. FineReport enables you to set up automated notifications for compliance deadlines, vehicle inspections, and risky driving behaviors. You receive alerts based on severity, allowing you to prioritize high-risk items and intervene before problems escalate.
Automated alerts notify you about compliance issues, driver qualification deadlines, and inspection requirements.
You get notifications for hard braking events, HOS violations, and vehicle fault codes.
Proactive alerts help you address upcoming renewals and prevent unexpected compliance challenges.
Dashboards consolidate safety and compliance metrics, giving you a clear view of trends and helping you make informed decisions. With FineReport, you manage your fleet efficiently and reduce risks by acting on timely alerts.
A fleet management dashboard gives you powerful tools to manage your vehicles, drivers, and costs. FineReport stands out with customizable dashboards, mobile BI, and advanced visualization. You can integrate data from multiple sources and monitor key performance indicators in real time. Let’s explore the essential features you need to run your fleet efficiently.
Vehicle Tracking and Monitoring
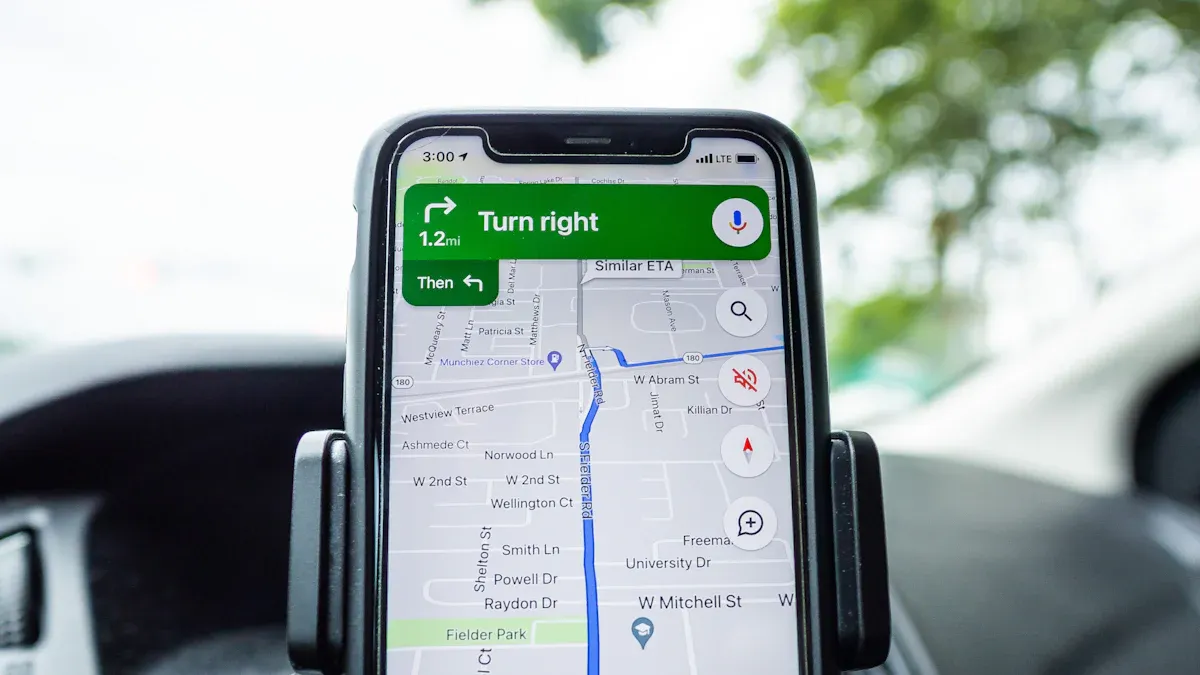
You need to know where your vehicles are at all times. The fleet management dashboard lets you track vehicles using GPS, showing location, speed, and route. This feature helps you assign jobs and reroute vehicles quickly. You see real-time visibility, which means you can respond to issues right away. The dashboard also monitors driver behavior and compliance, reducing risks and improving safety.
Displays vehicle location, speed, and route via GPS, aiding dispatchers in job assignments and rerouting.
Real-time Visibility
Provides immediate insights into vehicle locations, enabling quick responses to issues.
Driver Behavior Monitoring
Tracks risky driving patterns, enhancing safety and fuel efficiency.
Compliance Tracking
Ensures adherence to regulations, reducing the risk of legal penalties and operational disruptions.
Tip: Use the dashboard to track vehicles and optimize routes for better efficiency.
Maintenance and Alerts
Keeping your fleet in top condition is critical. The fleet management dashboard sends maintenance reminders and logs service history. You receive predictive maintenance alerts that catch early signs of wear. This proactive approach reduces downtime and lowers costs. In one case study, predictive maintenance led to a 45% reduction in downtime and a 30% decrease in maintenance costs for a fleet of 250 vehicles.
Telematics systems send instant alerts when issues arise, helping you minimize downtime.
Preventive maintenance strategies catch problems early, making repairs simpler and less expensive.
Early-warning systems help you avoid costly towing and missed jobs, improving fleet uptime.
Driver Performance Analytics
You want your drivers to be safe and efficient. The fleet management dashboard records driver performance, tracking behaviors like speeding, harsh braking, and idling. You use this data to coach drivers and improve safety. Analytics can predict potential accidents and help you intervene before incidents occur. Companies have seen a 55% reduction in accidents, 30% savings on insurance, and 40% better CSA scores by using driver performance analytics.
Metric
Value
Accident Reduction
55%
Insurance Savings
30%
Better CSA Scores
40%
Fuel Savings
25%
Leading indicators from telematics predict accidents.
Harsh driving events often lead to loss-of-control incidents.
Coaching based on dashboard data can reduce accident rates by up to 40%.
Data patterns help you spot risks and take action before problems happen.
Fuel and Cost Management
Managing fuel and expenses is a top priority. The fleet management dashboard helps you analyze fuel consumption and monitor spending. You can integrate fuel card data to detect unusual transactions and prevent theft. Fuel costs make up 28–38% of overall fleet expenses, so even small improvements mean big savings.
Fuel costs decreased by an average of 12% after using dashboard features.
NAFA reports that fuel theft can cost fleets up to 6% of total fuel expenses each year. Effective monitoring helps you prevent these losses.
Compliance and Safety Tools
You must meet regulatory requirements to avoid penalties and keep your fleet running. The fleet management dashboard provides real-time dashboards for compliance tracking. You monitor DOT, OSHA, and EPA standards easily. Proactive alerts warn you about upcoming deadlines and potential violations. This feature helps you achieve 100% regulatory compliance and reduces audit risk by 85%.
Feature
Benefit
Real-time dashboards
Achieve 100% regulatory compliance
Prevent violations
Reduce audit risk by 85%
Cost savings
Save $100,000+ annually in penalties
Comprehensive regulatory tracking
Monitor DOT, OSHA, and EPA requirements easily
Proactive alerts
Prevent compliance violations with early warnings
Audit readiness
Ensure documentation compliance for audits
Real-time visibility keeps you updated on compliance requirements.
Automated notifications and predictive analytics help you prevent violations.
Compliance dashboards make it easy to prepare for audits and avoid costly penalties.
Note: FineReport’s customizable dashboards and advanced visualization tools make it simple to monitor all these features in one place. You can access your dashboard on any device, giving you control wherever you are.
Types of Fleet Management Dashboards
Operational Dashboards
You use operational dashboards to monitor daily vehicle operations and respond quickly to changes. These dashboards show real-time data, which helps you stay proactive. Unlike dashboards that focus on long-term planning, operational dashboards give you instant updates on fleet location, driver status, and delivery progress. You can spot delays, reroute vehicles, and keep your team informed. This type of dashboard is essential for dispatchers and fleet managers who need to make fast decisions every day.
Tip: Operational dashboards help you avoid surprises by showing live data and alerts.
Maintenance Dashboards
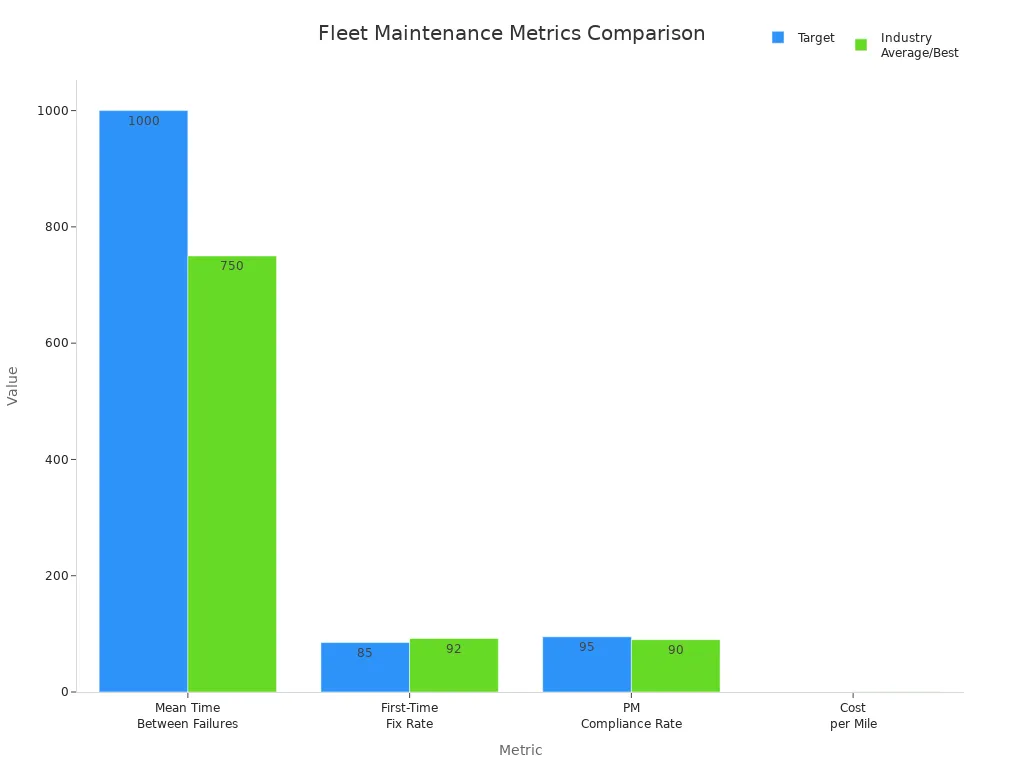
Maintenance dashboards track the health and performance of your fleet. You see important metrics like downtime, breakdown frequency, and maintenance completion rates. These dashboards help you schedule repairs, monitor costs, and keep vehicles on the road longer. You can compare your fleet’s performance to industry standards using key metrics:
Metric
Target
Industry Average/Current Best
Mean Time Between Failures (MTBF)
>1,000 hours
750 hours
First-Time Fix Rate
>85%
92%
PM Compliance Rate
>95%
90% (DOT requirement)
Cost per Mile
<$0.15
$0.22
You also track technician productivity, parts inventory turnover, and schedule compliance. These dashboards help you reduce costs and improve reliability.
Safety and Compliance Dashboards
Safety and compliance dashboards protect your business from legal risks. You get real-time visibility into compliance status and receive automated incident reports. These dashboards help you manage claims and reduce the chance of costly penalties. You can see the risks of non-compliance in the table below:
Potential Risks of Non-Compliance
Consequences
Fines per violation
Exceeding $20,000
Vehicle impoundments
Yes
License suspensions
Yes
Delayed insurance payouts
Yes
Denied insurance payouts
Yes
Safety and compliance dashboards ensure you follow regulations and keep your fleet safe. You minimize documentation gaps and manage risks before they become problems.
Financial Dashboards
Financial dashboards give you a clear view of your fleet’s costs and performance. You track total cost of ownership, cost per mile, and fuel efficiency. These dashboards help you set budgets, measure savings, and improve profitability. Here are the most common financial indicators you monitor:
Financial Indicator
Description
Total Cost of Ownership (TCO)
All costs for owning and operating your fleet.
Cost Per Mile (CPM)
Total costs divided by miles driven, including fuel, labor, and maintenance.
You use financial dashboards to spot trends, control expenses, and make better decisions for your fleet. These dashboards are a key part of vehicle management dashboards and help you achieve your business goals.
Benefits of a Fleet Management Dashboard
Efficiency and Productivity
You gain a major boost in fleet efficiency when you use a fleet management dashboard. Real-time insights into vehicle movements, driver behavior, and fuel consumption help you make quick decisions. You spot inefficient routes and aggressive driving, which lets you optimize routes and improve overall performance. Predictive maintenance alerts allow you to schedule repairs before problems occur. This proactive approach helps you reduce downtime and keep your vehicles on the road.
Predictive alerts prevent costly repairs and keep vehicles running.
Cost Savings and ROI
You see clear financial benefits after implementing a fleet management dashboard. Companies report strong returns on investment, with many users seeing positive results in less than a year. The dashboard helps you cut costs, increase uptime, and save fuel.
Driver
Average Impact (%)
Target Improvement
Cost Reduction
15%
25%
Uptime Gain
10%
20%
Fuel Savings
12%
18%
About one-third of GPS tracking users report positive ROI in under six months.
Nearly half of telematics users see ROI in less than a year.
You notice improvements in productivity, routing, and maintenance.
Safety and Compliance
You improve safety and compliance rates with a fleet management dashboard. The dashboard identifies risky behaviors like speeding or harsh braking, allowing you to intervene directly with drivers. Real-time monitoring increases accountability and encourages everyone to follow safety rules.
Aspect
Description
Enhanced Safety
Spotting risky driving lets you act quickly.
Increased Accountability
Monitoring in real time encourages rule-following.
Data-Driven Decisions
You make smarter choices using data from your fleet management dashboard. Interactive charts and graphs help you identify trends and cut inefficiencies. Detailed performance reports automate analysis, leading to higher operational efficiency. Access to consolidated real-time data lets you adjust operations immediately, which helps you reduce downtime and improve fleet efficiency.
Example
Benefit Description
Source
Interactive charts and graphs
Identify trends and reduce inefficiencies by up to 12%.
McKinsey & Company
Detailed fleet performance reporting
Automate analysis and boost operational efficiency by 15%.
Deloitte
Real-time data access
Make quick adjustments and reduce vehicle downtime by 20%.
Geotab
Tip: Use your dashboard to track performance and make informed decisions that drive your fleet forward.
Implementing a Fleet Management Dashboard
Dashboard Design Best Practices
You want your fleet management dashboard to deliver clear, actionable insights. Follow these best practices to get the most value:
Monitor compliance by combining data from different sources for easy review.
Track everything related to fuel to control costs and spot trends.
Take advantage of integrations to connect your dashboard with other business tools.
Tip: A well-designed dashboard helps you optimize routes and make faster decisions.
Integration with Existing Systems
When you integrate a fleet management dashboard with your current systems, you may face several challenges:
Inadequate planning and analysis can lead to mismatched integrations.
Poor data management may cause inconsistent results.
Resistance to change can slow down adoption.
Technology compatibility issues may create technical hurdles.
FineReport’s flexible data connectors and support services help you overcome these challenges. You can connect to multiple databases and file types, ensuring smooth data flow and reliable performance.
Training and Change Management
Effective training ensures your team uses the fleet management dashboard confidently. Consider these methods:
Training Method
Description
On-Demand Training
Access resources anytime and learn at your own pace.
Virtual Training
Monthly classes for different roles.
In-Person Workshops
Customized sessions at your location.
AI Fleet Bot
24/7 chat support for quick answers.
Tutorial Videos
Step-by-step guides for specific features.
Product Webinars
Interactive sessions with experts.
Custom 1:1 Training
Personalized help for unique needs.
Recurring Check-Ins
Annual reviews to ensure the dashboard meets your needs.
Note: Ongoing support and regular check-ins help you reduce downtime and keep your team engaged.
Choosing the Right Solution
Select a fleet management dashboard that fits your business goals. Look for these features:
Maintenance and compliance tools to prevent breakdowns.
Route optimization for cost efficiency.
Integration capabilities with your existing tools.
Reporting and analytics for informed decision-making.
You should also consider scalability, user experience, and vendor support. FineReport offers robust integration, intuitive dashboards, and expert training.
A real-world example comes from Kintetsu World Express. They used FineReport to connect multiple data sources and create real-time dashboards. This helped them manage customer information and logistics efficiently. Their teams saw improved decision-making and streamlined operations.
You gain more than just operational control with a fleet management dashboard. You see real-time performance, benchmark results, and focus on the KPIs that matter most. Automation reduces manual tasks, letting your team work on strategic goals. Industry leaders highlight the need for seamless integration, real-time maintenance, and a strong safety culture. FineReport empowers you to make data-driven decisions and scale your fleet for future growth. Evaluate your needs and choose a dashboard that supports your long-term success.
Access a wealth of case studies, industry insights, and solution guides to accelerate digital transformation.
FAQ
What is a fleet management dashboard?
A fleet management dashboard gives you a central place to view vehicle locations, driver performance, and costs. You use it to make quick decisions and improve efficiency.
Can I access my dashboard on mobile devices?
Yes! You can view and manage your fleet dashboard on smartphones and tablets. FineReport supports mobile BI, so you stay connected anywhere.
How does FineReport integrate with my existing systems?
FineReport connects to over 500 data sources, including databases and Excel files. You use built-in data connectors for seamless integration and real-time updates.
What types of reports can I create with FineReport?
You create pixel-perfect, dynamic reports and dashboards. FineReport supports row, cross, grouped, paged, and Word reports. You choose the format that fits your needs.