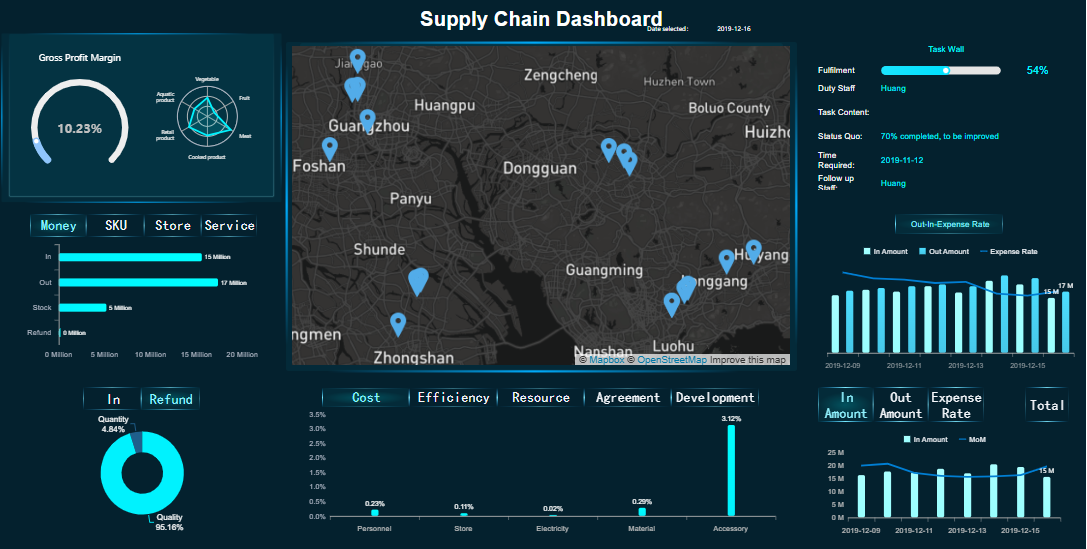
A supply chain metrics dashboard reveals the key metrics to track by providing a centralized view of performance data across manufacturing and e-commerce operations. This dashboard helps you monitor trends, respond to disruptions, and measure supply chain agility index for long-term resilience.
| Metric | Description |
|---|---|
| Response Time to Demand Changes | Measures how quickly you can respond to shifts in customer demand. |
| Production Flexibility Ratio | Assesses your ability to adjust production for varying requirements. |
| Supply Chain Recovery Time | Tracks how fast your supply chain recovers from unexpected disruptions. |
Real-time tracking allows you to address delays, improve inventory accuracy, and enhance supplier performance. Dashboards powered by predictive analytics and AI help you shift from reactive management to proactive decision-making, increasing visibility and control throughout your supply chain.
Essential Supply Chain Metrics

Operational Resilience Metrics
You need to track operational resilience metrics to build a supply chain that can withstand disruptions and adapt quickly. Supply chain metrics dashboards will focus on how well your processes respond to unexpected events. These metrics help you measure agility and ensure your business can recover from challenges like demand spikes, supplier delays, or logistics issues.
The most critical operational resilience metrics include delivery time, shipping estimate accuracy, and the ability to recover from disruptions. If your delivery time exceeds expectations, you may see conversion rates drop by up to 40%. Vague shipping estimates can increase cart abandonment by 28%. Delayed deliveries often lead to a 35% decline in repeat purchases, while shipping issues can raise customer acquisition costs due to negative reviews.
| Metric | Impact |
|---|---|
| Delivery time exceeding expectations | Conversion rates drop by 25-40% |
| Vague shipping estimates | Cart abandonment increases by 28% |
| Delayed delivery experience | Repeat purchase rates decline by 35% |
| Shipping issues | Customer acquisition costs rise due to negative reviews |
You should also monitor antifragility as a key metric. This measures how well your supply chain adapts under stress, focusing on flexibility and response capability. Companies that track antifragility and agility will lead supply chain trends.
Inventory Accuracy and Warehouse KPIs
Inventory accuracy and important warehouse KPIs are essential for maintaining efficient operations. High inventory accuracy ensures you have the right products available when needed, reducing stockouts and excess inventory. Inaccurate inventory records can lead to lost sales, increased costs, and poor customer satisfaction.
World-class supply chains achieve inventory accuracy rates between 97% and 99.9%. Typical benchmarks without advanced warehouse management systems range from 60% to 85%. You should aim for high accuracy to support better demand forecast and improve operational efficiency KPIs.
| KPI | World-Class Benchmark | Typical Benchmark |
|---|---|---|
| Inventory Accuracy (%) | 97–99.9% | 60–85% (no WMS or RF) |
| Perfect Order Rate (POR) | 95–98% | 88–94% (typical ecommerce) |
| Order Picking Accuracy | 98.5–99.8% | <98% (bleeding margin) |
| Damage Rate | <0.5–1.5% | 1–3% (fragile SKUs) |
| Perfect Shipment Rate | 95–98% (fragile) | 98–99.5% (apparel) |
| QA/QC Exceptions Rate | <1–2% (general) | <0.5% (high-compliance) |
| Wave Completion Time | 20–60 minutes | 60–180 minutes (high complexity) |
| Backorder Resolution Time | <1 hour | 1–24 hours (B2B/wholesale) |
| Inventory Turnover Ratio | 6–12 turns/year (D2C) | 3–6 (consumer electronics) |
You should also track warehouse metrics like perfect order rate, order picking accuracy, and inventory turnover ratio. These important warehouse KPIs help you measure how well your warehouse supports your supply chain. High accuracy in these metrics leads to better forecast accuracy and improved customer satisfaction.
You can use supply chain metrics dashboards to visualize inventory levels, monitor warehouse metrics, and track operational efficiency KPIs. This approach helps you identify trends, spot issues early, and make data-driven decisions.
Supplier Performance Metrics
Supplier performance metrics play a vital role in ensuring your supply chain remains reliable and cost-effective. You need to measure on-time delivery, order accuracy, lead time, and the quality of goods received. These metrics impact your ability to meet customer demand and maintain high forecast accuracy.
Top-performing companies use a range of supplier metrics to evaluate their partners:
| Metric | Description |
|---|---|
| On-Time Delivery | Measures how often suppliers meet their promised delivery dates, impacting production schedules. |
| Order Accuracy | Assesses whether received orders match the specifications and quantities requested. |
| Lead Time | The time taken from placing an order to receiving it, crucial for inventory management. |
| Quality of Goods | Evaluates the defect rate in supplied products, essential for maintaining product standards. |
| Cost Performance | Analyzes the cost-effectiveness of suppliers in relation to the quality of goods provided. |
| Communication and Responsiveness | Measures how effectively suppliers communicate and respond to inquiries and issues. |
| Flexibility and Adaptability | Assesses suppliers' ability to adapt to changing demands and circumstances. |
You should also consider metrics such as quality and reliability, risk and resilience, collaboration and partnership, capacity and scalability, and strategic alignment with ESG goals. These metrics help you build strong relationships with suppliers and ensure your supply chain can adapt to new challenges.
Supply chain metrics dashboards allow you to track these supplier metrics in real time. You can visualize trends, compare supplier performance, and identify areas for improvement. This approach supports better forecast accuracy and helps you respond quickly to changes in supply chain trends.
Integrating and Visualizing Metrics with FineReport
After you identify the most important supply chain metrics, you need a tool that can integrate and visualize them effectively. FineReport provides a powerful solution for manufacturing and e-commerce supply chains. You can connect data from multiple sources, track inventory accuracy, monitor warehouse metrics, and analyze supplier performance in one place.
FineReport enables you to visualize cost drivers, monitor inventory management metrics, and track order fulfillment metrics. You can improve demand forecast accuracy by analyzing historical sales data and customer satisfaction metrics. The platform supports real-time dashboards, making it easier to spot trends and act quickly.
The Danfoss customer story shows the real-world impact of using a supply chain metrics dashboard. Danfoss increased production performance by 40% in less than a year and reduced production stops by 20%. The company used FineReport to integrate data, visualize key metrics, and drive continuous improvement.
| Metric | Improvement |
|---|---|
| Production performance increase | 40% in less than a year |
| Production stops reduction | 20% fewer production stops |
You can achieve similar results by adopting a supply chain metrics dashboard that tracks forecast accuracy, inventory accuracy, and important warehouse KPIs. This approach will help you improve agility, reduce costs, and stay ahead of supply chain trends.

Fulfillment Speed and E-Commerce Metrics
On-Time In-Full (OTIF) Rate
You need to track the on time in full rate to measure how well your e-commerce supply chain delivers orders as promised. This metric shows the percentage of orders that arrive at the right time and in the correct quantity. High OTIF rates help you meet customer expectations and reduce complaints. E-commerce pressures make it essential to maintain strong performance in this area. The following table shows the typical OTIF rates for e-commerce supply chains:
| Performance Level | OTIF Rate Range |
|---|---|
| Standard Performance | 85-90% |
| Top-Performing Companies | 92-97% |
If you want to compete with top-performing companies, you should aim for an OTIF rate above 92%. This focus will also improve your perfect order rate, which measures the percentage of orders delivered without errors or delays.
Lead Time and Response Time
Lead time and response time are critical for e-commerce businesses. Lead time tracks how long it takes from receiving an order to delivering it to the customer. Response time measures how quickly you react to changes in demand or disruptions. Shorter lead times and faster response times help you stay ahead of competitors and keep customers satisfied. Monitoring these metrics allows you to identify bottlenecks and improve your supply chain’s agility.
Mobile dashboards and real-time reporting features can help you track these metrics efficiently. You can:
- Measure the consistency of partners in meeting delivery expectations and make proactive improvements.
- Consolidate logistics data into a single dashboard, which saves time and increases efficiency.
- Rely on automated updates to ensure your tracking information is always current and accurate.
- Reduce customer inquiries about order status by providing live tracking and predictive ETAs.
- Improve customer loyalty by offering better visibility and service.
E-Commerce Data Accuracy
Accurate data is the foundation of a reliable e-commerce supply chain. You need to ensure your dashboards display correct and timely information. To achieve high data accuracy, follow these best practices:
- Set up real-time alerts to address issues quickly and improve visibility.
- Avoid overloading dashboards; keep them focused on key metrics.
- Set benchmarks and goals to track progress and motivate your team.
- Identify and prioritize metrics that support your business goals.
- Use data visualization wisely to make information easy to interpret.
FineReport's mobile dashboard and real-time reporting features support these best practices. You can access your supply chain metrics on any device, receive instant alerts, and visualize key data points. This approach helps you maintain a high perfect order rate and meet the demands of modern e-commerce.
Cost, Risk, and Sustainability Metrics
You need to track cost, risk, and sustainability metrics to meet the demands of modern supply chains. The Supply Chain Metrics Dashboard Reveals the Key Metrics to Track, helping you manage inventory, forecast accuracy, and order fulfillment while meeting sustainability requirements.
Supply Chain Cost per Order
Managing supply chain cost per order is essential for maintaining profitability. You should monitor metrics that reveal the average cost per order, fulfillment fees, and shipping expenses. E-commerce businesses report an average supply chain cost per order of $8.50. The fulfillment fee for a single unit order is about $2.96. Shipping costs account for 88% of total fulfillment costs. Tracking these metrics allows you to optimize inventory levels, improve forecast accuracy, and reduce unnecessary expenses.
- Average supply chain cost per order: $8.50
- Fulfillment fee per single unit order: $2.96
- Shipping costs: 88% of total fulfillment costs
You can use these metrics to identify cost drivers and improve order processing efficiency.
Risk and Compliance KPIs
Risk and compliance KPIs are critical for global supply chains. The Supply Chain Metrics Dashboard Reveals the Key Metrics to Track, including compliance with new regulations and ethical sourcing. You should track metrics that measure ESG compliance, hazardous substance management, and labor practices. The following table highlights key risk and compliance KPIs:
| KPI Type | Description |
|---|---|
| ESG Metrics | Regulations require data on emissions, deforestation, and supplier traceability. |
| Chemical & Material Regulations | Compliance with hazardous substance rules needs continuous monitoring and BOM-level visibility. |
| Human Rights Compliance | Legislation demands due diligence on labor practices and ethical sourcing across supply chains. |
Monitoring these metrics ensures you meet regulatory standards and maintain high forecast accuracy.
Sustainability and ESG Metrics
Sustainability metrics are vital for meeting stakeholder expectations and regulatory requirements. The Supply Chain Metrics Dashboard Reveals the Key Metrics to Track, including energy consumption, carbon emissions, water usage, and waste management. You should track metrics such as labor practices, supply chain labor standards, community engagement, board diversity, anti-corruption policies, transparency, and executive compensation. Companies also assess supplier ESG performance to avoid negative impacts on their own sustainability standing.
- Energy consumption and carbon emissions
- Water usage and wastewater management
- Waste management and recycling initiatives
- Labor practices and employee well-being
- Supply chain labor standards
- Community engagement and philanthropy
- Board diversity and composition
- Anti-corruption and bribery policies
- Transparency and accountability
- Executive compensation
- Supplier ESG performance
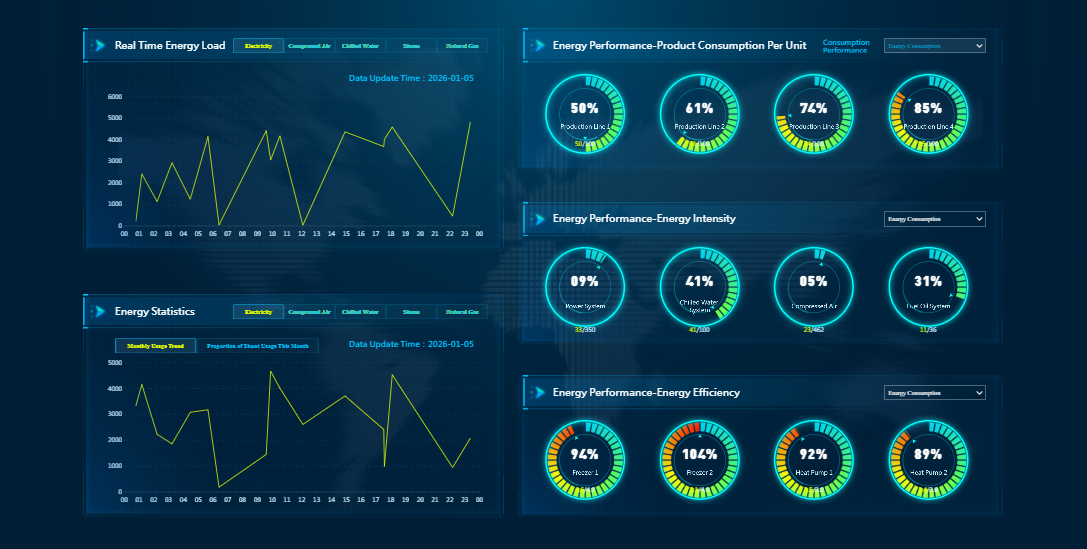
FineReport's decision-making platform and 3D dashboard capabilities support you in monitoring these metrics, ensuring compliance and driving continuous improvement in sustainability.
Building a Supply Chain Metrics Dashboard with FineReport
Data Integration and Real-Time Visualization
You need to bring together data from every part of your supply chain to build an effective supply chain metrics dashboard. Start by gathering information from customer interactions, product movement, and order fulfillment systems. Identify the key performance indicators that matter most for your business, such as order picking accuracy and order accuracy rate. Use SQL queries and visualization tools to uncover trends and patterns in your data.
A supply chain metrics dashboard with real-time visualization gives you several advantages:
| Benefit | Description |
|---|---|
| Enhanced Decision-Making | You get up-to-the-minute information for confident choices and proactive responses. |
| Improved Inventory Management | You see inventory levels clearly, which helps prevent stockouts or overstocking. |
| Reduced Costs | You spot demand changes and disruptions early, letting you optimize operations and cut waste. |
| Increased Customer Satisfaction | You provide accurate delivery estimates and timely updates, building trust and loyalty. |
You can connect data from ERP systems, logistics platforms, and other sources directly into your dashboard. This approach ensures your analytics stay current and actionable.
Customizing Dashboards for Manufacturing and E-Commerce
FineReport gives you the flexibility to tailor your supply chain metrics dashboard for manufacturing or e-commerce needs. You can integrate with custom-built software or third-party apps using APIs. Create templates in familiar formats like MS Word, and control the display of text, images, and tables. FineReport supports integration with software built in Java, Python, or other languages, and works with low-code platforms for rapid deployment.
| Customization Feature | Description |
|---|---|
| API Integration | Connect with custom or third-party applications for seamless data flow. |
| Template Creation | Build templates using MS Word or LibreOffice for consistent reporting. |
| Content Control | Add or remove content, perform calculations, and format data as needed. |
| Software Compatibility | Integrate with various programming environments and platforms. |
You can design kpi dashboards that highlight the metrics most relevant to your business, such as inventory turnover or supplier performance. This customization ensures you focus on what drives results.
Turning Insights into Action
A supply chain metrics dashboard only delivers value when you act on the insights it provides. FineReport’s dashboards centralize your data, giving you real-time visibility and streamlining decision-making. When you integrate live data sources, you eliminate the risks of outdated reports and empower your teams to respond quickly to emerging issues.
Manufacturing supply chain management solutions use dashboards to improve performance by providing real-time data integration, enhanced visibility, and better collaboration. You can identify bottlenecks, manage risks, and align teams toward common goals. For example, Danfoss used FineReport to unify data from multiple systems, leading to a measurable increase in operational efficiency and a reduction in customer complaints.
Tip: Regularly review your dashboard metrics and involve cross-functional teams to ensure continuous improvement. Track key metrics before and after implementation to measure ROI and optimize your supply chain strategy.

Tracking key supply chain metrics helps you boost operational efficiency, resilience, and sustainability. You can see real gains in time-to-detect, time-to-adjust, and rerouting efficiency, as shown below:
| Metric | Description |
|---|---|
| Time-to-detect | Speed of finding disruptions |
| Time-to-adjust | Speed of corrective actions |
| Rerouting efficiency | Effectiveness of alternative routes |
FineReport’s supply chain metrics dashboard supports your data-driven operations by integrating data from multiple systems and turning raw information into actionable insights. You gain end-to-end visibility and can make smarter decisions for continuous improvement. Digital solutions now offer real-time alerts, early issue detection, and improved cost control, making data-driven operations essential for your business success.

Continue Reading About Supply Chain Metrics Dashboard
Best Dashboard Apps for Business Insights
What is a Call Center Dashboard and Why Does It Matter
What is a Reporting Dashboard and How Does it Work
What is An Interactive Dashboard and How Does It Work
What is a Call Center Metrics Dashboard and How Does It Work


FAQ

The Author
Lewis
Senior Data Analyst at FanRuan
Related Articles

How to Build an Investment Portfolio Reporting Dashboard for Executives: KPIs, Benchmarks, and Drill-Down Views
Investment portfolio reporting for executives is not about showing every holding, transaction, and chart your investment team can produce. It is about giving CEOs, CFOs, CIOs, boards, and investment committees a fast, re
Yida YIn
Jun 25, 2026

12 KPI Reporting Examples for Executive Dashboards: What to Show in Weekly, Monthly, and Quarterly Reviews
Executive leaders do not need more data. They need decision ready $1 examples that match how often they review the business and what actions they are expected to take. A weekly $1 should surface fast moving risks and per
Yida YIn
Jun 25, 2026

How to Build a Digital Marketing Reports Dashboard: Executive Examples, KPIs, and Templates
A $1 is the control layer that helps executives and marketing leaders turn scattered channel data into fast, confident decisions. If you are a CEO, CMO, operations director, or marketing analytics lead, the real problem
Yida Yin
May 07, 2026