A business report is not just a document—it is a decision tool. For operations managers, analysts, finance leaders, and department heads, the real challenge is rarely writing itself. The hard part is turning scattered data, conflicting inputs, and stakeholder expectations into a report that is clear, credible, and useful. A strong business report helps teams align faster, justify decisions, reduce misunderstandings, and move from raw information to action.
What Is a Business Report and When Should You Use One?
A business report is a structured document that presents facts, analysis, and sometimes recommendations about a business topic. Its job is simple: help readers understand a situation and make a better decision. That situation may involve sales performance, project delivery, market opportunities, financial results, operational risks, or compliance issues.
For most organizations, business reports matter because decisions fail when information is unclear. Leaders do not want ten pages of disconnected data. They want a report that answers: What happened? Why did it happen? What should we do next?
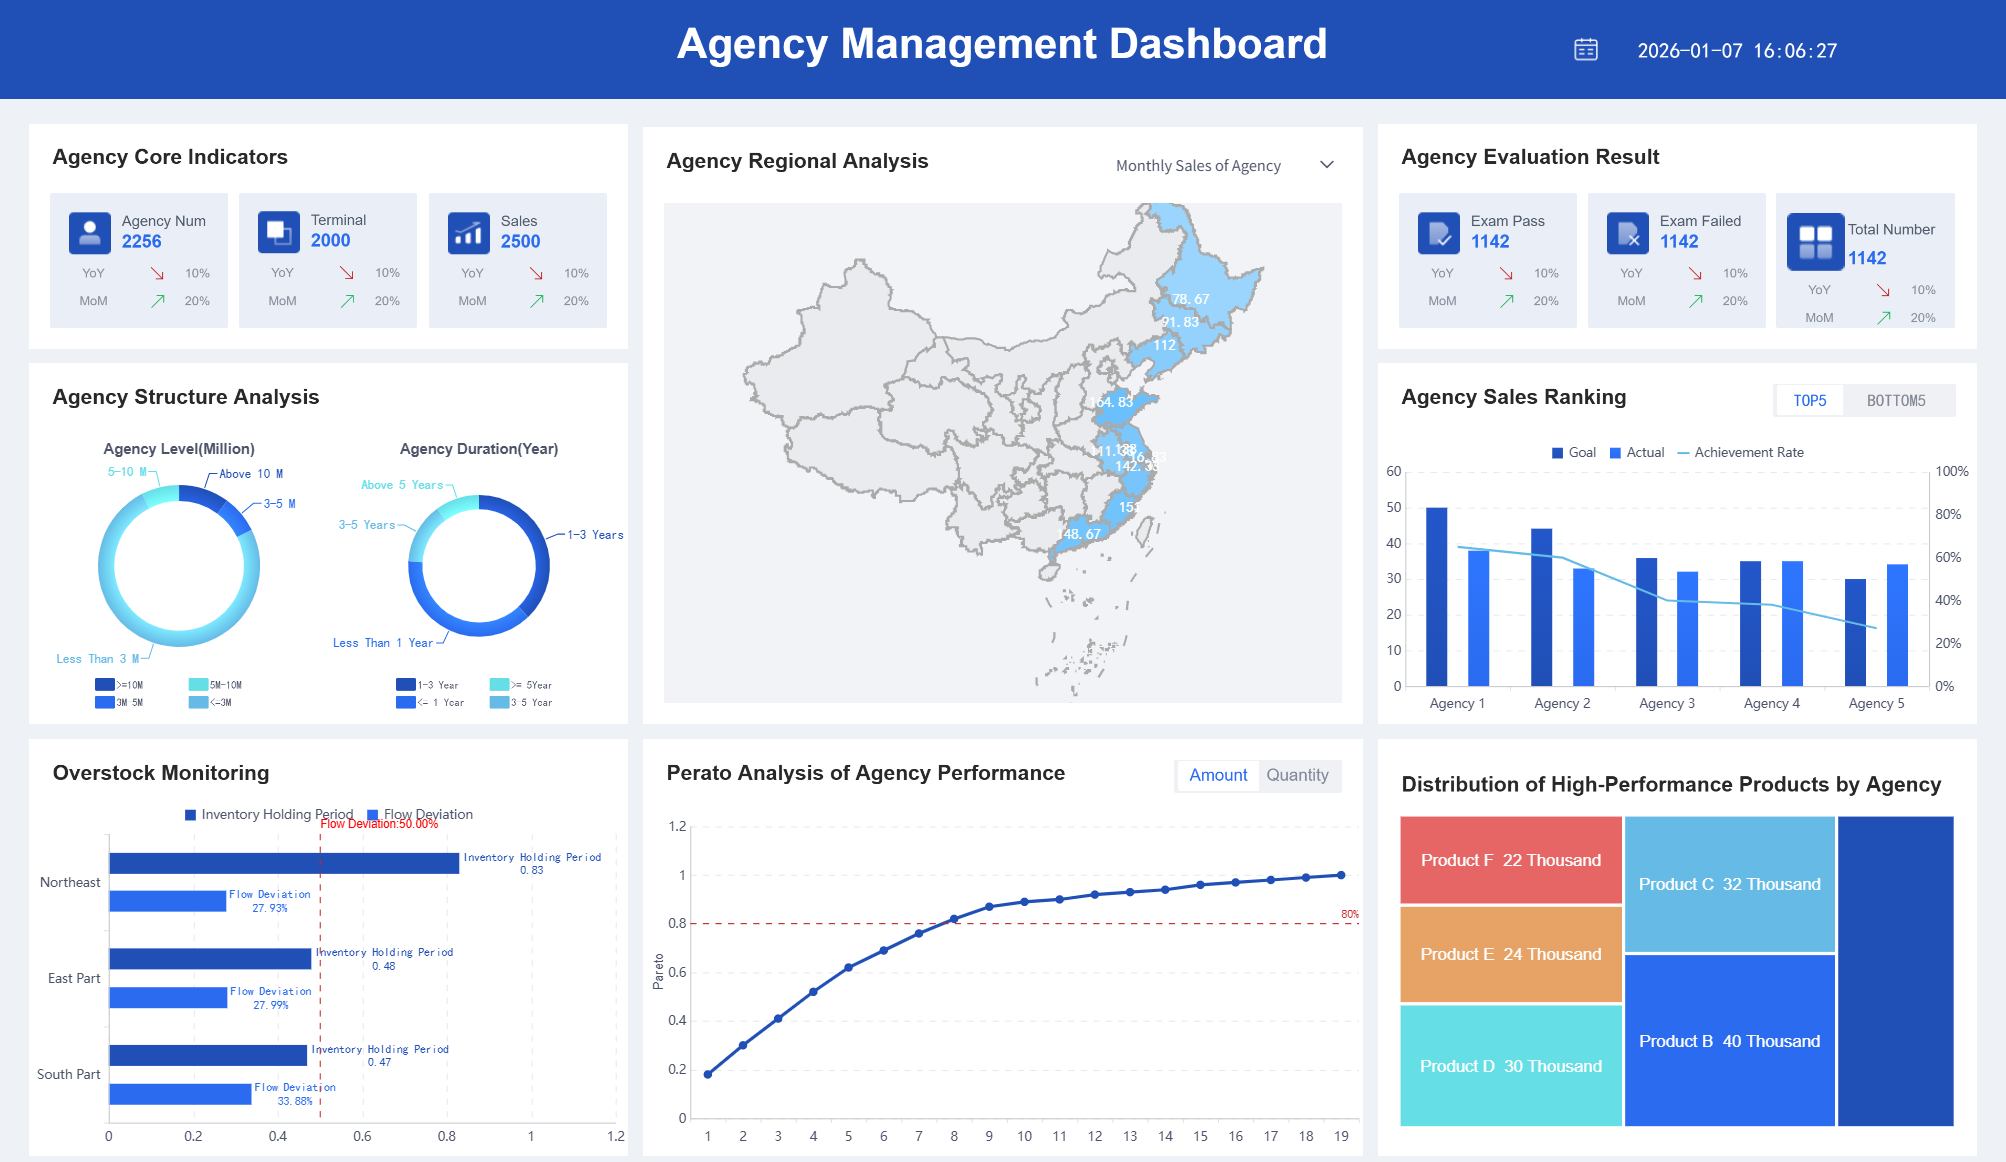
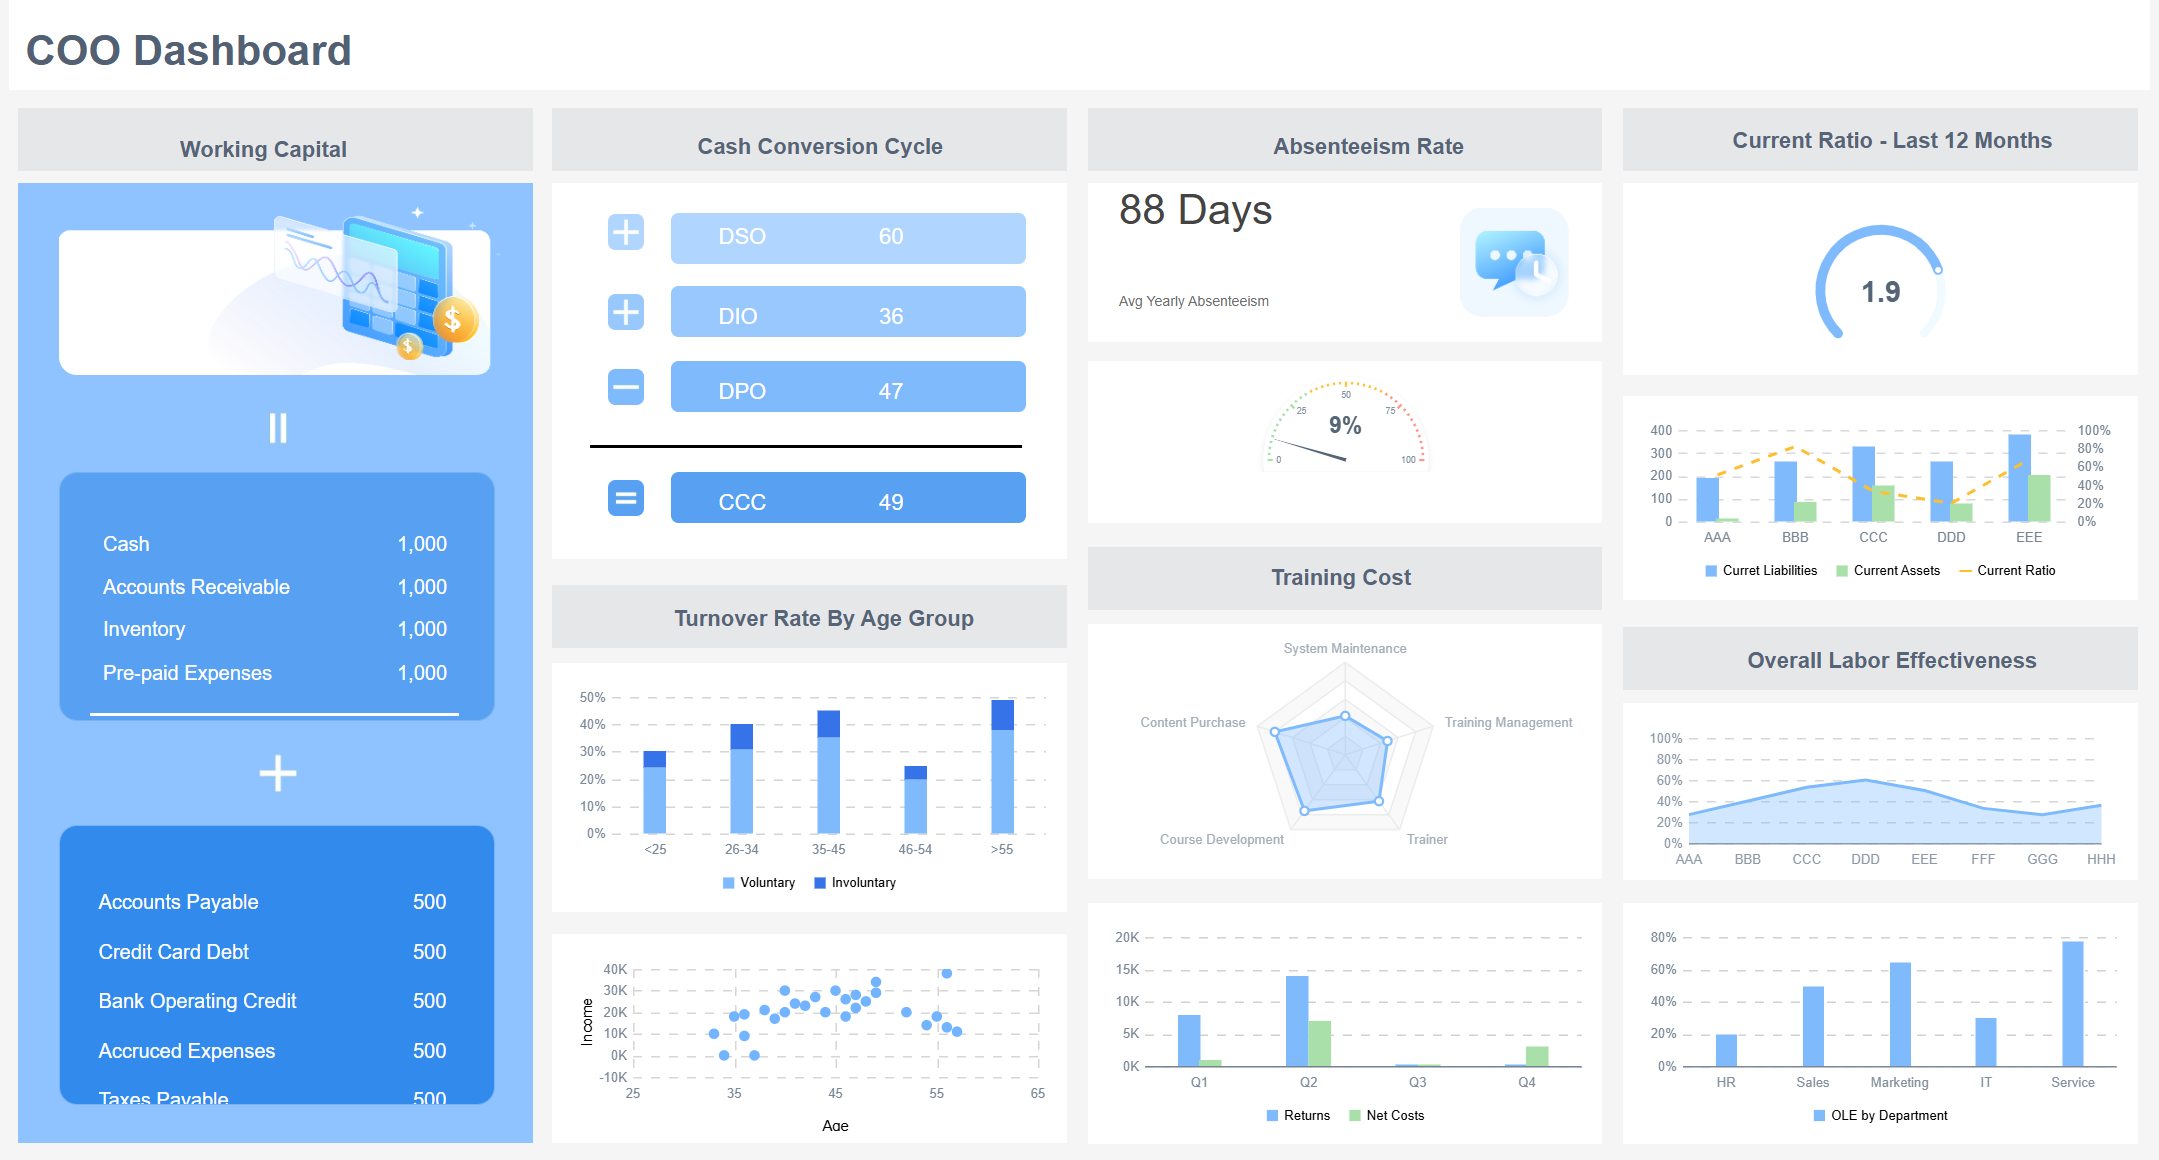
All reports in this article are built with FineReport
Informational, Analytical, and Recommendation-Based Reports
Not every business report serves the same purpose. Choosing the right type early prevents confusion later.
Informational reports
These focus on facts and status updates. They explain what happened without deep interpretation.
Examples include:
Monthly sales updates
Inventory summaries
Project status reports
Attendance or productivity reports
Analytical reports
These go beyond facts and interpret the data. They explain patterns, causes, and implications.
Examples include:
Market trend analysis
Budget variance analysis
Customer churn analysis
Root-cause reports for operational issues
Recommendation-based reports
These combine findings with proposed actions. They are used when management needs a decision, not just information.
Examples include:
Vendor selection reports
Expansion feasibility reports
Process improvement proposals
Investment evaluation reports
Common Use Cases for a Business Report
A business report can support almost any recurring or strategic business process. The most common scenarios include:
Performance updates: Track sales, operations, customer service, or departmental goals
Market analysis: Evaluate competitors, demand shifts, pricing, and customer behavior
Project status reporting: Monitor milestones, risks, budget, and next steps
Financial reviews: Summarize revenue, costs, profit, cash flow, and forecasts
Incident and compliance reporting: Document issues, causes, corrective actions, and audit trails
Key Metrics (KPIs) for an Effective Business Report
A useful business report should not overload readers with numbers. It should focus on the metrics that directly support the report objective.
Objective alignment: Measures whether the report answers its core business question
Data accuracy: Confirms figures are validated and trustworthy
Timeliness: Shows whether the information reflects the right reporting period
Variance: Compares actual performance against targets, plans, or prior periods
Trend direction: Highlights whether results are improving, declining, or stable
Risk exposure: Identifies issues that may affect outcomes or decisions
Actionability: Indicates whether findings can drive a clear next step
Audience relevance: Ensures detail level fits executives, managers, clients, or internal teams
How to Write a Business Report Step by Step
Writing a business report becomes much easier when you follow a repeatable framework. The goal is to move logically from purpose to evidence to conclusion.
Start with the purpose, audience, and scope
Before drafting anything, define what the report must accomplish. This sounds basic, but it is where many weak reports fail.
Ask three questions first:
What main question should this report answer?
Who is going to read it?
What should be included—and excluded?
If the report is for senior executives, they usually want high-level insights, major risks, and recommended actions. If it is for analysts or department managers, they may need more methodology, supporting data, and operational detail.
A well-defined scope also prevents unnecessary expansion. Specify:
Write the report objective in one sentence before you begin. If you cannot explain the purpose clearly in one line, the report will likely become unfocused.
Gather, verify, and organize your information
Once the purpose is set, collect the information needed to support it. This may include internal dashboards, spreadsheets, financial systems, CRM exports, survey results, interviews, or industry data.
The rule here is simple: unverified data destroys trust. Even a well-designed business report loses authority if totals do not match, assumptions are unclear, or charts contradict the narrative.
Step-by-step approach
Collect from reliable sources
Pull data from official systems, approved files, and credible research inputs.
Verify accuracy
Check totals, formulas, date ranges, labels, and assumptions.
Standardize definitions
Make sure terms like revenue, active customer, backlog, or incident rate mean the same thing throughout the report.
Group findings into themes
Organize information by topic such as financial performance, customer behavior, operational efficiency, or project health.
Match each finding to the report objective
If a data point does not help answer the main question, remove it.
Core Elements to prepare before drafting
Business question: The problem or decision the report addresses
Audience profile: Executive, managerial, operational, client-facing, or regulatory
Data sources: Systems, surveys, interviews, or market research inputs
Time frame: Monthly, quarterly, annual, or project-specific period
Key comparisons: Budget vs actual, target vs performance, current vs prior period
Decision criteria: Costs, benefits, risks, ROI, compliance, or urgency
Draft the key sections in a logical order
Good business reports are easy to scan. Readers should understand the core message quickly, then move into supporting detail only if needed.
A practical drafting sequence is:
Executive summary
Introduction
Methodology or background
Findings
Analysis
Conclusions
Recommendations
Appendices
This order works because it reflects how decision-makers consume information. They want the takeaway first, then the evidence behind it.
Writing principles that improve report quality
Lead with the most important insight
Use headings that describe the content clearly
Break dense text into short paragraphs
Use tables and charts where numbers are complex
Keep language professional and neutral
Separate facts from interpretation
For example, “sales declined 8% in Q2” is a finding. “Sales declined because the enterprise pipeline stalled in two regions” is analysis. Keep those distinct.
Review, edit, and format for clarity
The first draft is rarely the final draft. Strong reports are edited for precision, consistency, and readability.
During review, look for these common issues:
Repeated points across multiple sections
Vague language such as “good,” “bad,” or “significant” without evidence
Unsupported claims
Inconsistent labels or terminology
Tables and visuals without explanation
Conclusions that do not match the findings
Final review checklist
Clarity: Can a busy reader understand the message in minutes?
Consistency: Do numbers, labels, and terms match across sections?
Logic: Does the analysis clearly support the conclusion?
Formatting: Are headings, charts, spacing, and tables easy to scan?
Actionability: Is the next step obvious?
Business Report Format and Essential Sections
A standard business report format improves credibility because readers know where to find what matters. It also makes recurring reporting much easier across teams.
Title page, executive summary, and table of contents
These opening sections shape the first impression.
Title page
The title page should include:
Report title
Author or team name
Department or company
Reporting period
Submission date
It should be clean and professional, not overloaded with design.
Executive summary
This is the most important section for many readers. It should briefly cover:
For longer reports, this helps readers jump directly to relevant sections. Executives may skip to recommendations. Analysts may go straight to methodology or appendices.
Introduction, methodology, findings, and analysis
These sections form the main body of the report.
Introduction
Use the introduction to establish context. Explain:
Why the report was created
What business issue it addresses
What the report covers
Any key background information
Methodology
This section explains how the information was collected and assessed. Include:
This matters because readers judge report quality by process as much as output.
Findings
This section presents the facts. Use charts, tables, summaries, and clear labels. Focus on what the data shows, not yet what it means.
Analysis
This is where interpretation happens. Explain:
Why trends occurred
What changed from prior periods
Which drivers matter most
What risks or opportunities are emerging
A common mistake is blending findings and analysis into one vague narrative. Keep them connected, but distinct.
Conclusions, recommendations, and appendices
The final sections should close the loop between evidence and action.
Conclusions
Summarize the most important takeaways without repeating every detail. This should answer the report’s original question directly.
Recommendations
If the report requires action, convert findings into practical next steps. Strong recommendations are:
Specific
Feasible
Prioritized
Supported by evidence
Instead of saying “improve sales performance,” say “reallocate enterprise sales coverage to the two underperforming regions and review pipeline quality weekly for the next quarter.”
Appendices
Use appendices for supporting material that would clutter the main report, such as:
Detailed tables
Raw data extracts
Survey instruments
Supporting calculations
Supplementary documentation
Tips to Make Your Business Report Clear, Professional, and Persuasive
A technically correct report can still fail if it is hard to read or difficult to act on. Professional reporting is as much about structure and usability as content.
Write for readability and action
Most stakeholders scan before they read deeply. Make the report easy to navigate.
Best practices
Use short paragraphs
Write clear, descriptive headings
Prefer plain business language over jargon
Highlight decisions, risks, and implications
Use charts to simplify complex comparisons
Add brief commentary below visuals so readers know what matters
4 practical implementation best practices
Build the report around one decision or objective
Do not let it become a data dump. Every section should support the main business question.
Use a reporting hierarchy
Start with a summary, then allow readers to move into supporting detail. This works especially well for executive audiences.
Standardize visuals and terminology across teams
Consistent labels, KPI definitions, and chart formats reduce confusion and improve trust.
Automate recurring sections where possible
Monthly, quarterly, and operational reports should not be rebuilt manually each time.
Some reporting problems are small but damaging. They reduce confidence even if the analysis is correct.
Common mistakes to watch for
Weak structure with no clear narrative
Too much background and too little insight
Recommendations that are broad or generic
Inconsistent figures between tables and text
Visuals with no takeaway explained
Formatting that looks rushed or unprofessional
Overuse of jargon for non-technical audiences
If a report forces readers to figure out the message themselves, it has failed its job.
Adapt the report to the situation
The best business report is not the longest one. It is the one best suited to the audience and use case.
Adjust based on audience
Executives: Focus on summary, risk, forecast, and decisions
Managers: Include operational drivers, variances, and next steps
Clients: Emphasize outcomes, service levels, and strategic value
Regulators or auditors: Prioritize traceability, precision, and documentation
Internal teams: Add workflow detail and supporting context where needed
Adjust based on purpose
Formal reports: More structured, complete, and polished
Routine reports: More standardized and concise
Strategic reports: More analytical, scenario-based, and recommendation-heavy
Real Business Report Examples and Useful Templates
Templates and examples accelerate reporting maturity. They reduce inconsistency, save time, and help teams focus on analysis instead of document assembly.
Example structures for common report types
Different report types share a core structure, but the emphasis changes.
Annual report
Typical sections:
Cover page
Executive summary
Year-in-review highlights
Financial performance
Strategic initiatives
Risks and outlook
Appendices
Sales report
Typical sections:
Sales summary
Revenue by region or segment
Pipeline status
Target vs actual
Trend analysis
Action recommendations
Project report
Typical sections:
Project overview
Status summary
Milestones achieved
Budget and resource update
Risks and blockers
Next steps
Incident report
Typical sections:
Incident summary
Date, time, and impact
Root cause
Corrective action
Preventive recommendations
Supporting evidence
Where templates can help
Templates are useful when teams need consistency, speed, and repeatability. They work especially well for:
Monthly operating reviews
Department performance reports
Weekly project updates
Compliance and audit reporting
Executive scorecards
But templates should not force generic thinking. Use them as a structure, then customize sections, metrics, and commentary based on the business question.
Risk exposure or compliance requirements are unusually high
How to learn from strong business news and reporting models
One of the best ways to improve your own reporting is to study well-structured business communication. Strong reporting models usually do three things well:
They summarize the key message early
They support claims with evidence
They make complex information easy to follow
Look at how effective reporting presents charts, headlines, summaries, and supporting context. Good business reports do the same thing internally: they lead with meaning, not clutter.
Build Better Business Reports Faster with FineReport
At scale, writing a business report manually is harder than most teams expect. Data sits in different systems. KPI definitions vary across departments. Formatting takes too long. Recurring reports become repetitive, error-prone, and difficult to standardize.
That is where FineReport becomes the practical solution.
Building this manually is complex; use FineReport to utilize ready-made templates and automate this entire workflow.
Clean formatting for executive and operational audiences
Instead of spending hours copying data into slides or spreadsheets, teams can focus on the insight itself. That means faster reporting cycles, stronger data trust, and better decision support.
For enterprises, this is more than convenience. It is a reporting operating model: standardized, scalable, and easier to govern.
Most business reports follow a clear format: title, executive summary, introduction, main findings, analysis, conclusion, and sometimes recommendations or appendices. The exact sections can vary based on whether the report is informational, analytical, or recommendation-based.
Start by defining the report's purpose, audience, and scope in one sentence. This helps you decide what data to include, what level of detail to use, and what question the report should answer.
A business report should be only as long as needed to support a decision clearly. Short reports may work for routine updates, while analytical or executive reports may need more detail, but every section should stay focused and relevant.
An effective business report is clear, accurate, well-organized, and tied to a specific business objective. It should highlight the most relevant findings, explain what they mean, and make the next step easy for the reader to understand.
Yes, if visuals help readers understand trends, comparisons, or risks faster than text alone. Tools like FineReport can make business reports more useful by turning raw data into decision-ready charts and dashboards.
Product Trial
FineReport
Pixel-perfect reports · Interactive dashboards · Easy data entry · Digital twins