An HR metrics dashboard gives you a clear view of your HR data, helping you track workforce trends and performance. You can quickly compare information from multiple sources, spot issues like rising turnover, and respond before problems grow. HR dashboards provide interactive visualizations that make data easy to interpret, allowing you to make smarter decisions and influence stakeholders. FineBI stands out as a leading solution for building effective HR dashboards. When you use dashboards, you shift HR from reacting to problems to proactively shaping your organization’s future.
HR Metrics Dashboard Features

A modern HR metrics dashboard gives you powerful tools to manage your workforce data. You can track key HR metrics, visualize trends, and make informed decisions quickly. The dashboard brings together data from different sources, updates information in real time, and lets you explore analytics without technical barriers. These features help you understand your HR landscape and respond to changes with confidence.
Centralized Data Integration in HR Metrics Dashboard
Centralized data integration is the foundation of an effective HR metrics dashboard. You can connect information from payroll, recruitment, performance management, and other HR systems. This integration creates a unified view of your workforce, making it easier to spot patterns and address challenges.
Tip: Centralized systems reduce manual errors and streamline HR processes. You get real-time access to accurate data, which improves reporting and saves time.
Here are some benefits of centralized data integration:
- You see a complete picture of your workforce, not just isolated data points.
- You can spot trends and address issues before they grow.
- You simplify HR tasks like onboarding and training management.
- You ensure consistent access to HR tools and support for all employees.
| Benefit | Description |
|---|---|
| Real-time access | Immediate updates across all integrated systems for accurate reporting. |
| Reduction of manual errors | Fewer mistakes compared to manual data entry. |
| Streamlined processes | Easier payroll and employee management, boosting efficiency. |
Real-Time Visualization in HR Metrics Dashboard
Real-time visualization is a key feature of any HR metrics dashboard. You can see up-to-the-minute data on employee engagement, turnover, and other HR metrics. This helps you react quickly to changes and make better decisions.
- You detect drops in engagement early and prevent bigger problems.
- You identify high-potential employees before competitors do.
- You recognize coaching opportunities for managers as they happen.
Real-time dashboards serve as a command center for HR leaders. You can monitor spikes in attrition risk or shifts in engagement at a glance. Data visualization speeds up decision-making by five to seven times, so you act with confidence.
- Real-time data displays give you instant insights for quick operational decisions.
- You monitor ongoing processes and catch issues before they escalate.
- A unified view of data helps your team collaborate and make better choices.
Self-Service Analytics with FineBI in HR Metrics Dashboard
Self-service analytics is essential for HR professionals who want to explore data independently. FineBI empowers you to build and customize HR dashboards without coding. You can drag and drop metrics, apply filters, and create visualizations that fit your needs.
| Feature/Benefit | Description |
|---|---|
| Accessibility | FineBI works for all users, even those without coding experience. |
| Efficiency | You analyze data at least 50% faster than with traditional methods. |
| Real-time Feedback | You get immediate feedback and validation on your data processing. |
| Business Context | You define the business context in one step, making analysis more relevant. |
FineBI connects to over 60 data sources, including databases, cloud platforms, and APIs. You can schedule updates, clean data, and publish dashboards securely. The platform supports mobile-friendly interfaces, automated reporting, and strong security controls. You track HR KPIs and metrics, visualize trends, and share insights across your organization.
Note: With FineBI, you reduce your reliance on IT and gain the freedom to explore HR metrics on your own. You make faster, data-driven decisions that improve HR outcomes.
| Feature | Description |
|---|---|
| Mobile-friendly interface | Responsive design for access on mobile devices. |
| Automated reporting | Streamlines report generation and distribution. |
| Data visualization | Engaging charts and graphs for quick understanding. |
| Real-time data updates | Up-to-the-minute information for swift action. |
| Security and access controls | High data protection and restricted access. |
| Integration capabilities | Connects with various HR systems for a unified view. |
| Key performance indicators | Tracks and displays HR KPIs to measure performance. |
You interact with dynamic dashboards, automate reporting, and visualize HR metrics in ways that drive better decision-making. FineBI makes analytics accessible, efficient, and secure for every HR professional.
Key HR Metrics Dashboard to Track
Tracking the right metrics on your HR metrics dashboard helps you make better decisions and improve your workforce. You can use your HR dashboard to monitor trends, spot problems early, and support your organization’s goals. Here are the most important HR metrics to include:
Employee Turnover
Employee turnover rate is one of the most critical metrics for any HR team. You need to know how many employees leave your company over a set period. High turnover can signal problems with engagement, recruiting, or company culture. Your HR metrics dashboard lets you track turnover by department, location, or demographic group. You can use analytics to identify patterns and predict which employees might leave next. Many organizations use flight risk models, natural language processing, and predictive analytics to understand why people leave and to build better retention strategies.
| Method | Description |
|---|---|
| Flight Risk Model | Uses engagement metrics to score risk of turnover. |
| NLP on Feedback | Analyzes employee feedback for turnover reasons. |
| Predictive Analytics | Flags at-risk employees for early intervention. |
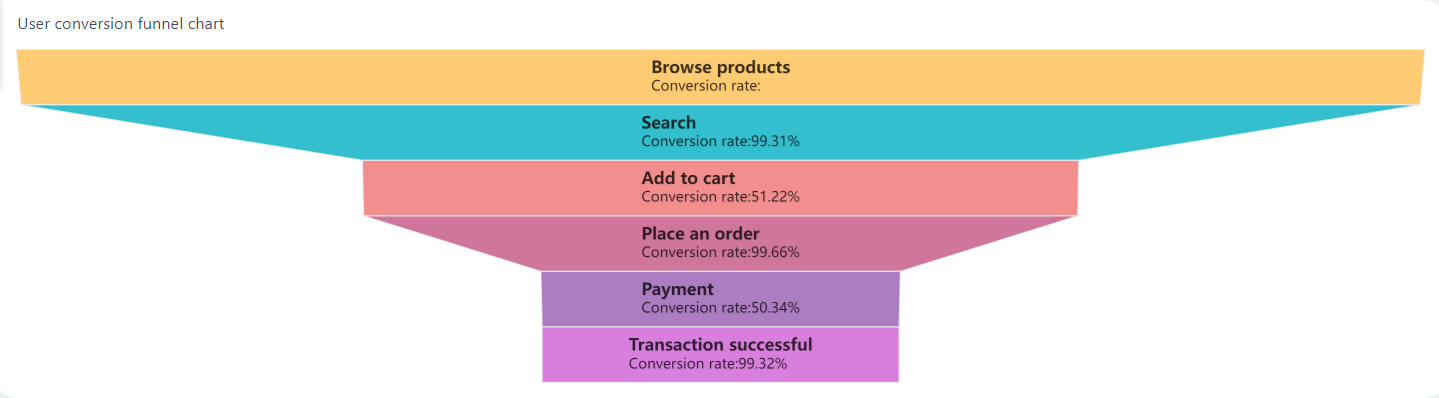
Time to Hire
Time to hire measures how long it takes to fill open positions. This metric shows how efficient your recruiting process is. Most industries report an average time to hire between 20 and 30 days, with 24 days being common from screening to offer acceptance. Your HR dashboard displays this KPI as a key indicator and visualizes the hiring funnel. You can see where delays happen and improve your recruiting strategy.
- Average time to hire: 24 days
- Visualized as a KPI and funnel on your dashboard
- Helps you optimize recruiting steps
Engagement Scores
Employee engagement score is a powerful metric for HR. High engagement leads to better productivity, higher profitability, and less absenteeism. Companies with strong engagement see 23% higher productivity and 18% more profit. Your HR metrics dashboard tracks engagement through surveys and feedback. You can compare engagement scores across teams and over time. FineBI helps you visualize these scores and link them to business outcomes.
- High engagement = 23% more productivity
- 18% higher profitability
- 81% less absenteeism
Absenteeism
Absenteeism metrics show how often employees miss work. You need to track absence rates, trends, and reasons for missing work. Your HR dashboard breaks down absenteeism by department, location, and time period. You can spot patterns, such as seasonal spikes or frequent absences in certain teams. FineBI lets you analyze these trends and take action to reduce unplanned absences.
| Key Metrics | Description |
|---|---|
| Absence rates | Frequency and duration of absences |
| Absenteeism trends | Patterns by department, location, or time |
| Sick leave and PTO | Usage of sick leave and paid time off |
| Unscheduled absences | Impact on productivity |
Diversity Metrics
Diversity metrics help you measure progress toward inclusion goals. You can track hiring, retention, and promotion rates by gender, age, and ethnicity. Your HR metrics dashboard highlights gaps and shows where you need to focus. Tracking these metrics assures transparency and supports your DEI strategy. Organizations with strong diversity practices often see better business results.
- Track progress toward DEI goals
- Identify gaps and inequities
- Improve business outcomes
FineBI makes it easy to visualize and analyze all these HR metrics. You can create interactive dashboards, set up alerts for key metrics, and share insights with your team. This approach supports data-driven decision-making and helps you achieve your HR goals.
HR Metrics Dashboard Benefits for Organizations
A well-designed HR metrics dashboard brings many benefits to your organization. You gain a clear view of your workforce, which helps you make better decisions and improve productivity. With FineBI, you unlock real-time analytics and collaborative decision-making, making your HR dashboard a powerful tool for every HR professional.
Data-Driven HR Decisions
You need to make decisions based on facts, not guesses. An HR metrics dashboard gives you real-time insights into your workforce. You can respond quickly to trends like rising turnover or changes in engagement. With a dashboard, you track key metrics, manage costs, and monitor compliance. This approach leads to data-driven decision-making and helps you optimize resource allocation.
- Real-time insights let you act fast when you see changes in workforce metrics.
- You plan for future talent needs by analyzing workforce data.
- Dashboards track engagement metrics, so you can launch initiatives that boost morale and productivity.
- You monitor expenses and compliance, reducing legal risks and improving cost management.
Identifying Trends
Spotting trends early helps you stay ahead. Your HR metrics dashboard tracks key workforce metrics over time. You see patterns in engagement, productivity, and retention. This lets you address issues before they become bigger problems.
- Dashboards help you identify emerging issues in workforce productivity and engagement.
- You align HR actions with business goals by understanding trends in your workforce.
- Clear visuals and real-time data make it easy to share insights and foster transparency.
Strategic Planning
Strategic planning becomes easier with an HR metrics dashboard. You use visual insights to understand workforce data and make informed decisions. FineBI supports scenario simulation, so you can explore different workforce strategies.
| Role of HR Dashboards | Description |
|---|---|
| Visual Insights | See data in charts and graphs for better understanding. |
| Trend Identification | Spot trends and anomalies in workforce metrics. |
| Performance Analysis | Analyze KPIs to guide strategic decisions. |
| Scenario Simulation | Test "what if" scenarios for workforce planning. |
| Real-time Data | Get immediate updates for quick action. |
| Competitive Insights | Learn from talent management and retention strategies. |
Stakeholder Communication
Communication improves when you use an HR metrics dashboard. You present complex workforce data in a simple, visual format. This makes it easier for HR teams and stakeholders to understand key metrics and collaborate.
- Dashboards provide a centralized view of HR metrics, improving understanding across departments.
- Data visualization simplifies information for stakeholders.
- User-friendly dashboards encourage collaboration and support better decision-making.
- Enhanced communication leads to more effective strategic planning and improved workforce productivity.
FineBI enables you to share dashboards securely, ensuring everyone has access to the latest HR metrics. You build a culture of transparency and data-driven decision-making, which drives better outcomes for your organization.
Implementing HR Metrics Dashboard with FineBI
Setting Objectives
You start by defining clear objectives for your HR metrics dashboard. Decide what you want to achieve with your dashboard. You might want to improve recruiting efficiency, boost engagement, or reduce employee turnover rate. Identify your audience, such as HR managers, executives, or team leaders. Each group needs different insights. For example, executives need a broad overview, while HR managers focus on specific functions like retention or recruiting.
Tip: Align your dashboard objectives with your organization’s strategic goals. This ensures your HR dashboard delivers relevant and actionable insights.
Choosing Metrics
Selecting the right metrics is essential for an effective HR dashboard. You should customize your dashboard based on the needs of your target group. Identify business questions that matter most. Use individual dashboards for functions like recruiting or retention, and provide a broad overview for executives. Rank key performance indicators by importance and keep your dashboard simple.
| Step | Description |
|---|---|
| 1 | Customize dashboards for each audience. |
| 2 | Identify business questions to guide metric selection. |
| 3 | Use focused dashboards for HR functions. |
| 4 | Provide executive dashboards for broad workforce insights. |
Ensuring Data Quality
High data quality makes your HR metrics dashboard trustworthy. You create and maintain a data dictionary to keep data fields consistent. Automate data capture to enforce standards. Implement access controls so only authorized users can edit data. Establish validation processes to ensure accuracy. Integrate data carefully to maintain a single source of truth. Adhere to IT and cybersecurity standards for protection. Train all HR users on data quality procedures.
- Maintain a data dictionary for consistency.
- Automate data entry to reduce errors.
- Control access and validate data regularly.
- Integrate data for a unified workforce view.
- Train users on data quality and security.
Training Teams
You empower your HR team to use the dashboard effectively. Track training participation and completion rates. Use analytics and visualization to explore training performance and identify learning gaps. FineBI supports interactive dashboards that consolidate data from multiple sources, making training more engaging and effective.
- Monitor training metrics to measure participation.
- Analyze course completion rates for workforce development.
- Use interactive dashboards to visualize learning outcomes.
Continuous Improvement
Continuous improvement keeps your HR dashboard valuable. Use your dashboard to identify and solve problems. Categorize raw data to create actionable information. Organize workforce data by geography or service lines. Deliver reports in dashboard format for easy analysis. Infer insights to spot blind spots and strategize on gaps. Create action plans with accountability and target dates. Measure outcomes periodically to ensure progress.
Note: Companies that review and optimize their HR dashboards see better business outcomes. Accurate time and attendance tracking, shift scheduling, absence management, and payroll reporting all improve workforce productivity and engagement. Only a small percentage of executives feel confident in their employee data, so ongoing review is critical.
FineBI supports every stage of HR dashboard deployment. You integrate data from over 60 sources, process and clean it, visualize key metrics, and publish dashboards securely. FineBI’s workflow helps you maintain high data quality, empower your HR team, and drive continuous improvement in engagement, recruiting, retention, and productivity.
You can transform your HR strategy by using an HR metrics dashboard. When you track engagement and employee engagement score, you gain real-time insights that drive better decisions. FineBI helps you build dashboards that streamline reporting and improve workforce management. You see improvements in engagement, retention, and employee engagement score. To maximize results, define your data with purpose and use your dashboard to highlight trends. Leverage engagement data and employee engagement score to align HR actions with business goals.
Continue Reading About HR Metrics Dashboard
What is a Dashboard and How Does It Work
Store Performance Dashboard: Your Retail Command Center
How to Craft an Effective Analytics Dashboard
What is a Digital Dashboard and How Does It Work
What is a KPI Dashboard and Why Your Business Needs One


FAQ

The Author
Lewis
Senior Data Analyst at FanRuan
Related Articles

How to Build an Investment Portfolio Reporting Dashboard for Executives: KPIs, Benchmarks, and Drill-Down Views
Investment portfolio reporting for executives is not about showing every holding, transaction, and chart your investment team can produce. It is about giving CEOs, CFOs, CIOs, boards, and investment committees a fast, re
Yida YIn
Jun 25, 2026

12 KPI Reporting Examples for Executive Dashboards: What to Show in Weekly, Monthly, and Quarterly Reviews
Executive leaders do not need more data. They need decision ready $1 examples that match how often they review the business and what actions they are expected to take. A weekly $1 should surface fast moving risks and per
Yida YIn
Jun 25, 2026

How to Build a Digital Marketing Reports Dashboard: Executive Examples, KPIs, and Templates
A $1 is the control layer that helps executives and marketing leaders turn scattered channel data into fast, confident decisions. If you are a CEO, CMO, operations director, or marketing analytics lead, the real problem
Yida Yin
May 07, 2026