An incident management dashboard should help teams detect risk early, prioritize response, and communicate service health with confidence. In practice, many dashboards do the opposite. They look polished, contain plenty of charts, and still leave operations teams unsure what needs attention first.
The problem is rarely the existence of reporting. It is the design logic behind it. When teams track the wrong metrics, blend incompatible data, or build one dashboard for every audience, the result is misleading visibility rather than operational clarity.
This article explains why incident reporting breaks down, identifies 10 common reporting mistakes, and shows how to fix them so your dashboard becomes a practical decision tool instead of a static reporting surface.
Why an incident management dashboard breaks down in practice
A dashboard often fails not because teams lack data, but because they expect the dashboard to answer questions it was never designed to support.
What teams expect a dashboard to reveal versus what it actually shows
Most teams expect an incident management dashboard to reveal:
- what is happening now
- what requires escalation
- where SLA risk is rising
- which services are unstable
- whether performance is improving over time
What many dashboards actually show is a loose collection of generic metrics:
- ticket counts
- average resolution time
- open versus closed cases
- monthly totals
- broad trend lines without context
These figures are not useless, but they do not automatically support action. A dashboard becomes effective only when each metric is connected to a specific decision, such as whether to reassign resources, trigger escalation, investigate a service, or review a process bottleneck.
How weak reporting habits turn useful metrics into noise
Even good metrics become noise when reporting discipline is weak. Common patterns include:
- adding charts because they are available in the tool
- preserving outdated KPIs no one reviews
- mixing operational and executive data in one page
- relying on inconsistent ticket categories
- emphasizing neat averages over operational exceptions
Over time, teams stop reading the dashboard critically. They scan it, reference it in meetings, and quietly maintain side spreadsheets because the official view is not trusted enough for real decisions.
The cost of poor visibility for response time, service quality, and stakeholder trust
A weak dashboard creates more than analytical inconvenience. It directly affects service performance.
| Area | What poor reporting causes |
|---|---|
| Response time | High-priority incidents are harder to detect early |
| Service quality | Repeating issues remain hidden behind aggregate trends |
| Backlog control | Unresolved workload is masked by closure activity |
| Leadership decisions | Resource allocation is based on incomplete context |
| Stakeholder trust | Executives and customers question the reliability of status reporting |
When visibility is poor, incident management becomes reactive. Teams spend more time explaining what happened than preventing recurrence or accelerating recovery.
10 reporting mistakes that make your incident management dashboard misleading
1. Tracking too many metrics without a clear decision purpose
Many dashboards fail because they attempt to display everything the service desk system can produce. More metrics do not create more insight. They often create hesitation.
Why overloaded views make it harder to spot urgent trends
An overloaded dashboard forces users to search for meaning under time pressure. During incident review meetings, this leads to delays, conflicting interpretations, and missed warning signs.
Common symptoms include:
- dozens of tiles with little hierarchy
- charts with overlapping meanings
- indicators with no clear owner
- metrics no one can explain or act on
If a dashboard user cannot answer “What decision does this chart support?” the metric is likely unnecessary.
How to limit reporting to operationally meaningful signals
A better approach is to narrow each dashboard view to a small set of operational signals, such as:
- active incident load
- priority distribution
- response SLA risk
- aged backlog
- top affected services
- recurrence trend
A practical rule is to keep only metrics that directly support one of these actions:
- respond
- escalate
- allocate
- investigate
- improve
2. Focusing on volume instead of business impact
Ticket volume is easy to measure, which is why many dashboards overuse it. But incident count alone says very little about business risk.
Why ticket counts alone do not explain severity, risk, or customer disruption
A service with 200 low-impact incidents may be less critical than a single high-severity outage affecting revenue, compliance, or customer access. When dashboards prioritize volume without context, leaders may direct attention to noisy areas instead of business-critical ones.
Volume-based reporting often misses:
- affected users or customers
- service criticality
- revenue or operational disruption
- duration of impact
- dependency on core platforms
Which impact-based measures give leaders better context
To improve reporting, include measures such as:
- incidents by severity and business priority
- impacted service count
- user or customer impact estimates
- downtime duration
- major incident frequency
- incidents tied to critical business processes
This is also where modern BI tools can help. With FineBI, teams can combine service desk data with business system data to visualize incident impact beyond ticket volume alone, making the dashboard more relevant to both IT and business stakeholders.
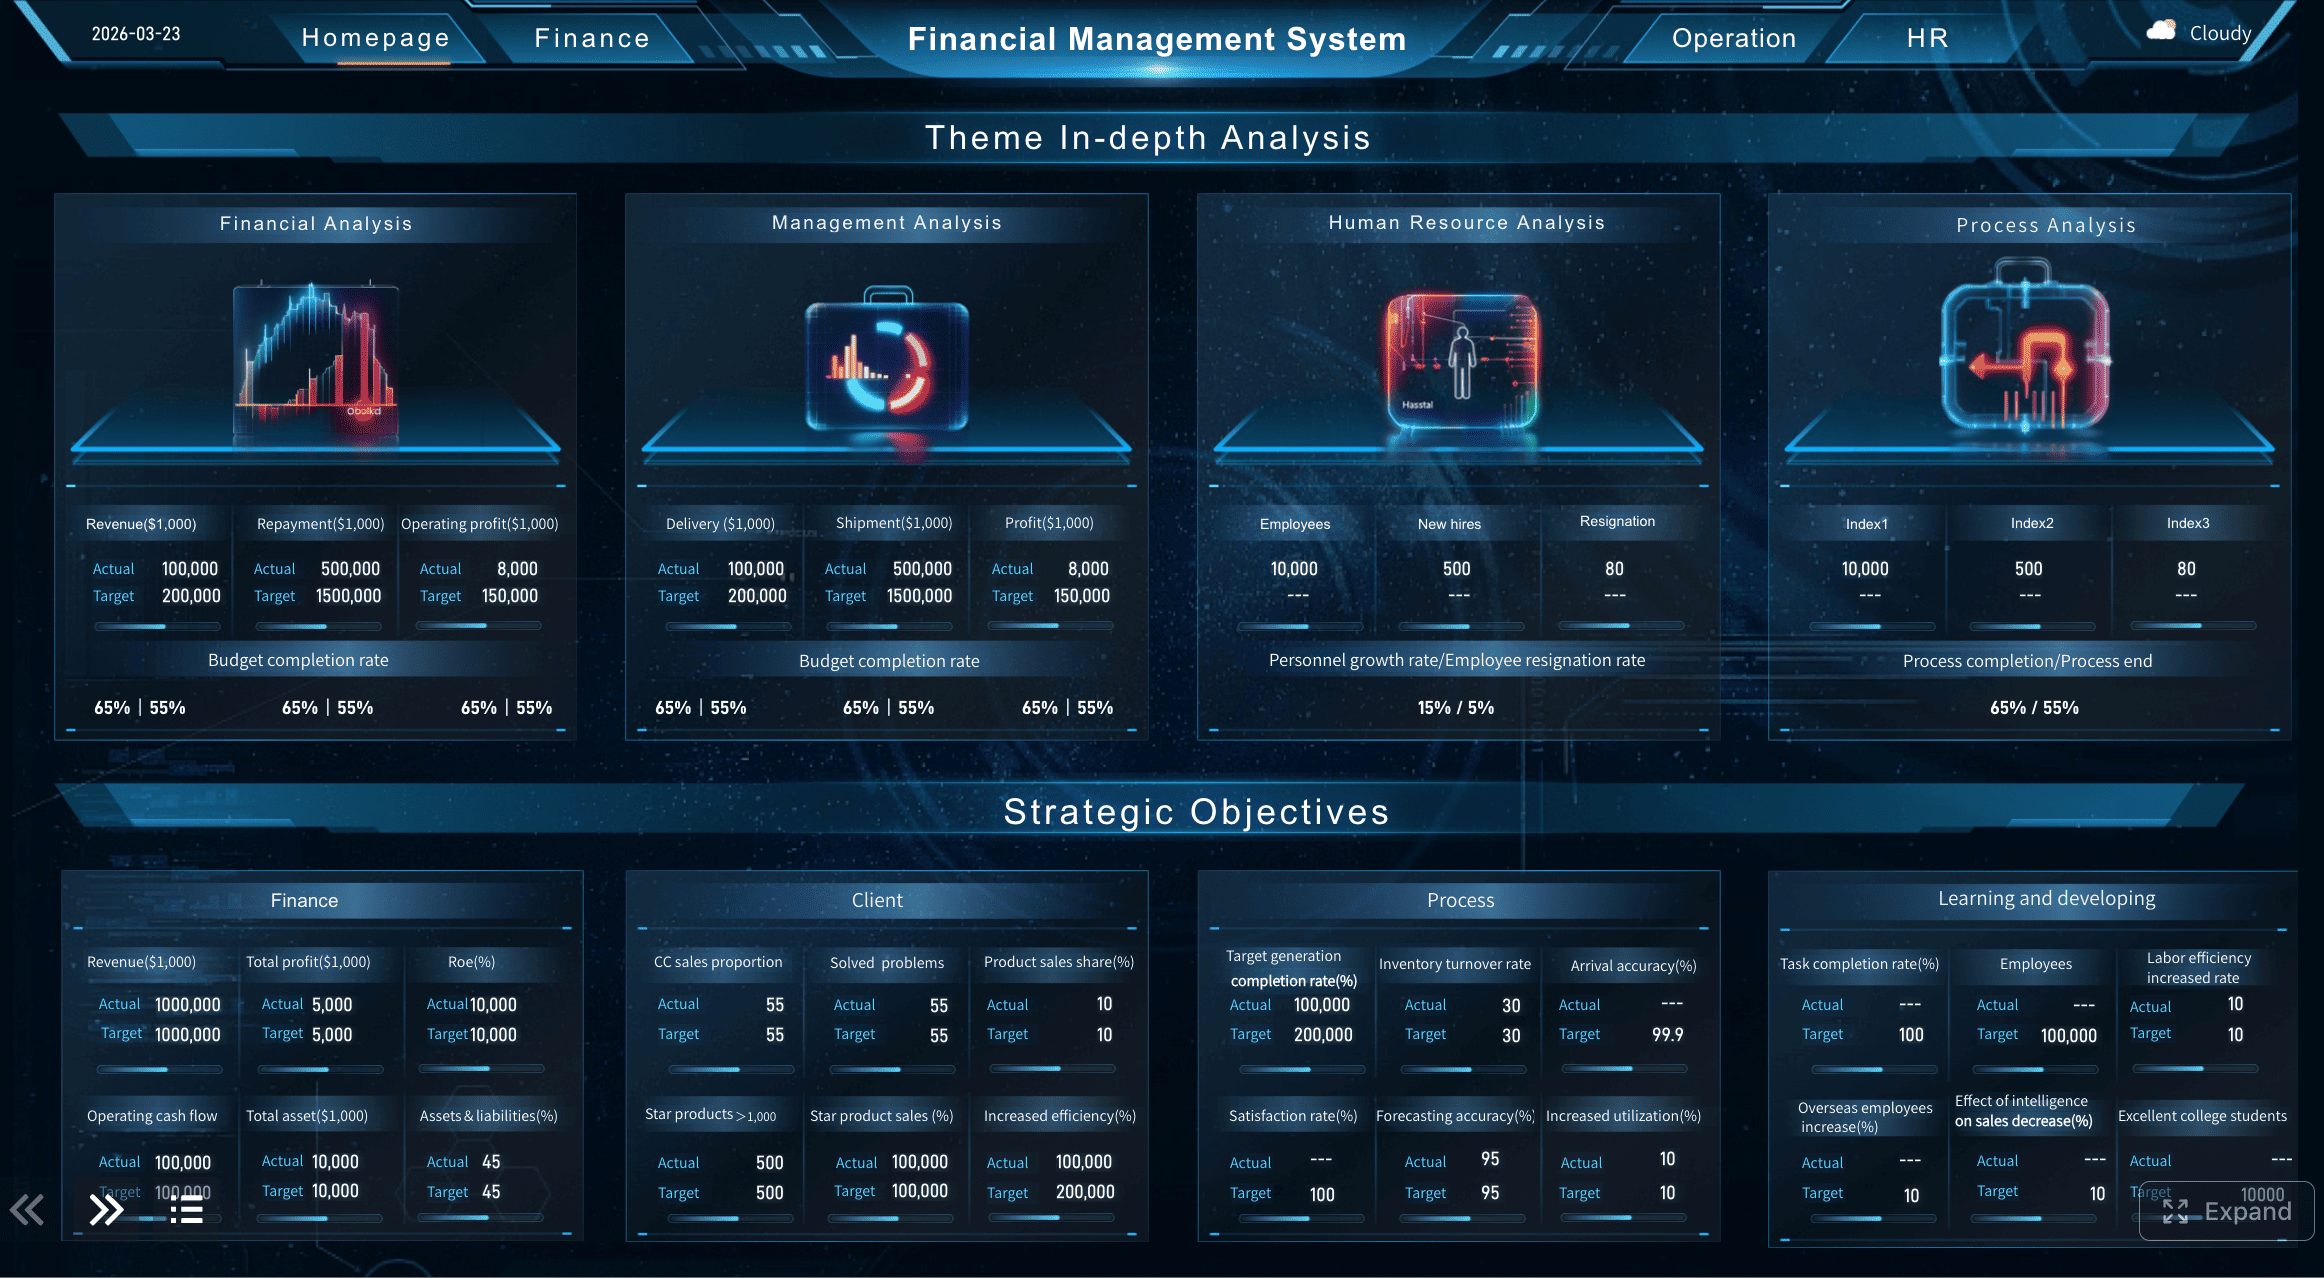 A Dashboard Example with Data Combination created by FineBI (Click to Engage)
3. Mixing unresolved incidents with closed cases in the same view
This is one of the most common reasons an incident management dashboard looks healthy when operations are actually under strain.
How blended reporting hides backlog pressure and active workload
When open and closed incidents are shown together without distinction, recent closure volume can create the illusion of control even while unresolved backlog is increasing. Teams may celebrate throughput while active risk quietly accumulates.
This affects visibility into:
- current workload
- pending escalation pressure
- aging unresolved tickets
- shift handoff risk
- capacity shortfalls
Better ways to separate real-time operations from historical analysis
Use separate views for separate purposes:
- Live operations view: open incidents, aged backlog, response status, current SLA risk
- Performance view: resolution trends, closure rates, breach trends, recurrence analysis
This distinction is essential. Incident commanders need immediate state awareness; managers and leaders need trend interpretation.
4. Ignoring data quality and inconsistent categorization
No dashboard design can compensate for poor source data. If incident records are inconsistently tagged, incomplete, or duplicated, reporting will remain unreliable.
How bad tagging, missing fields, and duplicate records distort reports
Data quality problems create misleading outputs such as:
- false spikes in certain categories
- underreported major incidents
- incorrect ownership analysis
- distorted SLA statistics
- duplicate counting of the same event
For example, if one team labels incidents by symptom and another by root service, service-level reporting becomes structurally inconsistent.
Practical cleanup rules that improve dashboard trustworthiness
Start with simple, enforceable rules:
- standardize category and subcategory definitions
- require priority and severity fields
- define assignment group naming conventions
- prevent duplicate records with validation logic
- close free-text loopholes where structured fields should be used
- audit null rates and classification drift monthly
Trust in the dashboard rises when users see that definitions are stable and exceptions are controlled.
5. Reporting only averages and hiding outliers
Average-based reporting is convenient, but incidents are rarely distributed evenly. Outliers matter because they often represent the most severe service failures.
Why mean resolution time can mask major service failures
A mean resolution time may appear acceptable even when a subset of critical incidents took far too long to resolve. This is dangerous because the dashboard appears compliant while the customer experience tells a different story.
For example:
- 80% of incidents resolved quickly
- 15% resolved moderately late
- 5% catastrophically delayed
The average may still look reasonable, while the operational reality is not.
When to use percentiles, ranges, and exception views instead
Use more informative measures such as:
- median resolution time
- 90th or 95th percentile resolution time
- min-max ranges
- aged incident bands
- breach and near-breach views
- exception tables for critical outliers
These formats reveal whether performance is consistently strong or merely cosmetically acceptable.
6. Using visuals that are hard to interpret quickly
A dashboard is not a design exercise. In incident management, readability under pressure matters more than visual novelty.
Common chart choices that slow down incident review meetings
The following often reduce speed and clarity:
- dense pie charts with too many slices
- decorative gauges with little comparative value
- stacked visuals with inconsistent color logic
- multi-axis charts that require explanation
- overcrowded heat maps without labels
If users need several seconds to decode a chart, it is too complex for operational use.
Simple visualization fixes that improve scanning and actionability
Prefer visual forms that support immediate comparison:
- bar charts for ranking and volume differences
- line charts for trends over time
- single-value indicators for urgent headline metrics
- tables with conditional formatting for exception review
- consistent colors for severity and status states
Good visualization is not about making data impressive. It is about making signals unmistakable.
7. Failing to segment reports by team, service, or priority
A single global dashboard may look comprehensive, but it rarely helps the people responsible for action.
Why one global view rarely helps frontline responders or managers
Frontline responders need to know what belongs to them. Service owners need to know which services are deteriorating. Executives need a summarized risk picture. A universal view often satisfies none of these audiences.
Without segmentation, teams struggle to identify:
- ownership gaps
- service-specific incident hotspots
- team workload imbalance
- priority-specific delays
- recurring trouble areas by product or platform
How segmentation reveals ownership gaps and recurring hotspots
Add filters and segmented views by:
- team or assignment group
- service or application
- environment
- business unit
- severity or priority
- channel or source
This helps transform broad reporting into accountable reporting. It also supports targeted improvement, since recurring issues usually emerge in specific combinations of service, owner, and incident type.
8. Forgetting trend analysis and showing only current status
A point-in-time dashboard can show what is happening now, but not whether the situation is getting better or worse.
Why point-in-time reporting misses recurring patterns
Current-state metrics are necessary, but insufficient. A backlog of 120 incidents may be acceptable or alarming depending on the recent pattern. If the dashboard lacks historical comparison, teams lose the ability to detect deterioration early.
This limits insight into:
- recurring incident surges
- post-change degradation
- seasonal workload shifts
- improvement from process adjustments
- persistent SLA decline
How to compare periods to uncover deterioration or improvement
Useful trend analysis includes:
- week-over-week and month-over-month comparisons
- same-period historical baselines
- pre-change versus post-change incident patterns
- rolling averages for volatility control
- trend by service, priority, and resolver group
This is where an analytical layer becomes especially valuable. Platforms such as FineBI can support period comparison, interactive drill-down, and cross-source trend analysis, helping teams move beyond static status reporting into deeper operational learning.
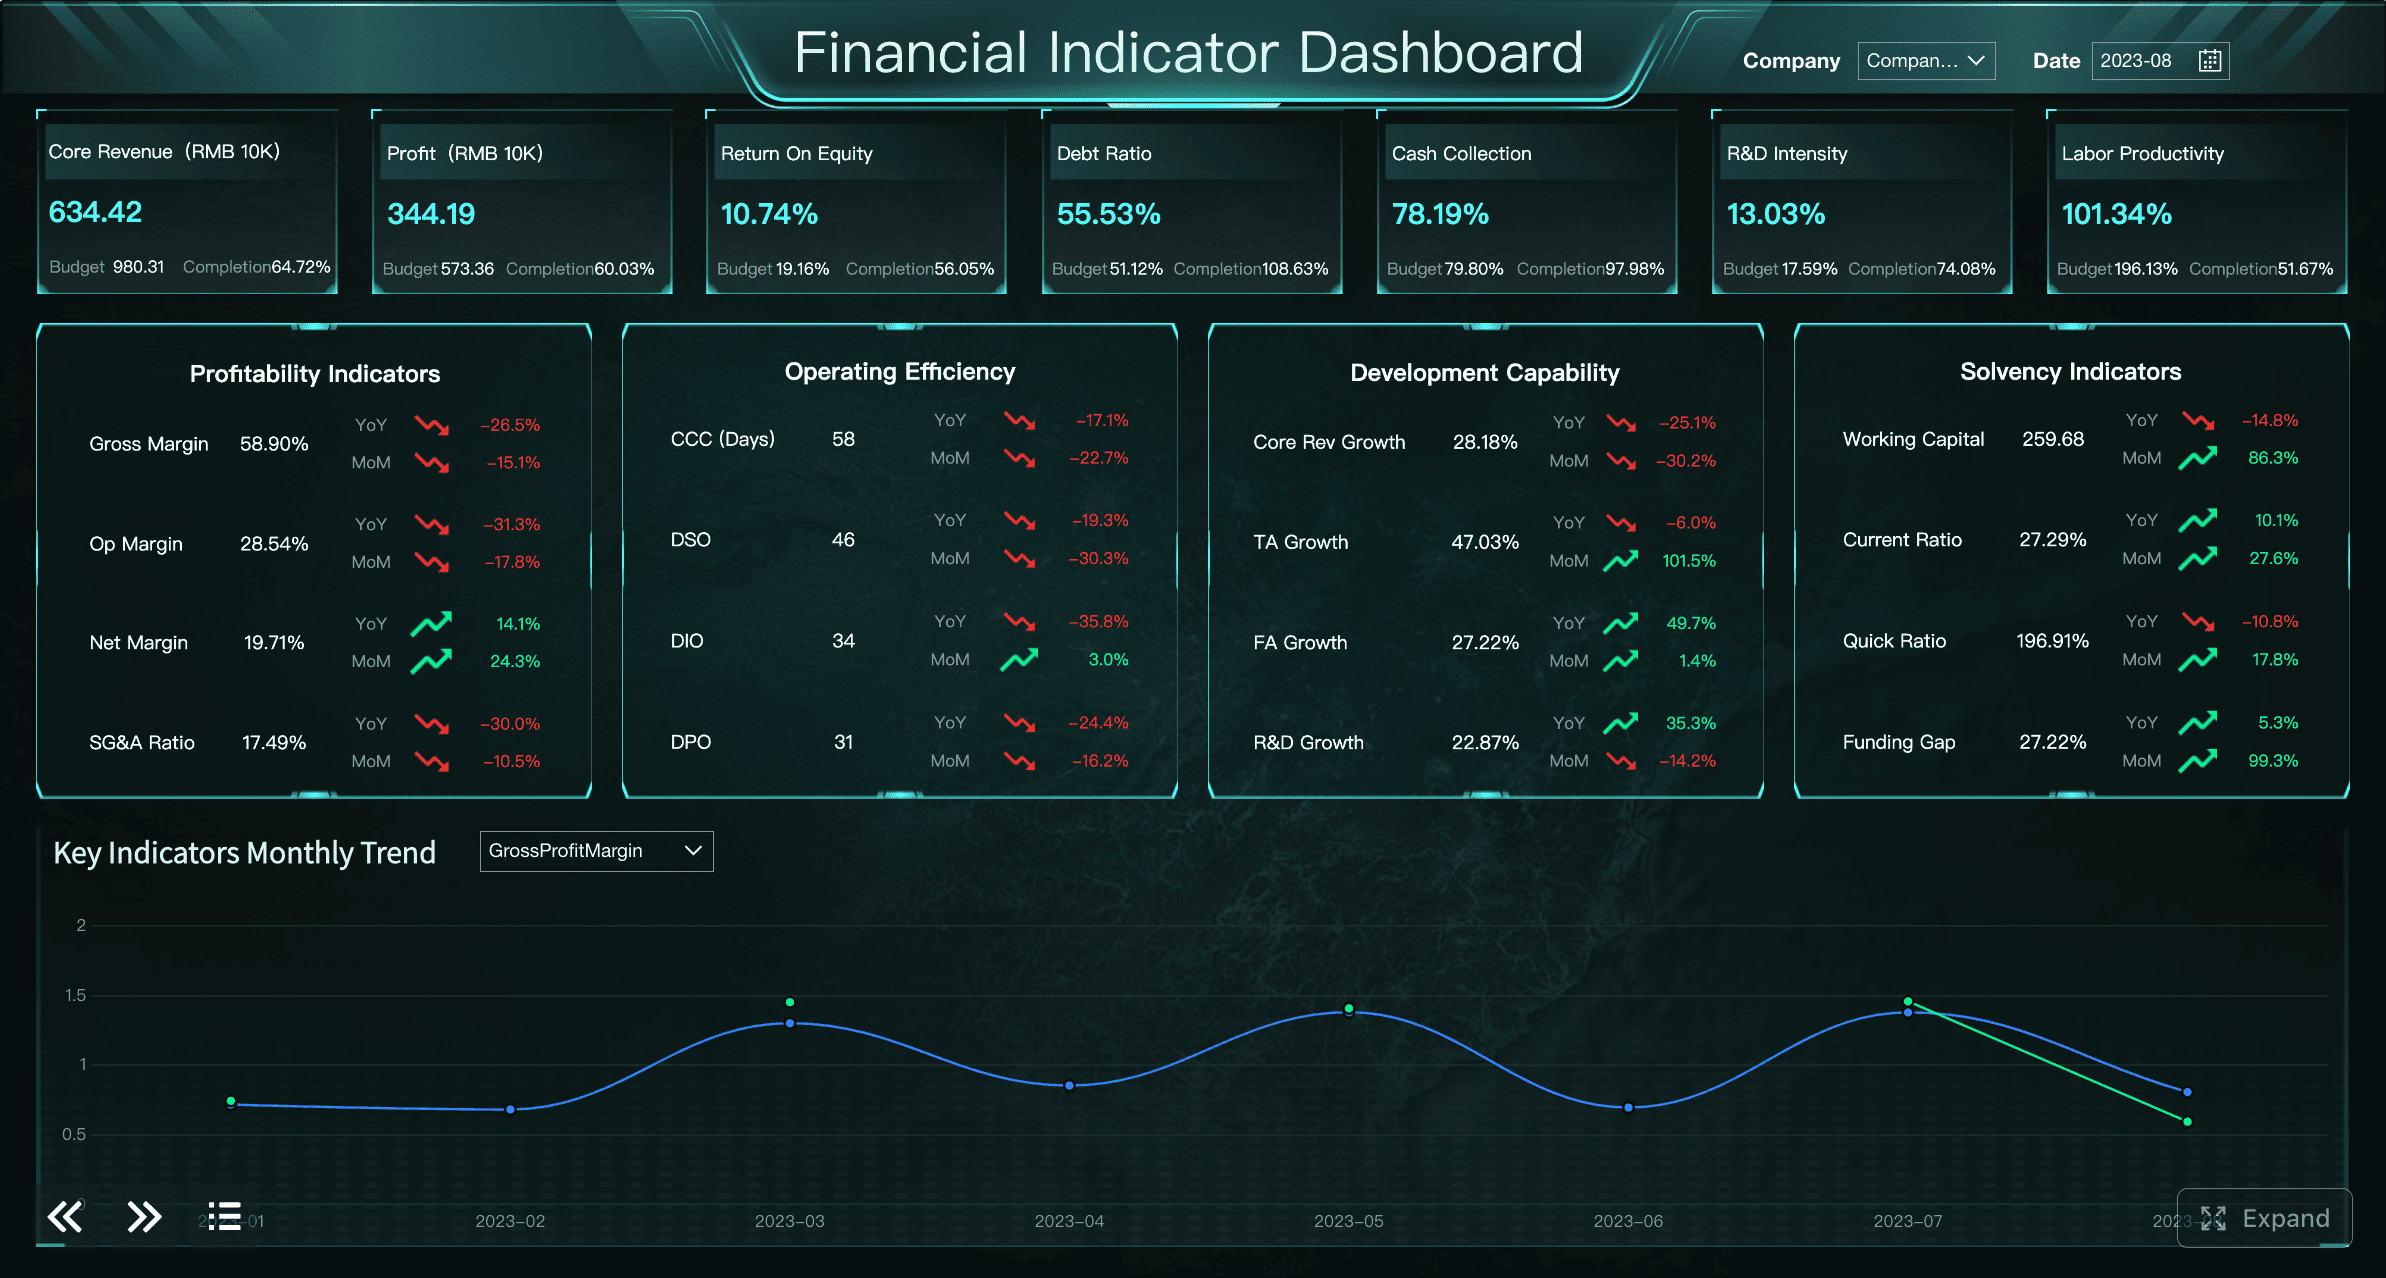 A Dashboard Example created by FineBI (Click to Engage)
9. Building reports without a clear audience
A dashboard cannot communicate effectively if it tries to serve all stakeholders with the same level of detail.
How executives, service owners, and responders need different levels of detail
Different audiences ask different questions:
- Executives: Are critical services stable? What risks need leadership attention?
- Service owners: Which services are driving major incidents and SLA breaches?
- Response teams: What needs action now, and where is escalation blocked?
When these needs are merged into one dashboard, the result is either oversimplified for operators or too detailed for leadership.
A practical way to tailor views without duplicating effort
Use a layered model:
| Audience | Best dashboard focus |
|---|---|
| Executives | High-level service risk, major incident trend, SLA summary |
| Service owners | Service-specific trends, recurring incident categories, breach analysis |
| Operations teams | Active incidents, aged backlog, response queue, ownership status |
The key is not building separate reporting systems, but creating role-based views from the same governed data model.
10. Treating the dashboard as a static report instead of an operating tool
Dashboards decline in value when teams treat them as a one-time build rather than a living part of incident operations.
Why teams stop trusting dashboards that never evolve
If metrics remain unchanged while workflows, services, and escalation paths evolve, the dashboard becomes outdated. Users notice this quickly. They begin to rely on side conversations, screenshots, or manually compiled reports.
Warning signs include:
- unused charts that remain for months
- metrics tied to retired processes
- no adaptation after post-incident reviews
- repeated stakeholder complaints about missing context
How to create a review rhythm that keeps reporting relevant
Establish a reporting governance rhythm:
- monthly metric review
- quarterly dashboard redesign check
- post-incident validation of reporting usefulness
- ownership assignment for each metric and view
- retirement of low-value charts
A dashboard should evolve with the operating model. Otherwise, its relevance decays even if the underlying system remains active.
How to fix the reporting problems behind a weak incident management dashboard
Start with the operational questions the dashboard must answer
Before choosing charts, define the actual operational questions.
Define the few decisions each view should support
Examples include:
- Which incidents need immediate escalation?
- Where is backlog age creating delivery risk?
- Which services are producing repeated high-priority incidents?
- Which teams are approaching SLA breach thresholds?
If a metric does not support a real decision, remove it.
Align metrics to response, escalation, backlog, and service health outcomes
A strong incident management dashboard should align reporting with outcomes such as:
- response speed
- escalation effectiveness
- backlog control
- service stability
- SLA adherence
This keeps the dashboard practical rather than descriptive only.
Standardize incident data before redesigning visuals
Dashboard improvement should begin with data governance, not chart cosmetics.
Create consistent field definitions, categories, and severity rules
At minimum, standardize:
- incident status definitions
- severity and priority criteria
- service naming conventions
- resolver group taxonomy
- closure and recurrence rules
Set validation checks to reduce reporting errors over time
Useful controls include:
- mandatory structured fields
- duplicate detection rules
- invalid category alerts
- null-rate monitoring
- monthly data quality audits
Without these controls, even well-designed reporting will degrade.
Design separate views for live operations and performance reporting
Operational monitoring and retrospective analysis should not compete for the same screen.
Use one view for active response and another for trend analysis
A practical structure is:
Live operations dashboard
- active open incidents
- incidents by severity
- aged unresolved cases
- SLA risk queue
- assignment ownership
- trend in incident volume
- response and resolution percentiles
- breach rate over time
- top recurring categories
- service-specific patterns
Keep historical metrics from distracting incident commanders during active work
During active response, users should not need to interpret long-term analytical views. Keep immediate work signals prominent and reserve trend analysis for review cycles.
Build for action, not just observation
A dashboard should not only describe the environment. It should help users decide what to do next.
Add thresholds, drill-down paths, and ownership cues
Action-oriented features include:
- threshold alerts
- links to incident queues
- service drill-down by severity
- ownership labels by team
- near-breach highlighting
- exception-based sorting
Make every section lead naturally to a next step
Each dashboard section should imply an action:
- high aged backlog -> review staffing or escalation path
- service incident spike -> investigate recent change history
- rising breach trend -> review queue triage process
- repeated category recurrence -> initiate problem management review
This is where BI maturity matters. With tools like FineBI, organizations can create drill-down dashboards that connect overview metrics to underlying incident detail, improving both executive visibility and operational follow-through.
 A drill-down dashboard example created by FineBI (Click to Engage)
How to create an effective incident management dashboard teams will actually use
Core components every useful dashboard should include
A practical dashboard usually needs the following components:
- status at a glance: current open incidents, major incidents, SLA risk
- active incident load: open incidents by priority and age
- priority mix: distribution of critical, high, medium, and low issues
- backlog trends: growth or reduction of unresolved incidents over time
- service breakdowns: affected applications, platforms, or business services
- team breakdowns: load and performance by assignment group
These components support both daily control and longer-term process review.
Choose the right structure for your workflow and toolset
The best structure depends on the scale and maturity of your operations.
When a simple incident management overview layout is enough
A simpler dashboard is often sufficient when:
- one or two teams handle most incidents
- service dependencies are limited
- reporting needs are mostly operational
- stakeholders only need concise summaries
In such environments, a clean overview with strong filtering may be enough.
When enterprise teams need deeper service desk or platform-specific reporting
Larger organizations often require:
- service-level drill-down
- multi-team ownership views
- region or business-unit segmentation
- change-to-incident correlation
- integrated SLA and customer impact reporting
In these cases, a more flexible analytics layer is valuable. FineBI can support enterprise teams that need self-service analysis, role-based views, and the ability to combine incident data with operational or business data for broader decision support.
Use templates and examples carefully
Templates can accelerate dashboard creation, but they should never replace reporting logic.
What to borrow from common dashboard templates
Templates are useful for:
- layout inspiration
- metric grouping ideas
- basic filter structures
- common visualization patterns
- standard summary sections
How to adapt layouts without copying irrelevant metrics
Adapt templates by asking:
- Is this metric tied to a decision we actually make?
- Does this chart fit our service model?
- Does this KPI reflect our severity rules and SLA definitions?
- Will this view help the audience act faster?
A template should be a starting point, not a reporting strategy.
Turning incident management dashboard reporting into continuous improvement
A strong incident management dashboard is not a final deliverable. It is part of an ongoing operating system for service reliability.
To keep reporting useful:
- set a monthly review process to retire weak metrics and add better ones
- compare dashboard insight with post-incident findings
- gather feedback from executives, service owners, and frontline teams
- treat dashboard design as part of a broader all-in-one incident management platform strategy
- ensure reporting evolves when workflows, service portfolios, or risk thresholds change
The most effective teams use dashboards not only to monitor incidents, but to improve the way incidents are managed, escalated, and learned from.
Practical checklist to audit your current dashboard
Use the checklist below to evaluate whether your current reporting is helping or misleading:
- Each metric supports a clear operational or management decision
- Open incidents and historical closures are reported separately where needed
- Business impact is visible, not just ticket volume
- Data categories, severity levels, and ownership fields are standardized
- Outliers are visible through percentiles, ranges, or exception views
- Charts are easy to interpret within seconds
- Reports can be segmented by team, service, and priority
- Trend comparisons are included alongside current status
- Different audiences have appropriately tailored views
- The dashboard is reviewed and updated on a recurring schedule
If several boxes remain unchecked, the issue is not only dashboard design. It is reporting discipline. Fix that foundation, and your incident management dashboard can become what it was meant to be: a trusted tool for faster response, clearer accountability, and continuous service improvement.
FAQs
Many dashboards show available metrics instead of decision-focused signals. When charts are not tied to actions like escalation, prioritization, or resource allocation, teams get visibility without clarity.
Focus on metrics that help teams act quickly, such as active incident load, priority mix, SLA risk, backlog age, affected services, and recurrence trends. These indicators are more useful than broad totals alone.
Ticket count shows activity, but it does not explain severity, customer disruption, or business risk. A smaller number of high-impact incidents can matter far more than a large volume of low-priority tickets.
Usually they should be separated or clearly segmented because they answer different questions. Open incidents help teams manage current risk, while closed incidents are better for trend review and performance analysis.
Start by cleaning category definitions, removing unused KPIs, and tailoring views for different audiences. Tools like FineBI can also help combine operational and business data so the dashboard reflects real service impact.


The Author
Yida Yin
FanRuan Industry Solutions Expert
Related Articles

How to Build an Investment Portfolio Reporting Dashboard for Executives: KPIs, Benchmarks, and Drill-Down Views
Investment portfolio reporting for executives is not about showing every holding, transaction, and chart your investment team can produce. It is about giving CEOs, CFOs, CIOs, boards, and investment committees a fast, re
Yida YIn
Jun 25, 2026

12 KPI Reporting Examples for Executive Dashboards: What to Show in Weekly, Monthly, and Quarterly Reviews
Executive leaders do not need more data. They need decision ready $1 examples that match how often they review the business and what actions they are expected to take. A weekly $1 should surface fast moving risks and per
Yida YIn
Jun 25, 2026

How to Build a Digital Marketing Reports Dashboard: Executive Examples, KPIs, and Templates
A $1 is the control layer that helps executives and marketing leaders turn scattered channel data into fast, confident decisions. If you are a CEO, CMO, operations director, or marketing analytics lead, the real problem
Yida Yin
May 07, 2026