An inventory report example is most useful when it helps operations managers answer three practical questions fast: What do we have right now, where are the discrepancies, and what needs to be reordered next? If your team is dealing with stockouts, excess inventory, delayed purchase decisions, or recurring count mismatches, the problem is rarely just inventory volume. It is usually poor visibility, inconsistent review processes, and reports that show numbers without business context. A well-structured inventory report fixes that by turning raw stock data into operational decisions.
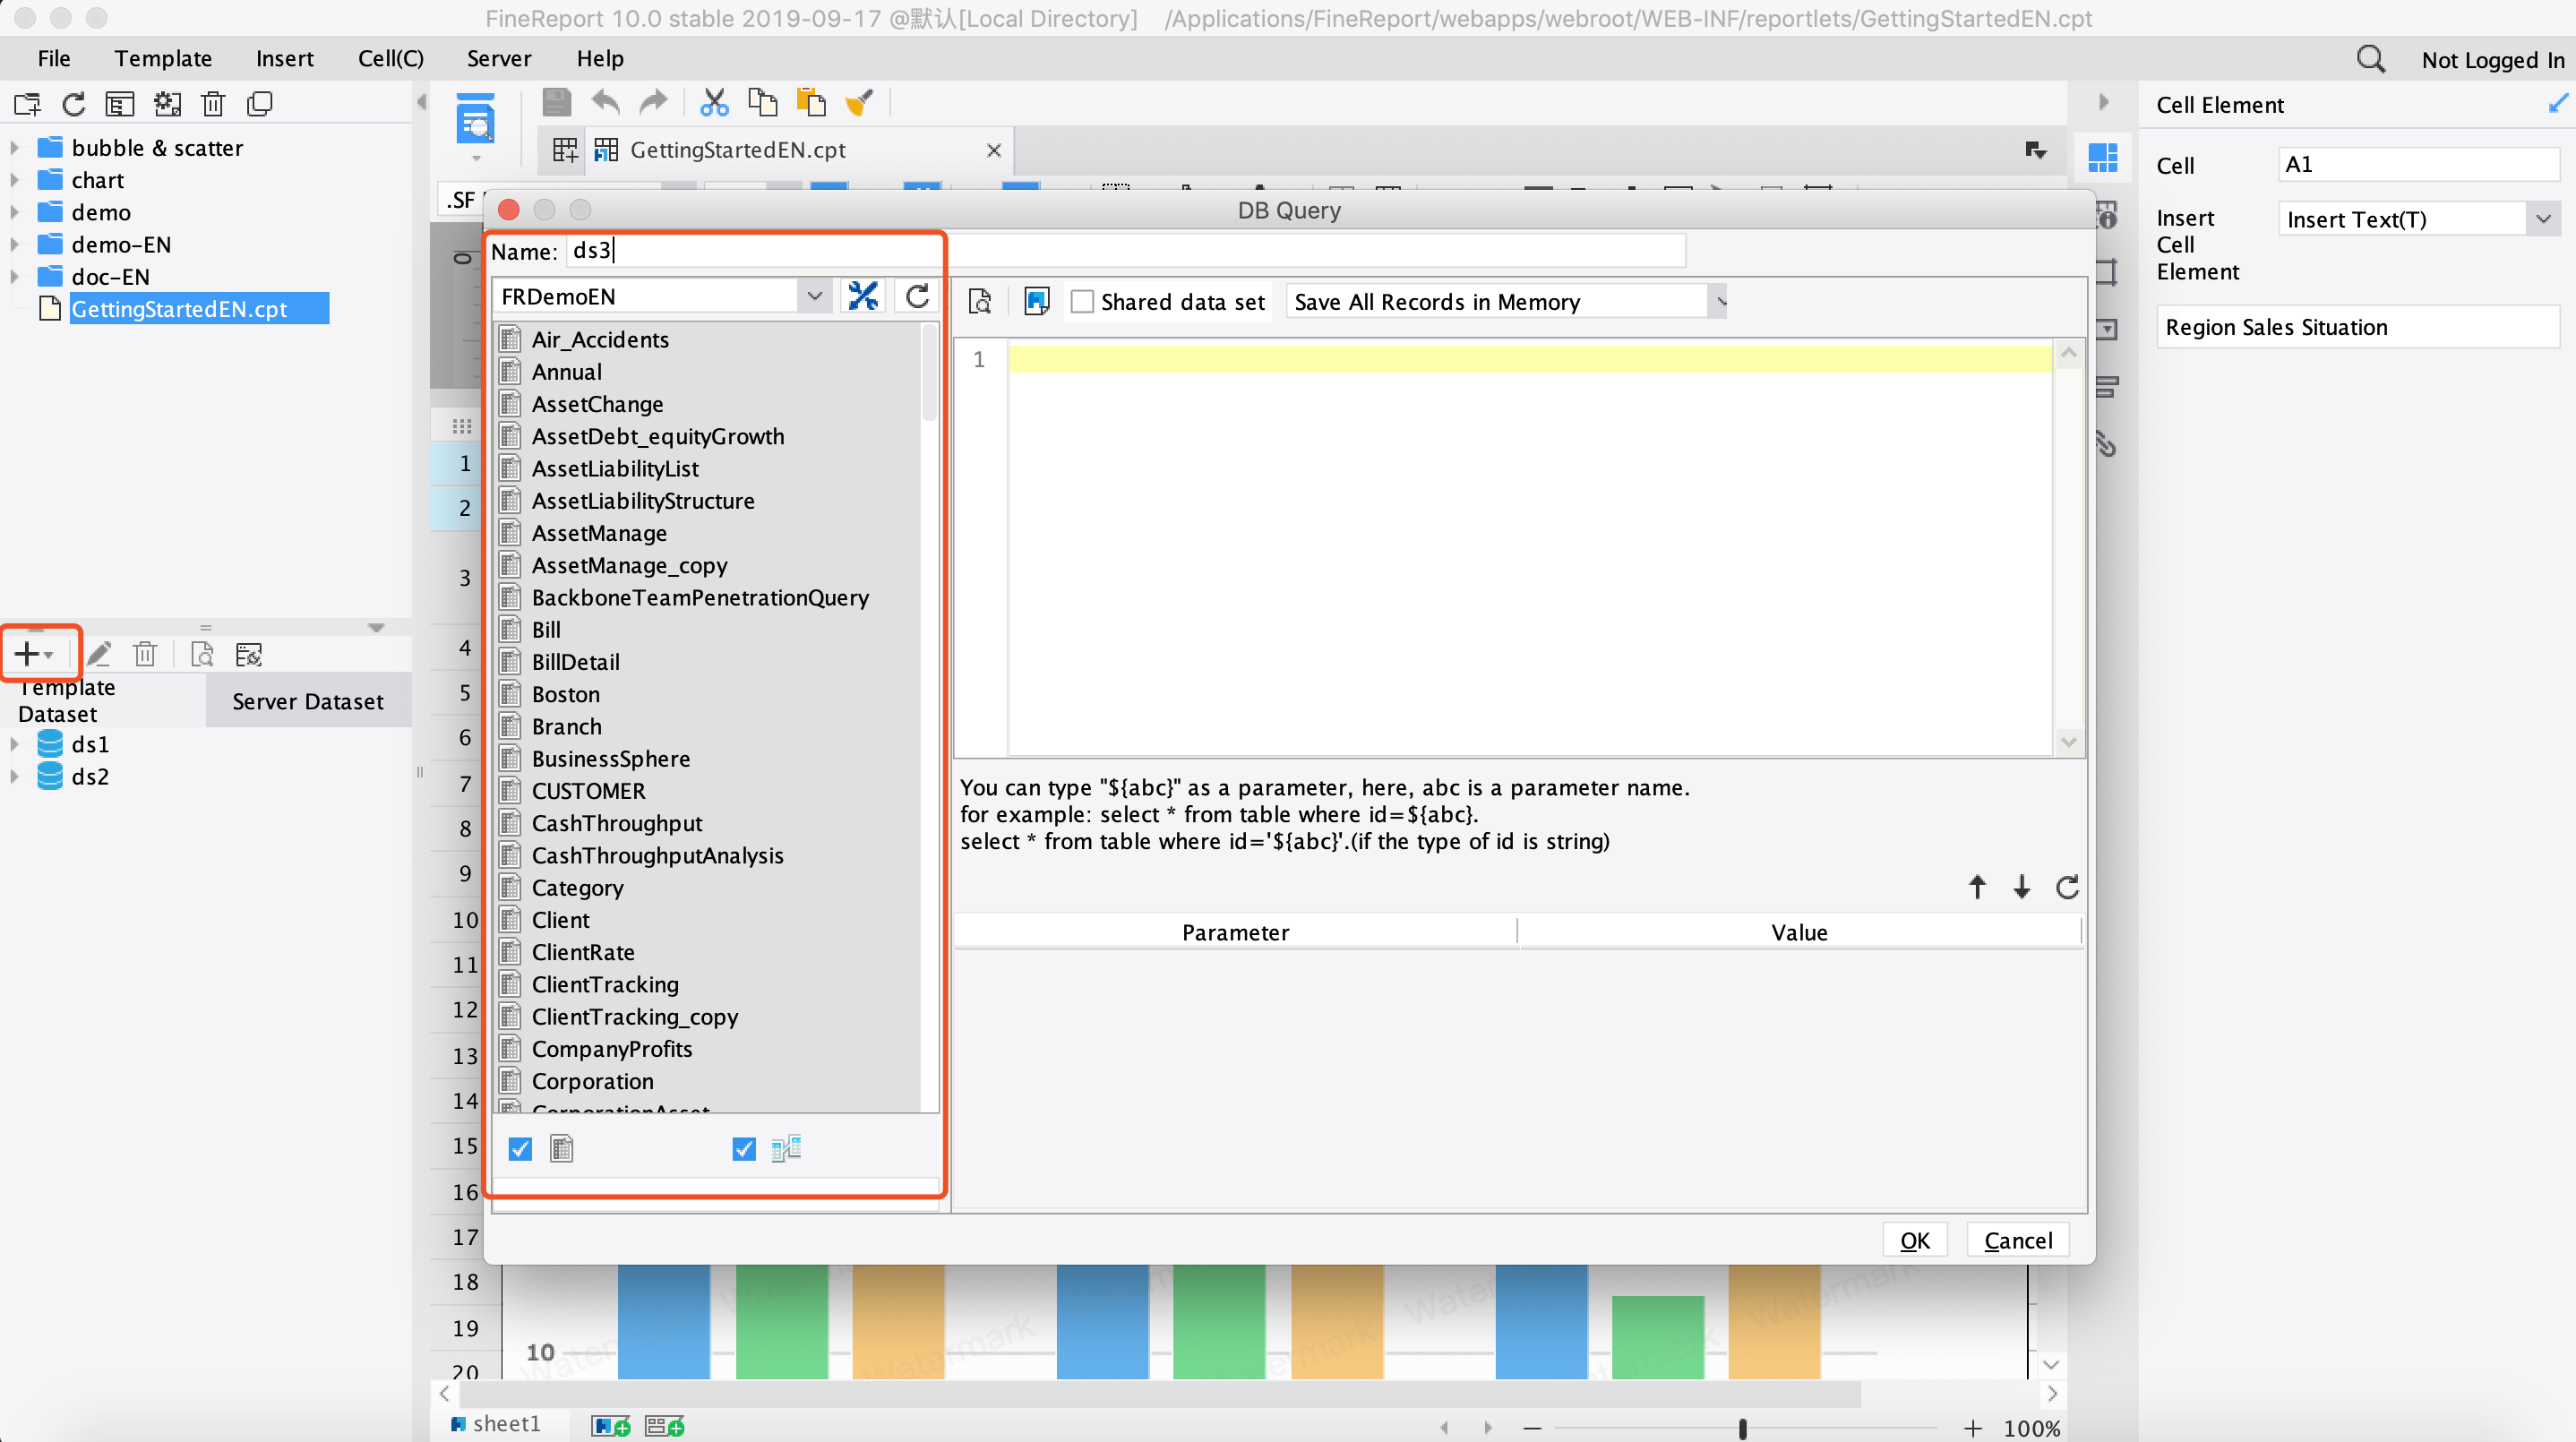
All reports in this article are built with FineReport
An inventory report is not just a stock list. For operations managers, it is a control tool used to monitor availability, detect process failures, and trigger replenishment before service levels are affected. In practice, the best report format combines current balances, variance insights, and action signals in one manager-friendly view.
This walkthrough focuses on the three core decisions an inventory report should support:
Stock visibility: Understand what is physically on hand, what is actually available to promise, and where constraints exist.
Variance control: Compare system records against real counts to expose shrinkage, receiving mistakes, and transaction errors.
Replenishment timing: Use reorder points, lead times, and days of cover to determine which SKUs need urgent purchasing action.
The sample structure used throughout this article includes a top summary, SKU-level detail, variance indicators, and a reorder action section. That structure works well for warehouses, distribution teams, retail operations, and multi-location inventory environments.
Key Metrics (KPIs)
Below are the core elements every practical inventory report example should include:
SKU: Unique item identifier used for tracking and reconciliation.
Item Description: Clear product name for quick manager review.
Location: Warehouse, store, bin, or region where the stock is held.
On-Hand Quantity: Total physical quantity currently recorded in the system.
Available Quantity: Stock available for sale or use after subtracting committed inventory.
Committed Stock: Quantity already allocated to orders, production, or internal demand.
Safety Stock: Buffer inventory held to reduce stockout risk.
Counted Quantity: Quantity physically verified during cycle count or audit.
Variance Quantity: Difference between recorded and counted stock.
Variance Value: Financial impact of the quantity discrepancy.
Reorder Point: Stock threshold that triggers replenishment review or purchase.
Lead Time: Expected supplier or transfer time before replenishment arrives.
Days of Cover: Estimated number of days current available stock can support demand.
Supplier: Vendor responsible for replenishment.
Unit Cost: Cost basis for valuing stock and variance exposure.
Item Status: Operational label such as normal, low stock, critical, slow-moving, or out of stock.
Breaking Down an Inventory Report Example Step by Step
A strong inventory report example should move from visibility to diagnosis to action. That means starting with current stock, then validating the accuracy of that stock, and finally identifying replenishment priorities.
Stock levels and item status
The first section of any inventory report should answer a basic but essential question: What is our usable stock position by item? For each SKU, operations managers should review:
On-hand quantity
Available quantity
Committed stock
Safety stock
These four fields are often confused, but they support different decisions. On-hand tells you what the system says is in stock. Available quantity tells you what can actually be used or sold. Committed stock reveals how much inventory is already spoken for. Safety stock defines how far you can let stock drop before risk becomes unacceptable.
A useful report also applies status logic so managers do not need to scan every row manually. For example:
Out of stock: Available quantity is zero.
Critical: Available quantity is at or below safety stock.
Low stock: Available quantity is above safety stock but below reorder point.
Slow-moving: High on-hand quantity paired with low recent consumption.
This status view helps teams quickly spot three high-risk categories:
Slow-moving items tying up working capital
Critical items that threaten service continuity
Out-of-stock items already impacting fulfillment or operations
Variance analysis
The second layer of the report compares recorded inventory against physical counts. This is where the report shifts from visibility to control. If the system says 240 units but the count shows 228, the variance is not just a number. It is a signal that a process is failing somewhere.
A practical variance section should show:
Recorded quantity
Counted quantity
Variance quantity
Variance percentage
Variance value
Exception notes or reason codes
Common causes of inventory discrepancies include:
Shrinkage: Loss due to theft, damage, or unrecorded disposal
Receiving errors: Goods received physically but entered incorrectly
Picking mistakes: Inventory issued from the wrong SKU or location
Data entry issues: Manual transaction errors or delayed updates
Transfer mismatches: Inter-warehouse movements recorded only on one side
The real value of variance analysis comes from pattern recognition. A one-time mismatch may be a counting issue. Repeated variances in the same location, shift, or supplier flow often point to a systemic process problem that requires corrective action.
Reorder decision signals
Once stock visibility and variance are understood, the next task is deciding what to reorder and when. This is where many teams struggle, because reports often show low balances without enough context to prioritize.
Key Inventory Report Types Operations Managers Should Know
Not every report serves the same purpose. High-performing operations teams use multiple inventory report types together rather than relying on a single static list.
Snapshot reports
Snapshot reports provide a point-in-time view of current stock position. They are useful for daily standups, end-of-day reviews, and executive summaries because they show what inventory looks like right now.
A typical snapshot report includes:
Current on-hand and available stock
Stock status by SKU
Inventory value by location
Low-stock and stockout counts
These reports are ideal when the business needs fast visibility without historical detail.
Movement and usage reports
Movement and usage reports explain how inventory changed over time. They track:
Receipts
Issues
Transfers
Returns
Consumption trends
These reports are critical when teams want to understand whether shortages are caused by demand spikes, delayed receiving, or unusual internal usage. They are also essential for identifying slow-moving items and improving reorder logic.
Audit and physical count reports
Audit and physical count reports support cycle counts, annual counts, and compliance checks. Their main purpose is to validate stock accuracy and document discrepancies.
They typically include:
Count sheets
Count status
Counted quantity
Variance quantity
Variance value
Approval or adjustment trail
These reports are especially important in regulated environments or multi-site operations where process discipline matters as much as stock visibility.
Exception and reorder reports
Exception and reorder reports surface only the items requiring management attention. This makes them highly actionable.
Examples of exception logic include:
Below safety stock
Out of stock
Negative available balance
Excess stock above target threshold
Large variance exceeding tolerance
Reorder required based on days of cover
These reports reduce noise and help managers focus on the SKUs that drive the biggest operational risk.
How to Read the Numbers and Turn Them Into Action
Good reporting is not about displaying more fields. It is about creating a repeatable decision process. Operations managers should use the report to separate urgent intervention from normal review.
Identify urgent stock risks
Start with items that could affect service, production, or order fulfillment immediately. Focus first on:
Stockouts
Low-cover items
High-dependency supplier SKUs
Critical components with no substitute
If a product has only a few days of cover and the supplier lead time is longer than that window, you have an escalation item, not a routine replenishment item. That SKU should be reviewed for expediting, substitute sourcing, or allocation control.
Not all variance deserves the same response. The right way to investigate is to separate isolated counting mistakes from repeat process failures.
Use a simple triage approach:
Confirm the count: Recount large discrepancies before taking action.
Check transaction history: Review receipts, issues, transfers, and adjustments.
Look for patterns: Recurring mismatches by location, user, shift, or supplier suggest process weakness.
Assign root cause: Use reason codes such as receiving error, picking error, damage, or theft.
Correct and prevent: Post adjustments, then fix the underlying workflow.
This approach prevents overreaction to one-off noise while making repeat issues visible enough to solve.
Make smarter reorder decisions
Reordering should never be based on a single stock figure alone. Managers need to balance:
Target service levels
Demand patterns
Order minimums
Lead time variability
Supplier reliability
Storage constraints
For example, an item may appear low in quantity but still have enough cover if demand is slow. Another SKU may look healthy on-hand, but after committed demand and supplier delay are considered, it becomes a near-term risk. The report must support that layered interpretation.
Simple Template Elements to Include in Your Own Report
If you are building your own inventory report example, keep the structure practical. The goal is not to create an overloaded spreadsheet. It is to create a format that supports weekly decisions with minimal confusion.
Essential columns and metrics
At minimum, your template should include:
SKU
Item description
Location
Supplier
Unit cost
On-hand quantity
Available quantity
Committed quantity
Counted quantity
Variance quantity
Variance value
Safety stock
Reorder point
Lead time
Days of cover
Item status
Manager notes
This combination gives operations, procurement, and finance enough information to align on action without switching between multiple systems.
Formatting matters more than many teams realize. If managers cannot see issues quickly, the report loses value.
Use these formatting rules:
Conditional highlights for stockout, critical, low stock, and high variance
Summary totals at the top for urgent counts and financial impact
Manager-friendly notes for exceptions, root causes, and next actions
Filter controls by warehouse, supplier, category, and status
Sortable action views so urgent items appear first
A report should guide attention, not just store data.
Example workflow for weekly review
A weekly inventory review process should be standardized so decisions are made consistently. A simple workflow looks like this:
Count: Perform cycle counts on selected SKUs or locations.
Reconcile: Compare physical counts with recorded balances.
Analyze exceptions: Review large variances, stockouts, and low-cover items.
Approve replenishment: Confirm purchase or transfer actions for priority SKUs.
Document follow-up actions: Capture root causes, owners, and deadlines.
Common Reporting Mistakes and Best Practices
The most common reporting mistake is relying on a single stock figure without context. On-hand quantity alone does not tell you what is committed, what is actually available, or whether replenishment is already overdue.
Other frequent issues include:
Inconsistent counting procedures across warehouses or teams
Delayed transaction updates that make reports look accurate when they are not
Overreacting to one report instead of reviewing trends over time
Overcomplicated templates that teams stop maintaining
Missing ownership for discrepancy follow-up and reorder approval
As a consultant, I recommend four practical best practices for implementation:
1. Standardize inventory definitions first
Make sure everyone uses the same meaning for on-hand, available, committed, safety stock, and reorder point. If definitions vary by team, reports will create conflict instead of clarity.
2. Set a fixed review cadence
Run the same report on the same schedule each week. Consistency improves trend analysis and makes accountability easier.
3. Add exception thresholds
Do not force managers to read every row equally. Define thresholds for large variance, low days of cover, and high-value shortages so attention goes where the business risk is highest.
4. Link inventory review to action ownership
Every flagged issue should have an owner, deadline, and reason code. Reporting without follow-up is just observation.
5. Review trends, not just snapshots
Use weekly or monthly comparisons to identify whether stock accuracy, service risk, or overstock exposure is improving or deteriorating.
Build This Inventory Report Faster with FineReport
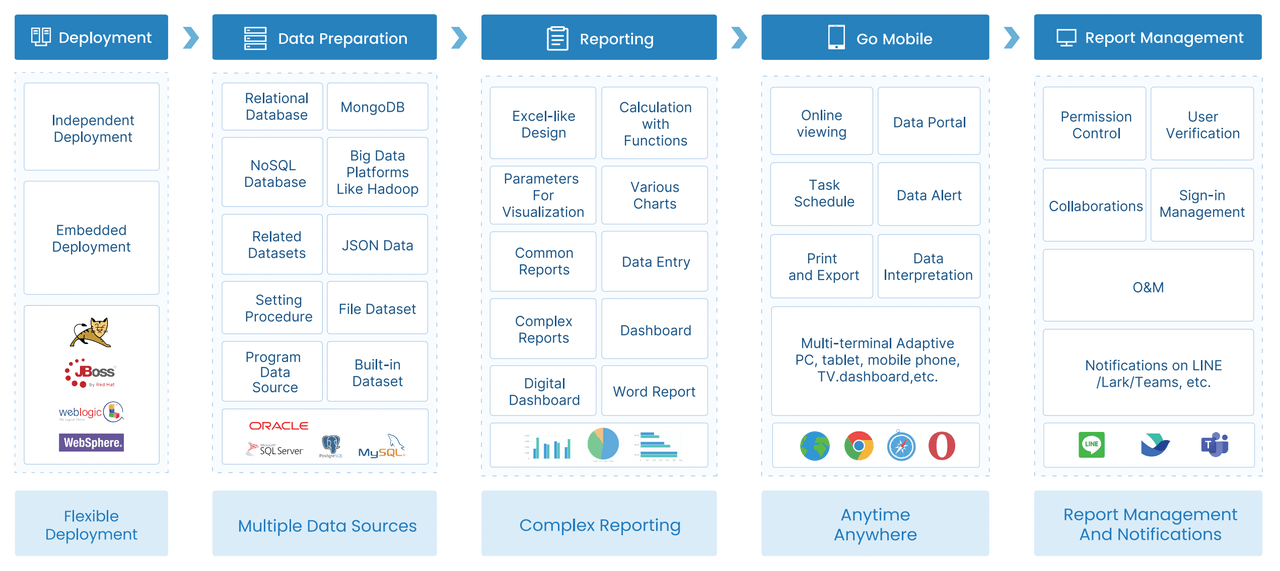
Building this manually is complex; use FineReport to utilize ready-made templates and automate this entire workflow. For most organizations, the real challenge is not designing one inventory report example in Excel. It is maintaining a reliable reporting system across locations, users, and review cycles without constant manual rework.
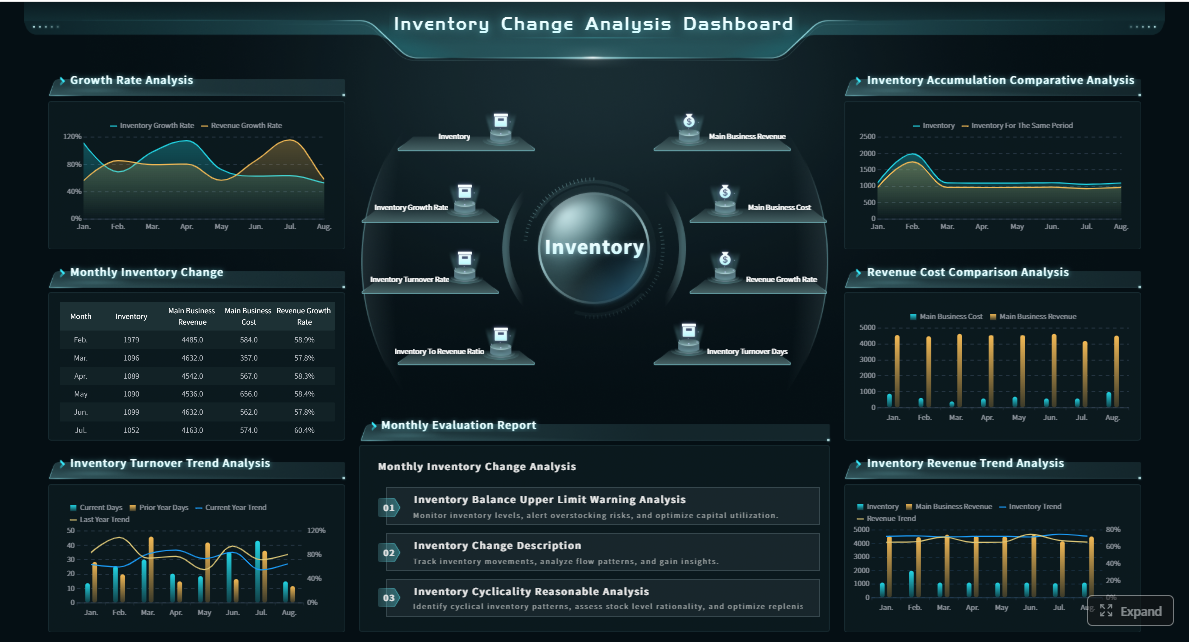
FineReport helps operations teams turn inventory data into actionable dashboards and recurring reports by enabling:
Conditional formatting for stock alerts and exception monitoring
Drill-down views from summary KPIs to SKU-level details
Role-based dashboards for warehouse managers, procurement teams, and executives
Scheduled report distribution for weekly and daily inventory reviews
With FineReport, you can build a reporting environment that combines stock visibility, variance analysis, and reorder decision support in one place. That means fewer spreadsheet errors, faster review cycles, and more consistent replenishment decisions.
If your current process depends on manually merged exports, separate count sheets, and disconnected reorder lists, this is where automation starts paying off. The goal is not just prettier reporting. It is faster decisions, better stock accuracy, and fewer operational surprises.
A practical inventory report should show SKU, location, on-hand quantity, available quantity, committed stock, safety stock, variance details, reorder point, lead time, and item status. These fields help managers move from stock visibility to action quickly.
On-hand inventory is the total quantity recorded in the system, while available inventory is what can actually be used or sold after committed stock is deducted. This distinction matters because not all recorded stock is truly free to fulfill demand.
Inventory variance is found by comparing recorded quantity with the physical counted quantity. The report should also show variance value and reason notes so teams can spot shrinkage, receiving errors, or transaction issues faster.
Reorder points show the stock threshold where replenishment review should begin before service levels are affected. When combined with lead time and days of cover, they help buyers decide what to order and when.
Yes, FineReport can be used to build inventory reports and dashboards that combine stock levels, variance analysis, and reorder alerts in one view. This makes it easier for operations teams to monitor inventory and respond faster.
Product Trial
FineReport
Pixel-perfect reports · Interactive dashboards · Easy data entry · Digital twins