A kpi marketing report is not just a dashboard for the marketing team. In an enterprise environment, it is a decision-support system that helps executives, finance leaders, sales stakeholders, and regional operators understand whether marketing investment is driving measurable business results. If your reporting is fragmented, overly tactical, or disconnected from pipeline and revenue, stakeholders will struggle to trust the numbers—and budget, prioritization, and growth decisions will suffer.
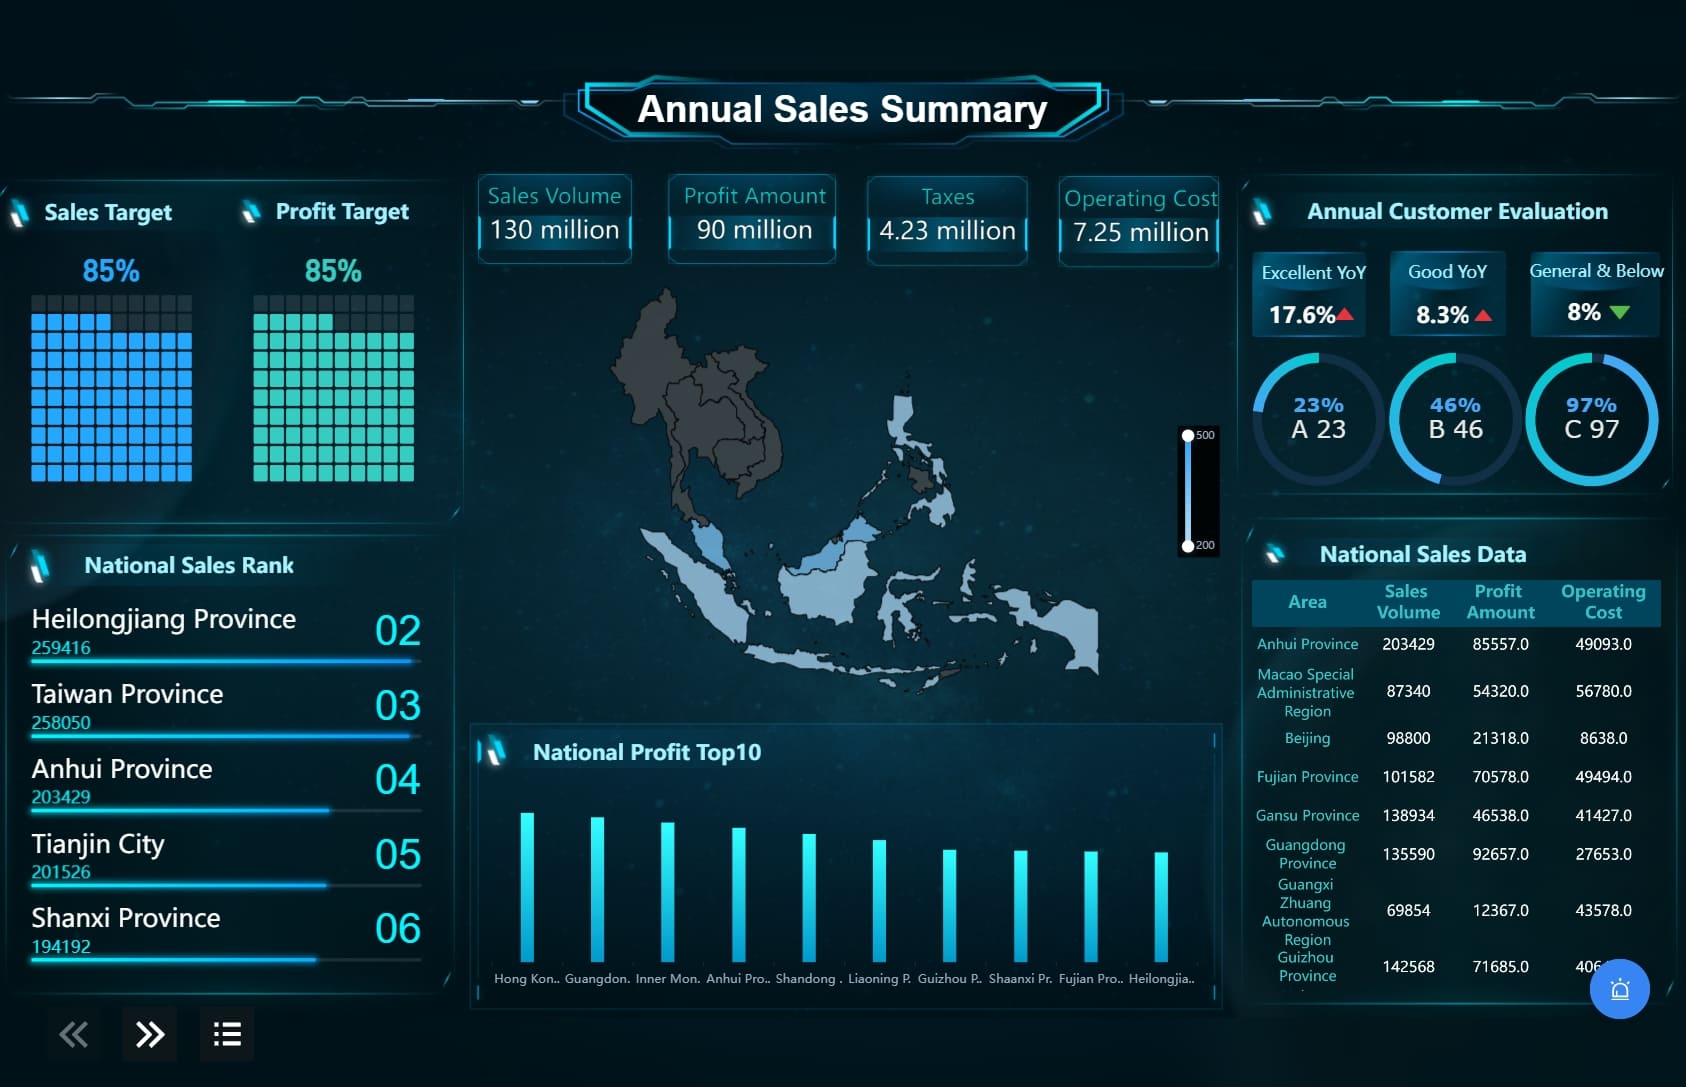
Click To Try The Dashboard
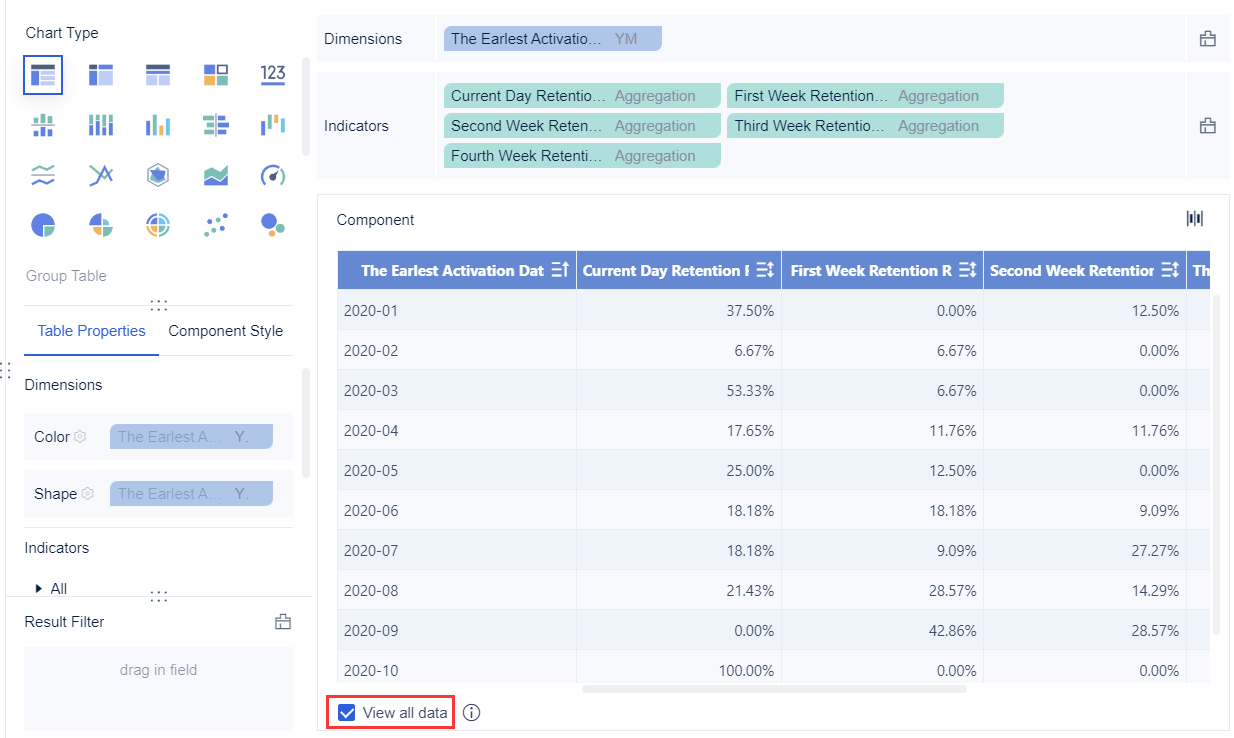
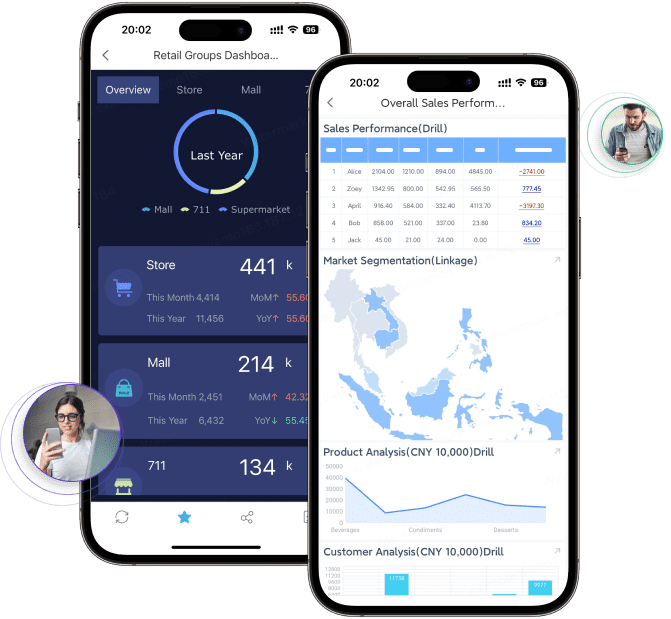
All reports in this article are built with FineReport
What an Enterprise KPI Marketing Report Should Achieve
An enterprise kpi marketing report should give leadership a clear view of marketing’s contribution to the business. That means going beyond surface metrics like clicks or leads and translating performance into business outcomes such as pipeline generation, revenue contribution, cost efficiency, and progress toward strategic goals.
For enterprise stakeholders, the report should support decisions such as:
Where to increase or reduce budget
Which channels deserve more investment
Whether pipeline creation is keeping pace with revenue targets
Where conversion bottlenecks are limiting growth
Which regions, business units, or segments need intervention
Whether marketing and sales are aligned on pipeline quality
A strong report also separates three commonly confused reporting formats:
KPI marketing report: Ongoing performance tracking tied to business goals, executive oversight, and cross-functional decisions
Campaign performance snapshot: Short-term analysis of a specific campaign, launch, or initiative
Full marketing review: Broader strategic review covering performance, insights, experiments, planning, and recommendations over a longer period
The difference matters. Enterprise stakeholders do not need every tactical detail in their regular reporting view. They need a concise, reliable system that reveals what changed, why it matters, and what action should happen next.
Core Metrics to Include in a KPI Marketing Report
The best enterprise reports balance outcome metrics, efficiency metrics, channel diagnostics, and target tracking. They should be easy to scan but comprehensive enough to support strategic decisions.
Key Metrics (KPIs)
Below is a practical KPI framework for an enterprise kpi marketing report:
Sourced Pipeline: Pipeline value created directly from marketing-originated leads or accounts.
Influenced Pipeline: Pipeline impacted by marketing touches during the buyer journey.
Closed-Won Revenue: Revenue from deals attributed to marketing sourcing or influence.
Return on Marketing Investment (ROMI): Revenue or contribution generated relative to marketing spend.
Cost Per Lead (CPL): Total spend divided by the number of leads generated.
Cost Per Opportunity (CPO): Spend required to generate a sales-qualified opportunity.
Customer Acquisition Cost (CAC): Total acquisition cost per new customer, often across marketing and sales.
Lead-to-Opportunity Conversion Rate: Percentage of leads that convert into qualified opportunities.
Opportunity-to-Close Rate: Percentage of opportunities that become won deals.
Channel Contribution: Share of leads, pipeline, and revenue by channel.
Pacing to Target: Current performance versus expected progress toward plan.
Forecasted Outcome: Projected end-of-period result based on current trends.
Pipeline Coverage from Marketing: How much of target pipeline is being supported by marketing efforts.
Retention or Expansion Influence: Marketing contribution to renewals, upsell, or cross-sell where applicable.
Revenue and pipeline impact
Enterprise stakeholders care most about whether marketing is helping the business grow. That is why pipeline and revenue metrics should lead the report. Track:
Marketing-sourced pipeline
Marketing-influenced pipeline
Closed-won revenue
Return on marketing investment
Contribution by segment, region, or product line
These measures help stakeholders understand whether marketing activity is creating business value—not just activity volume. They also support finance conversations around budget efficiency and future allocation.
When these metrics are visible, leadership can answer critical questions quickly:
Is marketing creating enough pipeline for upcoming targets?
Which business segments are seeing the strongest return?
Is influence growing even if direct sourcing fluctuates?
Are investments translating into actual revenue outcomes?
Efficiency and conversion metrics
Outcome metrics alone are not enough. Stakeholders also need to know whether performance is becoming more or less efficient over time. This is where funnel economics become essential.
Include metrics such as:
Cost per lead
Cost per opportunity
Lead-to-MQL conversion
MQL-to-SQL conversion
Opportunity creation rate
Customer acquisition cost
These numbers show where efficiency gains or losses are happening. For example, lead volume may increase while cost per opportunity worsens, signaling poor quality acquisition. Or pipeline may remain stable while CAC rises, indicating that growth is becoming more expensive.
This section is especially valuable for marketing operations leaders, demand generation heads, and finance partners who need to understand whether spend is being translated into pipeline efficiently.
Channel and campaign performance
Enterprise reporting should also compare channel contribution in a way that is useful to both leaders and operators. Focus less on vanity metrics and more on business impact by channel.
Channels often include:
Paid search and paid social
Organic search and content
Email marketing and nurture programs
Events and webinars
Partnerships and co-marketing
Account-based marketing initiatives
Regional or field marketing programs
For each channel, compare:
Spend
Lead volume
Opportunity volume
Pipeline generated
Revenue contribution
Conversion efficiency
This allows stakeholders to identify which channels drive volume, which drive quality, and which deliver the best downstream impact.
A mature kpi marketing report should also show channel performance over time. One quarter of strong pipeline may not justify a long-term budget shift if the trend is unstable. Trend visibility improves confidence and reduces reactive decision-making.
Forecast, pacing, and targets
A report becomes far more strategic when it includes pacing and forecast logic. Enterprise stakeholders want to know not only what happened, but whether the current trajectory is enough to hit quarterly and annual goals.
Track:
Progress against quarterly targets
Current pacing versus expected pacing
Forecasted pipeline and revenue outcomes
At-risk indicators by region, business unit, or channel
Required run rate for target attainment
This helps leaders answer questions like:
Are we on track to hit pipeline targets this quarter?
Which gaps require immediate action?
Is current momentum enough, or does investment need to be adjusted?
How to Structure the Dashboard for Enterprise Stakeholders
A dashboard is only effective if stakeholders can find the right answers quickly. Enterprise reporting should be designed for layered consumption: a concise executive view first, with supporting detail below.
Start with an executive summary
The top section of the dashboard should act as a decision layer. It must be scannable in under a minute and answer the most important questions immediately.
Include:
Total pipeline created
Revenue influenced or sourced
Progress against target
Major changes versus prior period
Top risks and opportunities
Recommended action areas
Lead with business-level KPIs before channel-level data. Senior stakeholders should not have to scroll through campaign details to understand whether marketing performance is helping or hurting the business.
Organize data by funnel stage
Grouping metrics by funnel stage makes it easier to identify where breakdowns are occurring. Instead of showing disconnected charts, structure the dashboard around how demand moves through the business.
A practical enterprise funnel structure includes:
Awareness
Demand generation
Lead qualification
Opportunity creation
Pipeline acceleration
Conversion
Retention or expansion where relevant
This structure allows stakeholders to spot performance patterns faster. For example, awareness may be healthy while opportunity conversion weakens, suggesting a downstream sales alignment issue rather than a top-of-funnel shortage.
Separate strategic signals from operational detail
One of the most common reporting failures is mixing executive insights with tactical diagnostics. Enterprise dashboards work best when they separate strategic signals from detailed operational analysis.
Use the main dashboard for:
Trends
Targets
Variances
Business outcomes
Risks
Recommendations
Move detailed diagnostics into lower sections, tabs, or appendices, such as:
Campaign-level performance
Creative performance
Ad set diagnostics
Regional drill-downs
Lead source detail
Data quality notes
This structure serves both executives and operators without overwhelming either group.
Reporting Workflow: When to Report and Who Owns Each Update
A good report is not just about content. It also depends on cadence, ownership, and process discipline. Without a repeatable workflow, reporting becomes inconsistent, delayed, and vulnerable to credibility issues.
Choose the right reporting cadence
Different stakeholders need different reporting rhythms. A single cadence rarely works for all audiences.
A practical model is:
Weekly updates for active monitoring, pacing checks, and in-flight issue detection
Monthly reports for trend analysis, efficiency review, and budget performance
Quarterly reviews for strategic decisions, budget reallocation, and executive planning
The cadence should match planning cycles. Weekly reporting is useful for operational teams, but executives often need monthly and quarterly views that focus on business impact and strategic changes.
The fastest way to lose stakeholder trust is inconsistent data. Every enterprise kpi marketing report should define who owns each part of the process and which source systems are authoritative.
Standardize metric definitions across teams, regions, and reporting periods. A “lead,” “qualified opportunity,” or “marketing-sourced pipeline” should mean the same thing everywhere the report is used.
Build a repeatable review process
The most effective enterprise teams document reporting workflows so that reporting is consistent and scalable.
A repeatable process often includes these steps:
Refresh data from core systems on a fixed schedule.
Validate metric accuracy and investigate anomalies.
Update dashboard views and benchmarks.
Add commentary explaining key changes, drivers, and risks.
Distribute the report to stakeholder groups with tailored summaries.
Capture decisions, follow-up actions, and next reporting priorities.
This approach reduces last-minute scrambling and improves confidence in the report.
Common Reporting Mistakes and How to Avoid Them
Even sophisticated organizations make reporting mistakes that reduce trust and weaken decision quality. The most common issues are avoidable if the dashboard is built with stakeholder needs in mind.
Reporting too many metrics without business relevance
A crowded dashboard does not create clarity. If every available metric is shown, decision-makers will struggle to identify what matters.
Best practice: Prioritize metrics tied directly to decisions, targets, efficiency, and business outcomes.
Mixing inconsistent definitions across teams or platforms
When one region defines pipeline differently from another, executive reporting becomes unreliable.
Best practice: Establish a shared metric dictionary and standard calculation rules across CRM, marketing, and finance systems.
Presenting data without context
A number alone is rarely useful. Stakeholders need comparison points.
Best practice: Always show period-over-period change, target variance, benchmarks, and commentary explaining major movements.
Failing to recommend actions
A report that stops at observation forces stakeholders to do the interpretation themselves.
Best practice: Include a short “what this means” and “what should happen next” section in every report.
How to Turn the Report Into Actionable Stakeholder Communication
The dashboard is only part of the job. Enterprise stakeholders also need interpretation and direction. A strong kpi marketing report should answer three questions clearly:
What changed?
Why did it change?
What should happen next?
That means every reporting cycle should include a concise narrative summary, not just visuals. Tailor the emphasis by stakeholder group:
Best Practices for Building a High-Trust KPI Marketing Report
If I were advising an enterprise marketing operations or revenue team, I would recommend the following approach.
1. Start with decision requirements, not dashboard widgets
Before building the report, identify which decisions it must support. Ask:
What questions do executives ask every month?
What budget decisions depend on this report?
What does sales leadership need to know to act?
This prevents the dashboard from becoming a collection of charts with no strategic value.
2. Build metric definitions before building visuals
Lock the business logic first. Define attribution rules, funnel stages, target formulas, and ownership before designing the layout.
This avoids a common enterprise trap: a visually polished dashboard that no one fully trusts.
3. Use a tiered layout for different audiences
Create one top-level executive summary and allow drill-downs into channel, campaign, region, or team-level detail. This keeps the dashboard useful across stakeholder groups without creating clutter.
4. Pair every KPI section with commentary
A dashboard should not force leaders to interpret changes alone. Add short insight summaries beside major KPI blocks to explain movement, risk, and likely causes.
5. Make the process repeatable and automated
If reporting depends on manual exports, spreadsheet stitching, and last-minute formatting, it will eventually fail at scale. Use automation wherever possible for data refreshes, calculations, alerts, and distribution.
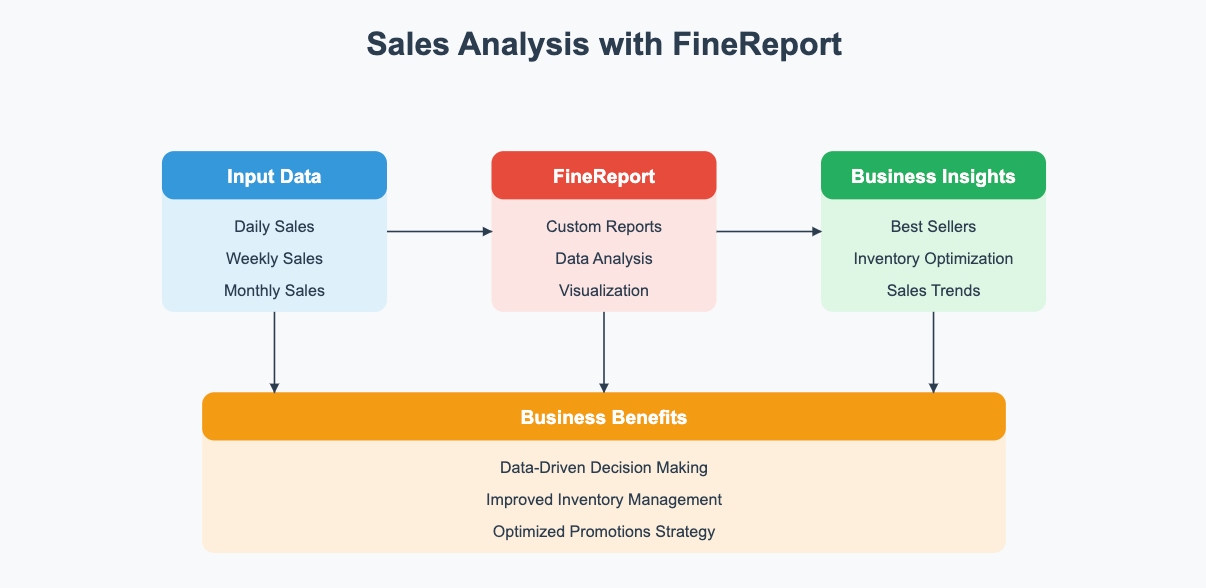
Build the KPI Marketing Report Faster with FineReport
Building this manually is complex; use FineReport to utilize ready-made templates and automate this entire workflow.
For enterprise teams, the challenge is rarely knowing which metrics matter. The challenge is bringing together CRM data, campaign performance, pipeline attribution, financial targets, and stakeholder-ready visuals in a reliable, repeatable format. Manual reporting creates delays, inconsistencies, and heavy operational overhead.
Standardize metric definitions across teams and regions
Automate refresh schedules and recurring reporting workflows
Create drill-down views for executives, finance, sales, and operations
Use ready-made templates to accelerate deployment
With the right reporting structure, your kpi marketing report becomes more than a status update. It becomes a management tool that improves prioritization, budget decisions, and accountability across the revenue engine.
If your current reporting process is spreadsheet-heavy, slow to update, or difficult for stakeholders to trust, this is the moment to modernize it. Enterprise marketing teams need a reporting system that is accurate, scalable, and decision-oriented.
An enterprise KPI marketing report should include pipeline, revenue impact, conversion rates, acquisition costs, channel contribution, and pacing to target. The goal is to connect marketing activity to business outcomes leaders can act on.
A KPI marketing report tracks ongoing performance against business goals, while a campaign report focuses on a specific initiative over a shorter period. Enterprise stakeholders usually need the broader KPI view for decision-making.
The most important KPIs are typically sourced pipeline, influenced pipeline, closed-won revenue, ROMI, CAC, and forecasted performance against targets. These metrics show whether marketing investment is driving efficient growth.
Most enterprise teams report core KPIs monthly, with lighter weekly checks for pacing and quarterly reviews for deeper strategic analysis. The right cadence depends on sales cycle length, reporting needs, and stakeholder expectations.
Tying reporting to pipeline and revenue helps stakeholders see whether marketing is contributing to real business performance instead of just activity volume. It also improves trust in the numbers and supports better budget and growth decisions.
Product Trial
FineReport
Pixel-perfect reports · Interactive dashboards · Easy data entry · Digital twins