You need a quality dashboard to find important information in your manufacturing data. With real-time monitoring, you can spot problems right away and stop expensive mistakes. Changing from raw data to a useful dashboard helps quality and customer experience get better fast. The results are easy to see:
| Benefit | Description |
|---|---|
| Proactive Quality Management | Lets organizations move from fixing problems after they happen to stopping them before, making things work better. |
| Reduced Response Times | Cuts down the time it takes to react from hours or days to just minutes, so you lose less. |
| Improved Accuracy | Gets data straight from the source, so there are fewer human mistakes and reports are always the same. |
| Defect Prevention | Finds problems before they make bad products, so you spend less money on fixing mistakes. |
| ROI Improvements | Most organizations see better results in the first year after starting. |
FineBI helps you use every quality metric to make smart choices for your factory floor.
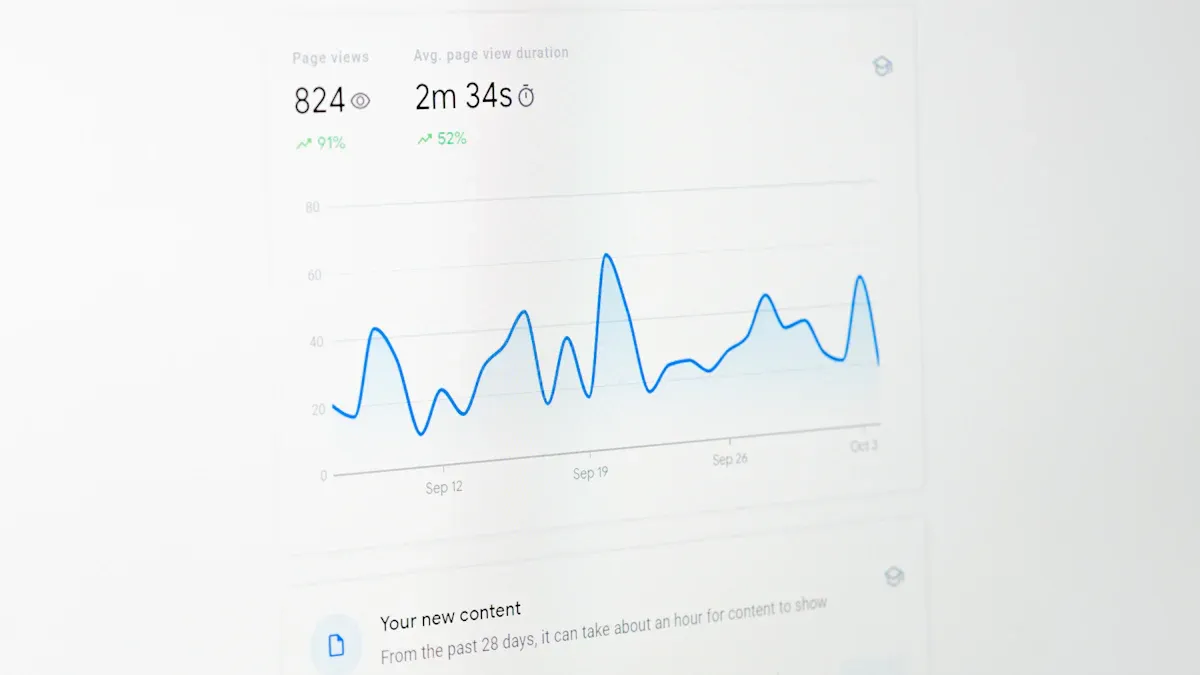
A quality dashboard shows your factory process clearly. You see numbers and trends all in one spot. This tool helps you find problems early. It helps you make better choices every day. Old reports only show what happened before. A quality monitoring dashboard works like a live control tower. You see what is happening right now. You know what steps to take next.
A quality dashboard puts many important things together. Look at the table below to see what makes a strong dashboard:
| Component | Description |
|---|---|
| Real-time data | You get updates fast, so you can act quickly. |
| Key Performance Indicators (KPIs) | You track key quality numbers, like defect rates and yield. |
| User-targeted design | Each person sees the info they need for their job. |
| Total production | You see how much you make in a certain time. |
| Defect or rejection rate | You learn how many products do not meet your standards. |
| Cycle time | You measure how long it takes to finish one cycle. |
| Trend analysis | You spot patterns over time, which helps you stop problems early. |
| Cost of quality | You see how much money you spend fixing mistakes or poor quality. |
| Defects by category | You can break down defects by type, machine, supplier, or batch. |
| Comparison against previous performance | You check if you are getting better or if problems keep coming back. |
You also get features that make your job easier:
Custom alerts and notifications are very helpful. You get messages when something goes wrong. These alerts help you fix small issues before they become big problems. They also keep a record of what happened. This helps during audits.
A quality monitoring dashboard gives your factory many advantages. You can see the benefits in the table below:
| Metric | Description |
|---|---|
| Total Yield | You compare all products made to those that pass the first time. |
| Customer Return Rate | You track how often customers send products back because of quality issues. |
| Quality of Incoming Materials | You check the quality of parts or materials from suppliers. |
You can also:
A quality dashboard helps you see problems as soon as they happen. You can fix them right away. This tool connects quality performance to your daily work. You do not wait for a report at the end of the week. You see trends and changes in real time. This means you can keep your products consistent and your customers happy.
A company used a real-time quality monitoring dashboard and saw big changes. Operators could see live data on their screens. They found quality issues early and worked together to solve them. This led to better products and less waste.
A quality monitoring dashboard helps you stop problems before they grow. You catch issues early. This keeps your production line running smoothly and saves money.
If you want to make your factory better, you need a data quality dashboard that everyone can use. FineBI gives you tools to build dashboards. These dashboards help you find problems, fix them quickly, and keep your factory running well. You can connect all your data. You can watch for issues as they happen. The right people see the right information.
You might have data in many places. FineBI lets you put all your data together in one dashboard. You do not have to worry about missing information. You do not need to switch between different systems. FineBI connects to many kinds of data sources. You always see everything you need.
| Data Source Type | Description |
|---|---|
| Big Data Platforms | Connects with over 30 big data platforms |
| SQL Data Sources | Integrates with various SQL databases |
| Excel File Datasets | Allows access to Excel file datasets |
| Multi-dimensional Databases | Accessible through FineReport Designer |
| Program Datasets | Also supported via FineReport Designer |
You can see all your quality numbers in one spot. FineBI gives you real-time analytics. This means you get updates right away when something changes. You do not have to wait for reports. You can act fast.
A data quality dashboard with real-time analytics helps you stop problems before they happen. You can keep your factory safe and working well.
Every factory is not the same. FineBI lets you build dashboards that fit your needs. You can pick what to show and how to show it. You can use charts, tables, and maps to make your data easy to see.
You can track key quality numbers like defect rates, yield, and cycle time. You can break down problems by machine, supplier, or batch. The dashboard lets you see trends over time. You can spot patterns and make better choices.
You can change the look and layout of your dashboard anytime. This helps you and your team see what matters most. A good data quality dashboard makes it easy to find answers and take action.
You want to keep your data safe. You want everyone to see the right information. FineBI gives you strong security features. You can control who sees each dashboard. You can control what data they can access.
| Security Feature | Description |
|---|---|
| Role-based access control | Only lets authorized users see certain data |
| Row-level security | Limits access to specific rows of data |
| Single sign-on integration | Makes logging in easy and secure |
| Audit logging feature | Tracks who looks at or changes the dashboard |
You can set up dashboards for different roles. Managers can see big trends. Operators see details for their machines. This keeps everyone focused on their job.
FineBI helps teams work together. You can share dashboards. You can leave comments. You can update information as a group. This makes it easier to solve problems and improve quality together.
A data quality dashboard with role-based access and collaboration tools helps you protect your data. It helps you get the right insights to the right people. You build trust and teamwork across your factory.
A strong data quality dashboard from FineBI helps you connect your data. You can see problems as they happen. You can work together to keep your products at their best.
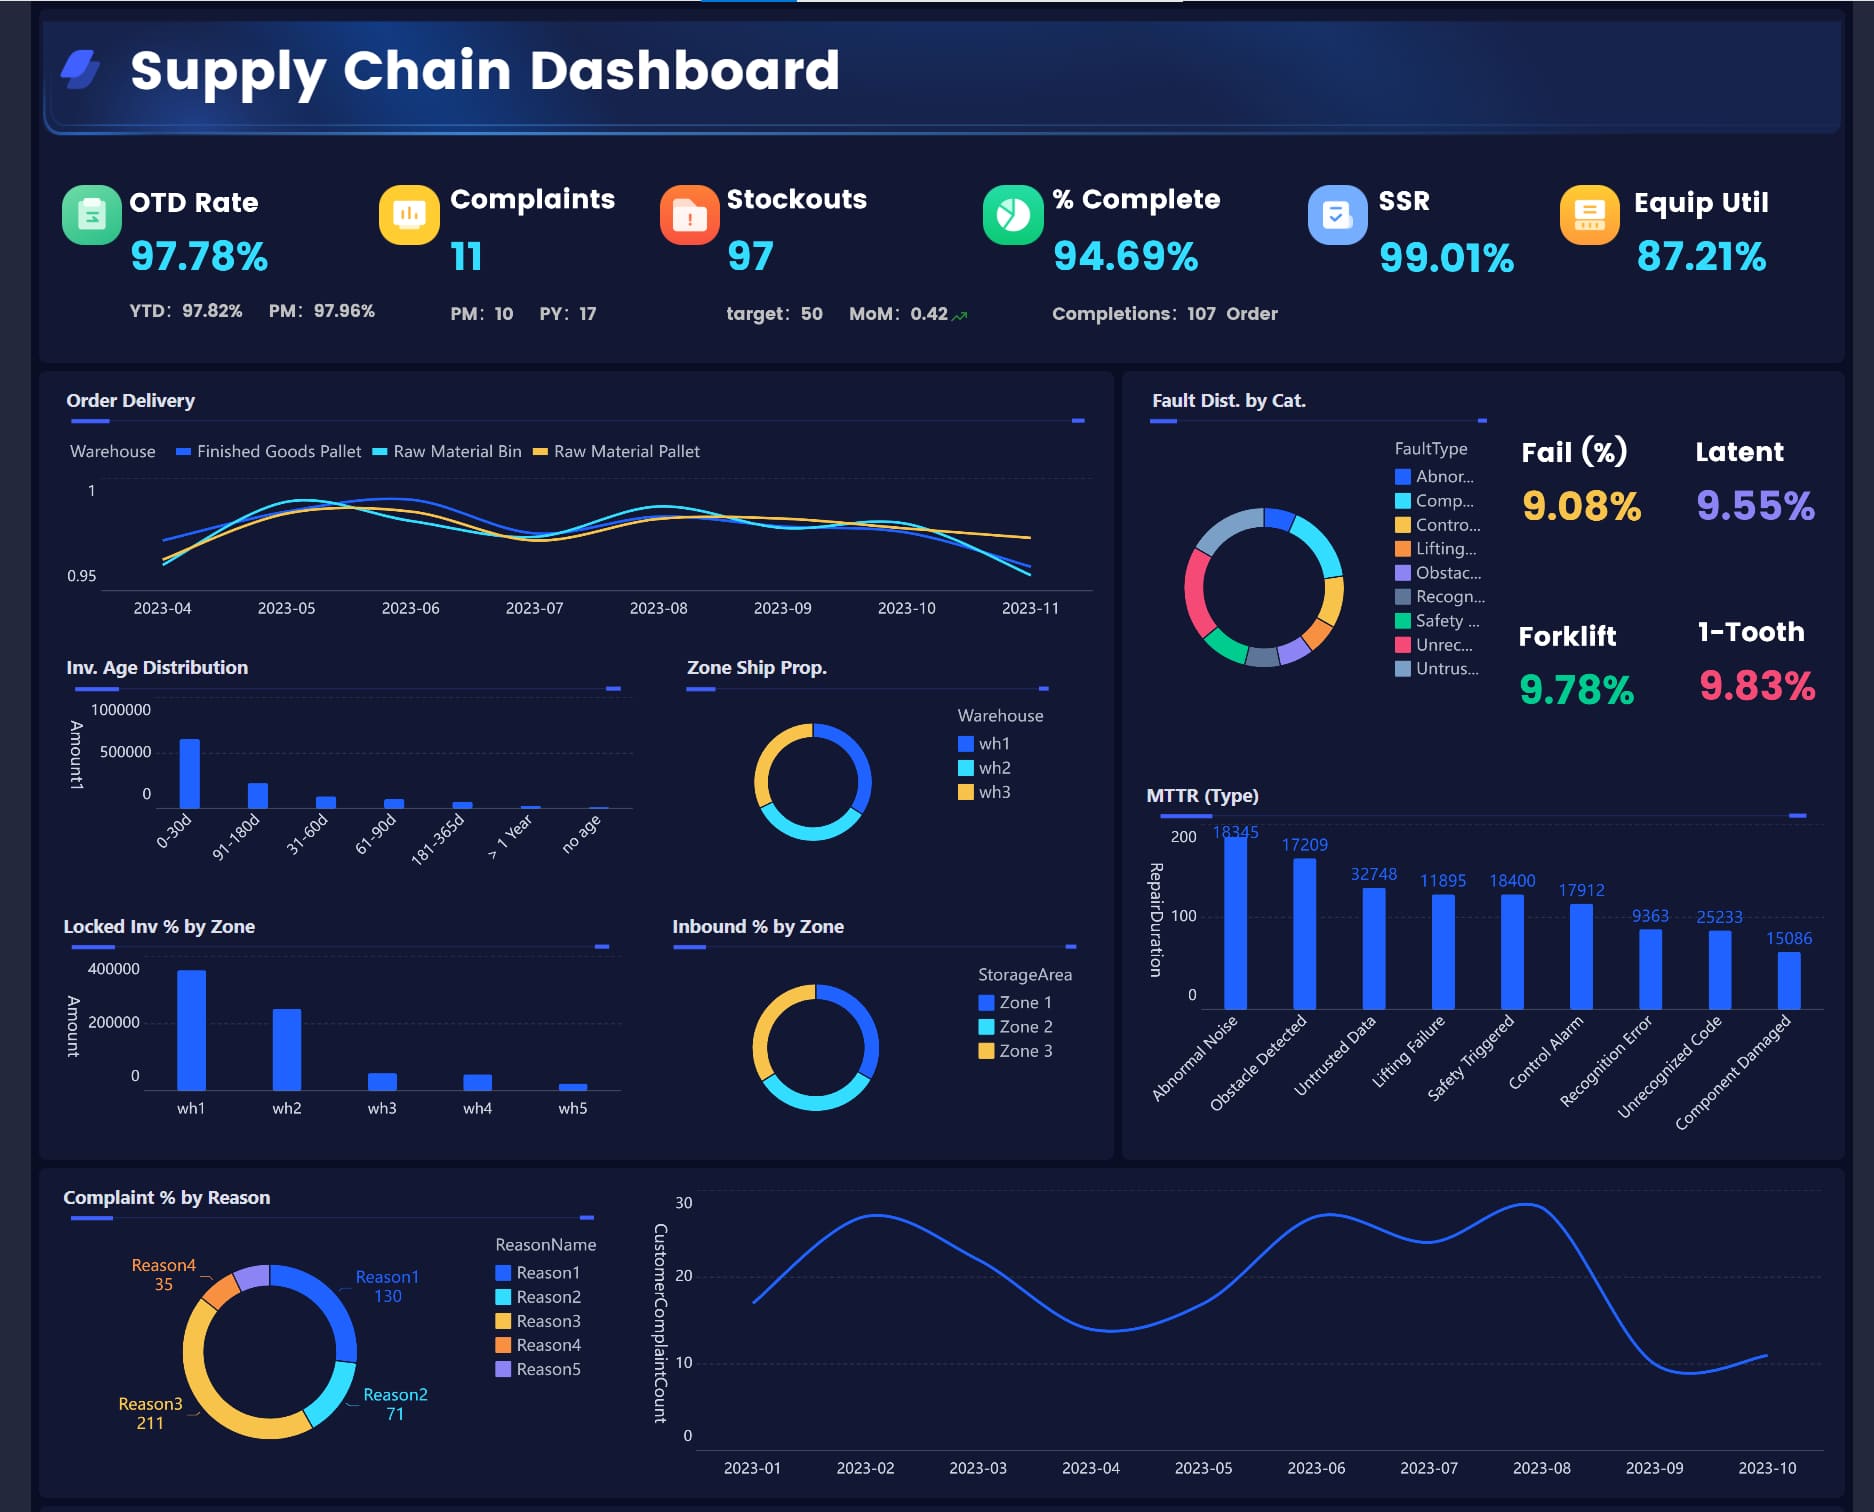
You need to watch over your factory to guide it well. Executive dashboards help you see quality monitoring in every department. These dashboards turn raw data into actions you can take. You get all the important facts in one spot. This helps you make choices that boost efficiency, quality, and how you use resources.
Managers and teams must act fast when quality monitoring issues come up. Operational dashboards give you alerts right away if something is wrong. You see production status and problems as they happen. This helps you act quickly and keep things running well.
The most watched KPIs on operational dashboards for quality monitoring are:
| KPI | Description |
|---|---|
| First Pass Yield | Measures the percent of products made right the first time, with no rework needed. |
| Scrap Rate | Tracks how much output is thrown away due to defects. This helps you find root causes. |
| Throughput | Shows how many quality products you make in a set time. This tells you about your production power. |
| Cycle Time | Captures the total time to make one unit. This helps you find slow spots in your process. |
| Cost per Unit | Tells you how much it costs to make each product. This is key for running a successful operation. |
You use operational dashboards to keep quality monitoring at the center of your daily work. You respond to problems fast, keep your team updated, and make sure your products are good. This helps you build a strong and reliable factory.
You can build a strong quality system by following easy steps. FanRuan and FineBI help make this simple for your factory. Here is a way that works well:
You want your team to use dashboards easily. If a dashboard is hard to use, it will not help. You should make dashboards simple and clear.
Training is very important. You should show your team how to use the dashboard and answer alerts. Keep training so everyone knows what to do.
| Training Component | Objective |
|---|---|
| Dashboard Navigation | Help staff learn to use the dashboard easily |
| Data Interpretation | Teach staff to read and understand the data |
| Response Protocols | Set clear steps for what to do when alerts show up |
Good training helps your team use new tools. It also helps people stay interested and makes sure the dashboard fits their work. When you train your team, you help them use data to make quality better every day.
Factories are changing how they use technology to get better quality. AI and predictive analytics help you find problems before they start. These tools check data from machines and processes. They spot patterns that people might not see. If something strange happens, the system sends an alert right away. You can fix small issues before they become big ones.
AI-driven dashboards do more than just show numbers. They help you get ready for the future. For example, you can guess when a machine needs fixing or when a batch might not pass. This helps you stop downtime and waste. Some companies, like BMW, use predictive analytics to check quality as things are made. Their systems use cameras and sensors to watch every step. If something is wrong, the dashboard shows it before the product leaves.
You can see the benefits in the table below:
| Improvement Type | Description |
|---|---|
| Defect reduction rates | Fewer defects in finished products |
| First-pass yield improvements | More products pass on the first try |
| Scrap reduction | Less wasted material |
| Customer complaint decreases | Fewer complaints from customers |
| Analysis speed improvements | Faster data analysis |
| Prediction accuracy rates | More accurate forecasts |
| System utilization levels | Better use of equipment |
| User adoption rates | More people use the system |
| Cost savings from prevented issues | Money saved by avoiding problems |
| ROI on analytics implementation | Better returns on your investment |
| Reduced quality control costs | Lower costs for checking quality |
| Improved resource allocation | Smarter use of resources |
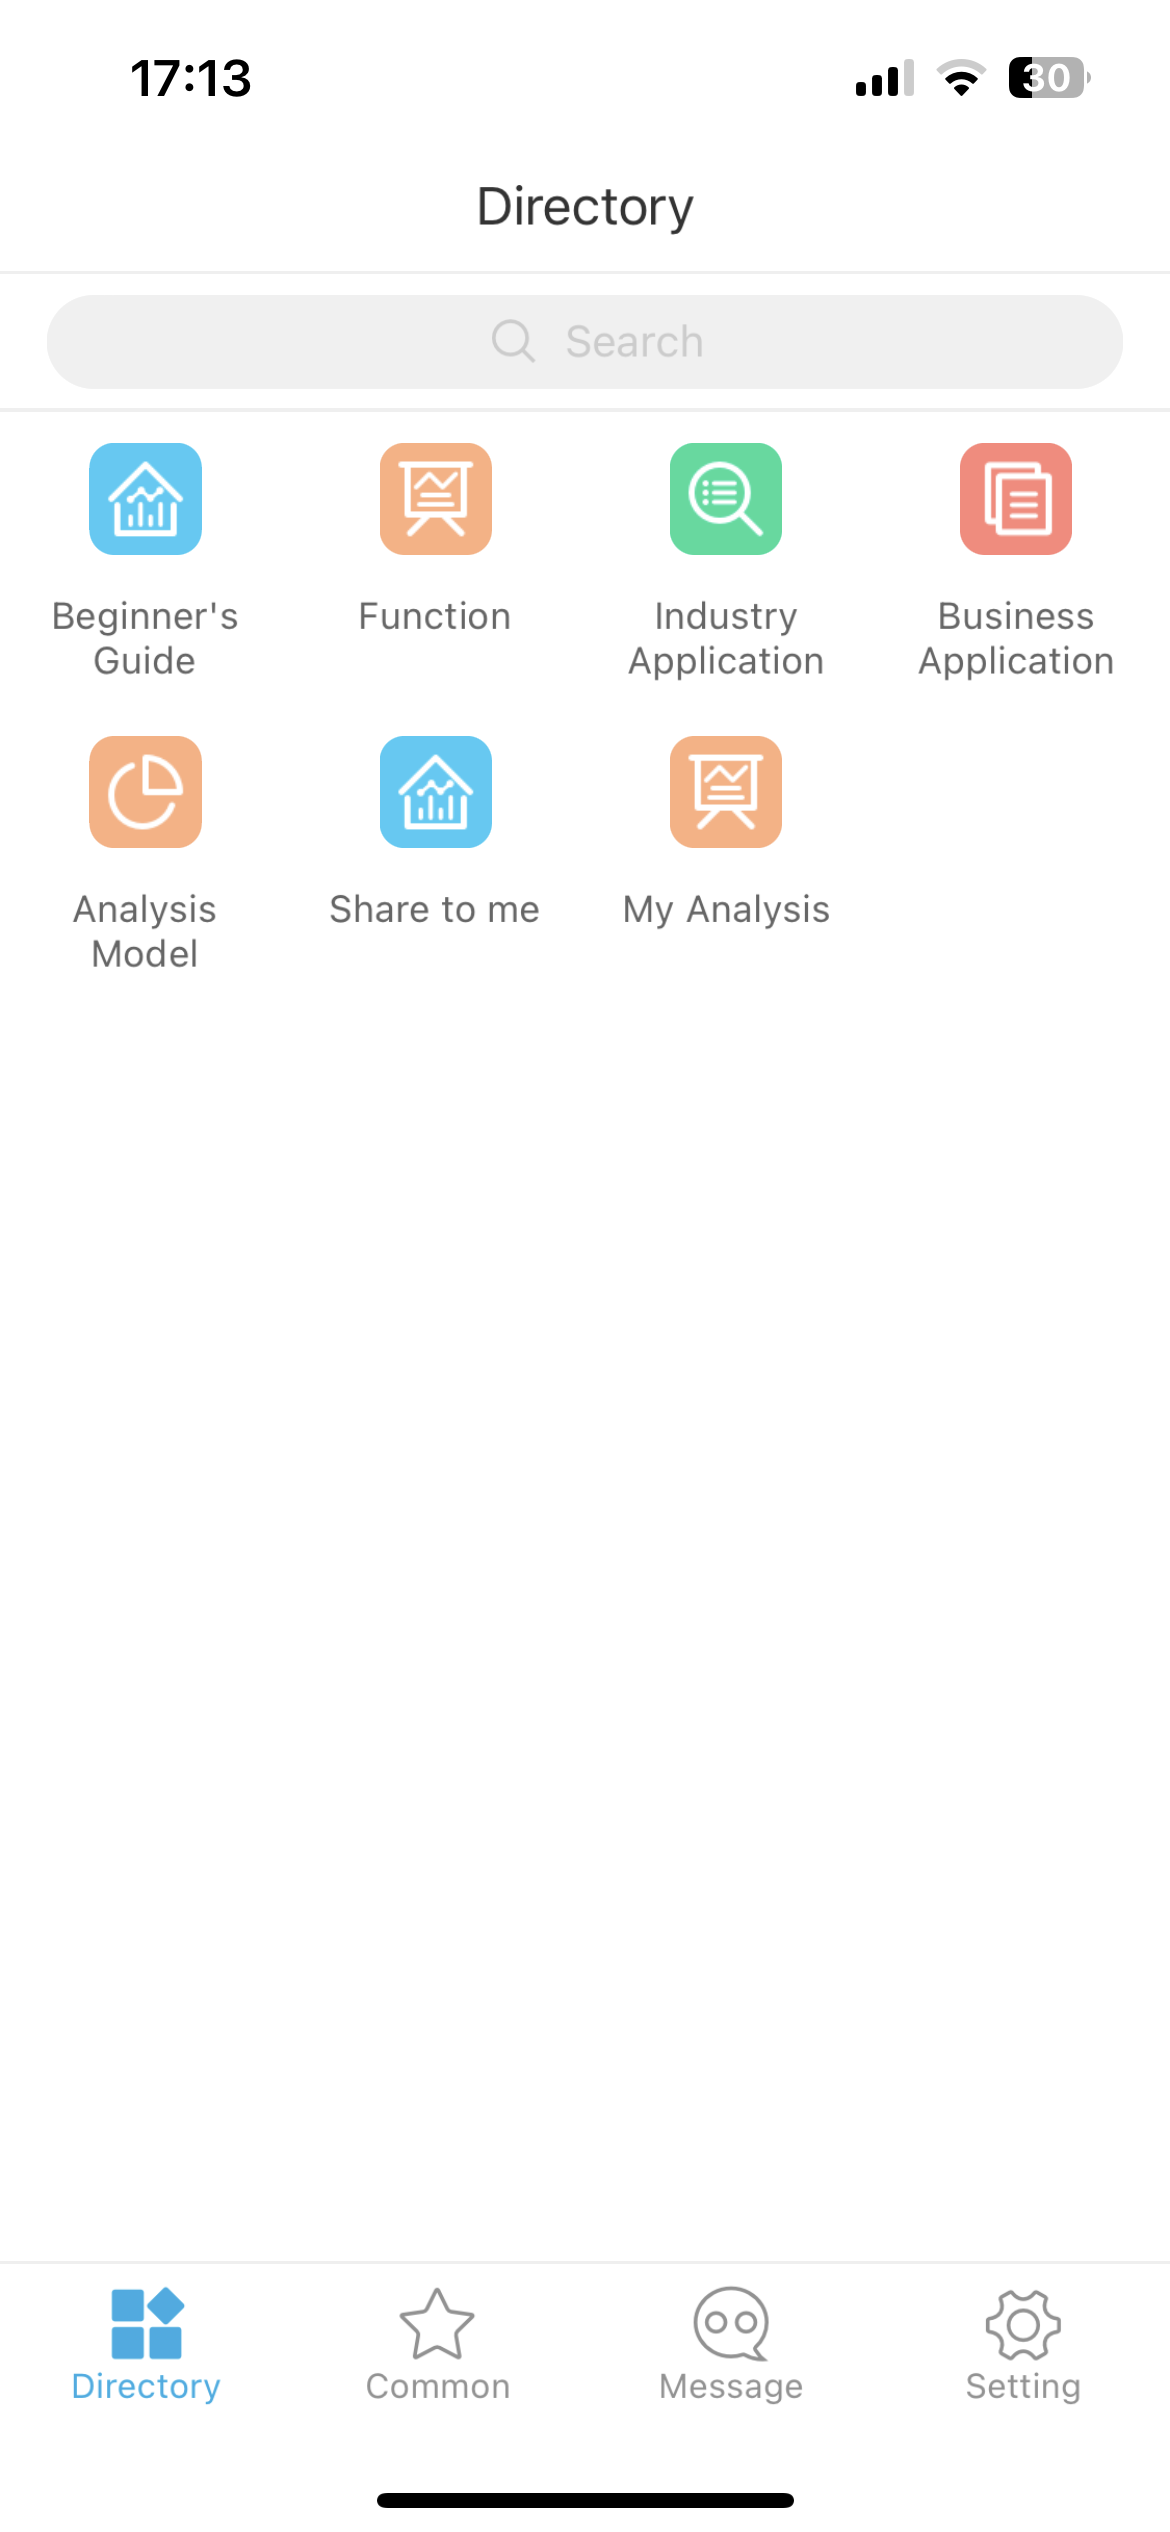
You need to check your factory even when you are not there. Mobile access lets you see live data and alerts anywhere. If a number goes outside the safe range, your phone or tablet shows a warning. You can act fast and do not have to wait for a call or email.
This new way helps your team fix problems quickly. Operators see issues right away and solve them before they get worse. Managers can check progress from any place. Everyone works better together because they all see the same data at the same time.
You can make your factory better by using FineBI from FanRuan. Real-time monitoring helps you see problems right away. Actionable insights help you make good choices every day. The table below shows how real-time data and digital tools help quality and decision-making:
| Key Findings | Description |
|---|---|
| Real-time quality control | Lets you fix problems fast and get better results. |
| AI decision-support system | Makes your team quicker and more ready to act. |
| Process optimization | Helps you reach your goals for performance. |
| Quality improvement | Raises product standards and makes customers happier. |
You create a data-driven culture and get helpful insights. This keeps your factory strong and competitive.


The Author
Lewis Chou
Senior Data Analyst at FanRuan
Related Articles

10 Customer Intelligence Dashboard Tools Compared: Features, Pros, Cons & Best-Fit Teams
Compare 10 customer intelligence dashboard tools. See features, pros, cons, and which teams each tool is best for, from B2B to enterprise analytics.
Saber Chen
Apr 28, 2026

9 Open Source Metrics Dashboard Tools Compared for 2026: Which One Fits Your Team Best?
Compare Grafana, Metabase, Apache Superset, Redash, and Prometheus for metrics dashboards. Find the best open source tool for your team.
Lewis Chou
Apr 28, 2026

Chowbus Dashboard Guide: 7 Ways to Monitor Delivery Operations in Real Time
Learn 7 ways to use the Chowbus dashboard for real-time delivery monitoring. Track orders, drivers, and KPIs to improve on-time performance and operations.
Lewis Chou
Apr 28, 2026


