You can make a helpful software development dashboard by setting clear goals. Use metrics that your team can act on. Make sure your dashboard connects well with other tools. Start by picking metrics that show how often you deploy and how long cycles take. Tools like FineReport by FanRuan help link data sources. They let you build dashboards your team can use fast. When you design your dashboard, think about your team’s work steps and what data they need. This helps your dashboard give real value.
First, you need to know why you want a software development dashboard. Think about what your team wants to do. Teams use dashboards to get better at their work. Dashboards help teams make smart choices and see how close they are to their goals. They also let everyone check the status of projects and tasks. If you set clear goals, your team will want to use the dashboard every day.
These goals help you pay attention to what matters most for your team.
Next, pick key metrics that fit your team’s goals. These metrics show how well your team works and where you can do better. Many teams use dora metrics like deployment frequency, lead time for changes, change failure rate, and time to restore service. These numbers show how often you release software, how fast you fix things, and how steady your process is. You can also check bug rates, cycle time, and story points finished. When you choose the right metrics, your dashboard shows what is really happening in your work.
You also need to think about what your stakeholders want. Stakeholders can be managers, team leads, or customers. Each group cares about different things. Some want to see big progress, while others want to check certain tasks. Good dashboards help managers watch how people do their jobs and connect team work to company goals. To do this well, talk with your stakeholders and ask what they want to see. Grouping stakeholders by their job or power can help you decide what to show. This way, your dashboard helps everyone and makes your team do well.
To build a good software development dashboard, you need to gather data from many tools. Your team uses Git for code. Jira helps track tasks. CI/CD pipelines handle deployments. Each tool has important details about your work. When you connect these tools, you see everything your dev team does.
Here are some best ways to connect your data:
These steps help your developer productivity dashboard show the right progress and status. Your team can spot problems early and fix them fast.
Many teams have trouble with data silos. Data silos happen when information stays locked in one tool or department. This makes it hard to see everything. You are not alone—look at these numbers:
| Source | Percentage of Organizations Experiencing Data Silos | Context |
|---|---|---|
| IBM Research | 82% | Enterprises report data silos disrupting workflows |
| Adalo.com | 81% | IT leaders say silos hinder digital transformation |
| Salesforce.com | 80% | Organizations report data silos as a concern |
FineReport by FanRuan helps break down these walls. You can collect data from many places and bring it together. FineReport connects to different databases and uses SQL to build reports. You can combine data from Git, Jira, and CI/CD tools. This gives you one platform for all your reporting and visualization needs. You can use features like data entry and parameter queries to make your developer productivity dashboard even better. With FineReport, your team gets unified data management and clearer visibility.
Collecting data by hand takes time and can cause mistakes. You want your developer experience dashboard to show real-time information. Automation fixes this problem. You can set up your dashboard to collect data from your tools without extra work.
Automated testing is a big part of this process. When you use automated tests with Continuous Integration and Test-Driven Development, your dashboard data stays correct. This cuts down manual work and speeds up your tasks. You can also use real-time data collection to track metrics like CPU, memory, and disk usage. Dynamic alerts warn you when something goes wrong. Predictive analytics help you spot problems before they happen.
Here is a quick look at common automation features:
| Feature | Description | Importance |
|---|---|---|
| Real-Time Data Collection | Gathers metrics like CPU and memory all the time | Gives instant visibility into server health |
| Dynamic Threshold Alerts | Sends alerts when metrics go above safe levels | Flags critical issues, reduces false alarms |
| Predictive Analytics | Uses past data to predict failures | Helps prevent downtime |
When you automate data collection, your engineering productivity metrics and dora metrics stay current. Your dashboard always shows the latest status. This helps your team make smart choices and keep projects on track.
You have to pick between making your own dashboard or buying one. Each choice has good and bad sides.
| Advantage | Description |
|---|---|
| Increased Control | You can make the dashboard fit your needs and control everything. |
| Cost-Effective | Building it yourself might save money if you skip license fees. |
| Control Data & Intellectual Property | You keep your data safe and own all your work. |
| Disadvantage | Description |
|---|---|
| Higher Initial Costs | Custom dashboards cost more at first. |
| Longer Development Times | Making your own takes longer and needs planning. |
| Legacy Code Risks | If team members leave, old code can cause problems. |
Buying a platform like FineReport is faster and can save money. You get a dashboard that works right away. Vendors test these tools, so there is less risk. You also get more features and updates. But you might have trouble connecting it to your other tools. You also have to pay fees to keep using it.
FineReport is a great choice for your dev team dashboard. You can make dashboards fast with drag-and-drop tools. The dashboard fits any screen, so you can see it on computers or phones. FineReport lets you use different graphs and see trends in your data. You can link charts to show reports in a set format. This makes it easy to track progress and status.
| Feature | Description |
|---|---|
| Flexible Dashboard Creation | Drag pieces to build dashboards quickly and make them look nice. |
| Intelligent Component Layout | The dashboard fits any screen, so it is easy to use. |
| Mobile Accessibility | You can check dashboards on your phone or tablet anytime. |
You want your dashboard to work with your current tools. FineReport connects to business systems like OA, CRM, and ERP. It also links with BI systems and many data sources, like relational databases. This means you can bring in metrics and other important data without extra work.
With FineReport, you see all your team’s work in one place. You can track progress, watch status, and see all your projects clearly.
You want your dashboard to show important information quickly. Group similar metrics together so they are easy to find. Put key data like engineering productivity metrics and dora metrics at the top or in the middle. Use layouts that help your eyes go to the main numbers first. Add color for meaning. Green means things are going well. Red means something needs attention. Icons help you see trends and status fast without reading a lot.
Pick the best chart for each story. Line charts show changes over time. Bar charts are good for comparing numbers. Progress bars and percentages tell you how close you are to your goals. Trend lines show if your dev team dashboard is moving in the right direction.
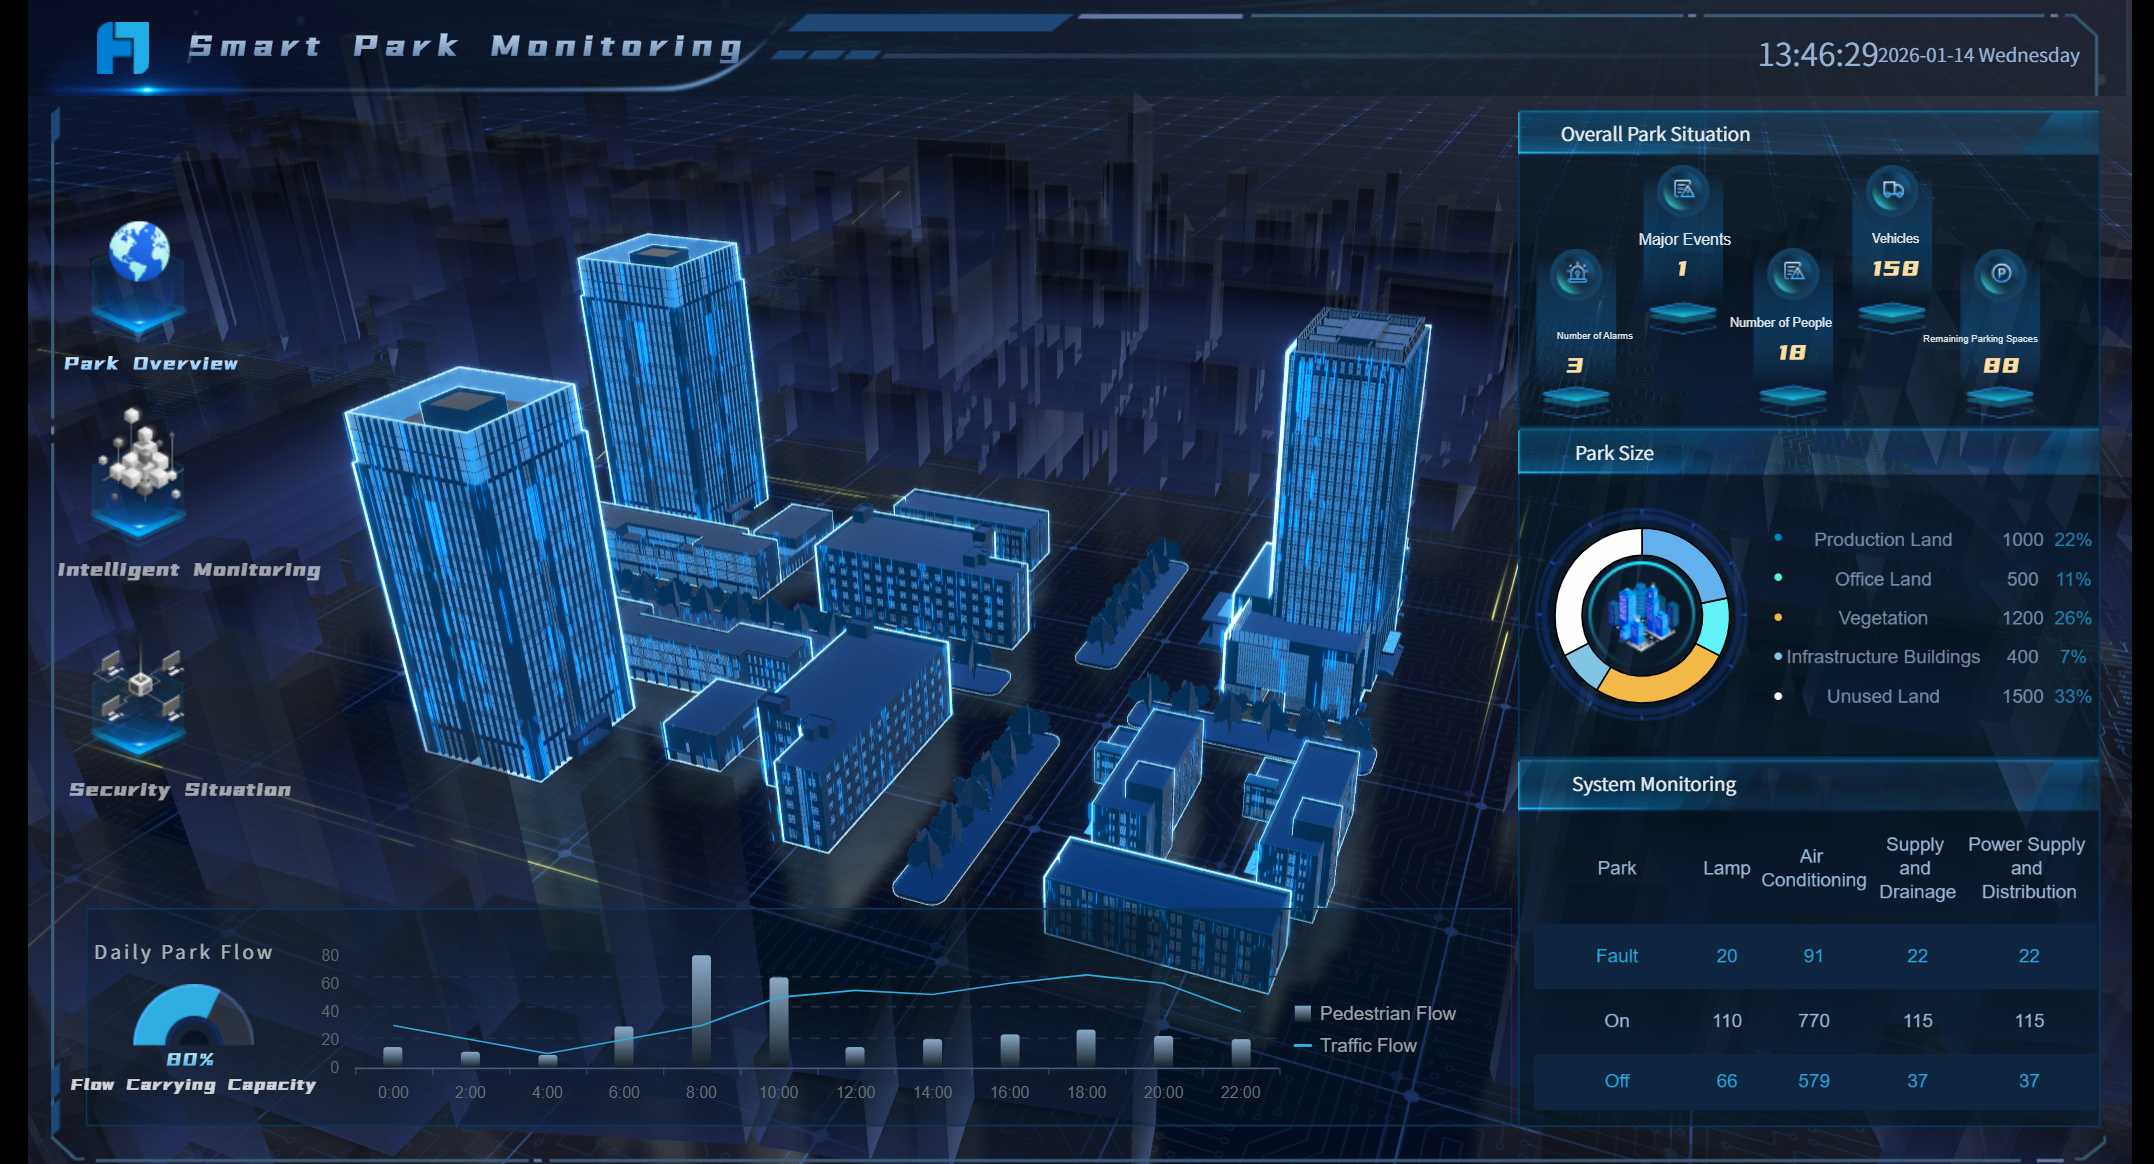
FineReport’s 3D dashboards and animations make your data look exciting. You can use 3D card animations for hard data. Custom display paths let you highlight what matters most. Dynamic visuals make your developer productivity dashboard more fun and easier to understand.
Your team needs to see dashboards anywhere. Responsive design makes your dashboard look good on any device. Group parts so the layout stays clear on phones and tablets. Test your dashboard on different screens to keep it organized.
| Strategy | Impact on User Adoption |
|---|---|
| Responsive Design | Dashboards are easy to use on any device, so more people use them. |
| Grouping Elements | Layout stays neat across devices, so users do not get lost. |
| Thorough Testing | Dashboard works well everywhere, so more people want to use it. |
FineReport lets you use dashboards on your phone or tablet. This helps remote teams stay connected and see updates in real time. It makes teamwork better and helps everyone see what is happening.
You want everyone to understand your dashboard in five seconds or less. Use usability testing to check if your dashboard is clear. Eye tracking shows where people look first. Think-aloud sessions help you find out what confuses users. Remote testing lets people try the dashboard at home.
| Method | Description | Tools Available | Example |
|---|---|---|---|
| Eye Tracking | Shows where users focus, so you can put key data in the right spot. | Tobii Pro, EyeQuant | Users look at graphics before metrics, so move numbers higher for clarity. |
| Think-Aloud Protocol | Lets users explain their thoughts, revealing unclear icons or labels. | Marvin, Lookback.io, Figma | A user hesitates at an icon, so you add a label. |
| Remote Usability Testing | Finds issues in real settings, like slow features or confusing layouts. | UserTesting, Hotjar | Users struggle with a feature needing fast Wi-Fi, so you add offline support. |
A clear dashboard helps your team track status and progress. Everyone gets the visibility they need to make smart choices.
You should share your dashboard in a way that helps your team use it fast. Show only helpful information and keep things simple. Think about what story your dashboard tells. Decide if you need a new dashboard or can just update an old one. Pick the data you want to show. Know who will use the dashboard and why. Look at other teams’ dashboards for ideas to make yours better.
Teams may not like change, have tech issues, or not talk enough. You can fix these by talking clearly, giving training, and working together with other teams.
Feedback helps you make your dashboard better. Ask for feedback often so your dashboard stays useful. Use daily meetings, sprint reviews, and retrospectives to get ideas. Change features during the sprint with backlog refinement.
| Feedback Mechanism | Frequency |
|---|---|
| Daily Standup | Every day |
| Sprint Review | End of each sprint |
| Sprint Retrospective | End of each sprint |
| Backlog Refinement | Ongoing throughout sprint |
Watch how people use the dashboard. Listen to what they say and see if they get confused. Change your dashboard based on what you learn. This keeps your dashboard easy to use and helpful.
You want your dashboard to stay helpful for a long time. Focus on metrics that help your business. Use clear charts so everyone understands the data. Make dashboards for different people who need them. Automate data collection to keep info up to date and lower mistakes. Always look for ways to make the dashboard better. Make sure your dashboard answers important questions and helps people make choices.
FineReport’s scheduling tool helps you manage dashboards well. You can set how often reports are made. Email and SMS tell users when there are updates. FTP/SFTP uploads send reports to users. Automation means less work and fewer mistakes. Easy prompts help you set up schedules.
| Feature | Contribution to Dashboard Management |
|---|---|
| User-friendly front-end prompts | Makes it easy to use task schedules. |
| Detailed frequency settings | Lets you pick exact times for reports. |
| Email and SMS notifications | Sends updates and alerts to users. |
| FTP/SFTP upload attachments | Sends special reports to users. |
| Automation of report generation | Means less manual work and more correct reports. |
Track metrics like Net Promoter Score, customer happiness, time to market, customer numbers, churn rate, and ROI. Watch dora metrics like deployment frequency and lead time for changes. Check work-in-progress and time to restore service. These numbers show how well your dashboard helps your team and business.
You can help your team do better by building a software development dashboard step by step. When you connect your data and use dora metrics, your team can see progress and find problems early.
Start now by picking a tool like FineReport by FanRuan. Choose the metrics that matter most for your team.


The Author
Lewis Chou
Senior Data Analyst at FanRuan
Related Articles
How to Build a Salesforce KPI Dashboard: Pipeline, Forecast, and Win-Rate Metrics for Revenue Leaders
Learn to build a Salesforce KPI dashboard for revenue leaders. Track pipeline coverage, forecast accuracy, and win-rate metrics to drive better decisions.
Lewis Chou
May 11, 2026

Warehouse Metrics Dashboard: A Scenario-Based Guide for Operations Directors to Turn Live KPIs Into Daily Decisions
Learn how operations directors use warehouse metrics dashboards to monitor KPIs like throughput and labor cost to improve efficiency.
Yida Yin
May 11, 2026

12 Email Marketing Dashboard Examples for Executives: KPI Views That Tie Campaigns to Pipeline and Revenue
Executives do not need another email report full of opens, clicks, and subject line winners. They need $1 examples that answer harder business questions: Which programs are creating pipeline? Which campaigns are influenc
Yida YIn
Jan 01, 1970


