A security dashboard is a visual tool that lets you monitor, analyze, and respond to security events using real-time data from multiple sources. You gain real-time visibility into threats and system health, which helps you take quick action. Dashboards have evolved to support both IT and cyber security needs across industries. FineBI gives you self-service dashboards, seamless integration, and powerful analytics for actionable insights.
Security Dashboard Overview

Definition and Purpose
A security dashboard is a visual platform that lets you monitor, analyze, and respond to security events in real time, helping you understand your organization’s security status and make informed decisions quickly.
You use a security dashboard to see threats, track incidents, and simplify complex data. This tool gives you immediate insights and helps you meet compliance standards. You can also use it to assess risks and follow up on incidents as they happen. The table below shows the main functions of a security dashboard:
| Function | Description |
|---|---|
| Real-time visibility | Gives you instant insights into your security posture so you can detect and respond to threats quickly. |
| Simplification of complex data | Shows security data in a visual way, making it easier for you to interpret and act on information. |
| Compliance aid | Helps you meet regulatory requirements by generating security reports. |
| Incident response tracking | Displays details about ongoing incidents, affected systems, and steps to fix issues. |
| Risk assessment | Highlights risks, their impacts, and ways to reduce them, so you can focus your efforts. |
Types: IT Security Dashboards and Cyber Security Dashboards
You will find two main types of dashboards in most organizations: IT security dashboards and cyber security dashboards. Each type serves a different purpose and audience.
- IT security dashboards help you monitor security events, aggregate data from many sources, and provide real-time alerts for your IT team. These dashboards focus on operational security and help you respond to incidents quickly.
- Cyber security dashboards give you a high-level view of your organization’s cybersecurity posture. Executives and security operations teams use these dashboards to track compliance, assess risks, and make strategic decisions.
The table below compares the features and use cases of both dashboard types:
| Feature/Use Case | IT Security Dashboards | Cyber Security Dashboards |
|---|---|---|
| Overview of Security Events | Shows live security events and incidents. | Offers a broad view of the cyber landscape for executives. |
| Data Aggregation | Combines data from many sources for fast detection and response. | Consolidates network logs and threat intelligence for actionable insights. |
| Real-time Monitoring | Provides continuous access to real-time data to stay ahead of threats. | Tracks incidents and alerts in real time for security operations teams. |
| Visual Representation | Turns complex data into clear, easy-to-read visuals. | Simplifies technical data for executive decision-making. |
| Alerting Mechanisms | Sends automated alerts for anomalies and threats. | Gives insights into compliance and regulatory requirements. |
| Target Audience | IT security teams focused on daily operations. | Executives and security operations teams assessing overall security posture. |
You can use platforms like FineBI to build both IT security dashboards and cyber security dashboards. FineBI lets you connect to multiple data sources, visualize security metrics, and customize dashboards for your organization’s needs. Many enterprises use dashboards to drill down into security events, investigate incidents, and evaluate their cybersecurity status.

Key Features of Security Dashboards
A security dashboard is a visual interface that lets you monitor, analyze, and respond to security threats and incidents in real time, giving you a holistic view of your organization’s cybersecurity posture.
Real-Time Monitoring and Alerts
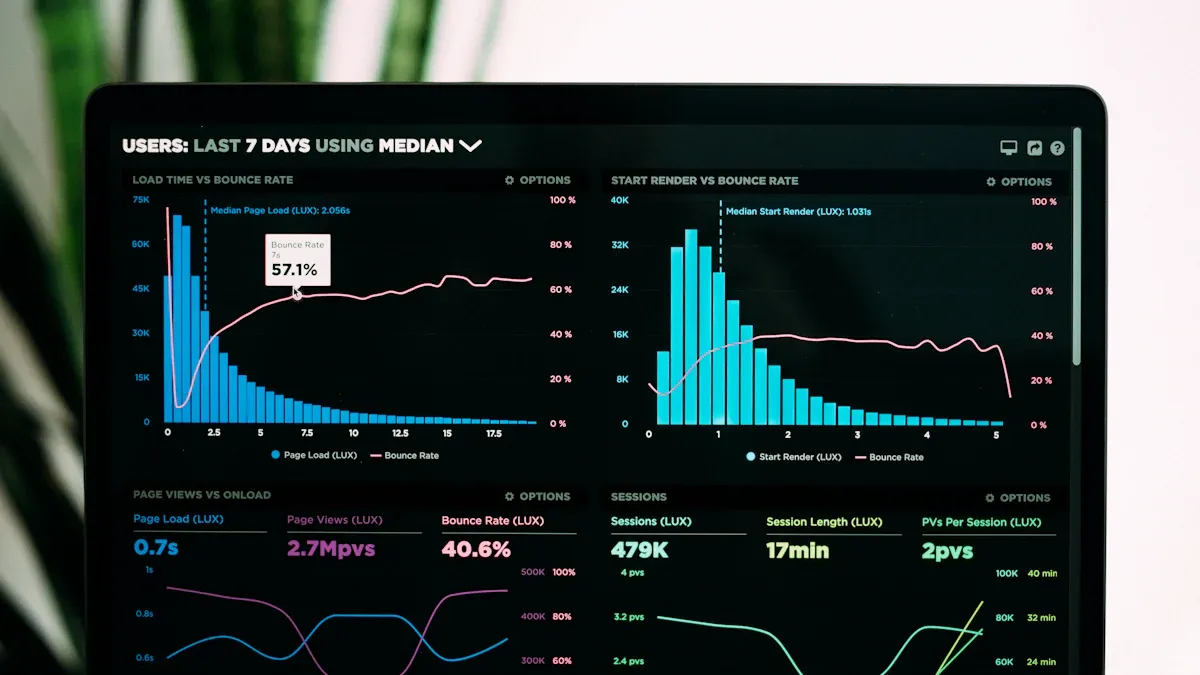
You need real-time insights to stay ahead of threats. Real-time monitoring is one of the key features of modern soc dashboards. You can track security metrics, system health, and incident detection as events unfold. Real-time visibility helps you spot threats quickly and take action before they escalate. Dashboards display live updates, showing you container activities, network connections, and process execution. You see behavioral analysis and runtime visibility, which means you can detect anomalies and respond faster. Centralized metrics improve transparency, so your team can track performance and intervene when needed. Automated alerts notify you about suspicious activity, enabling proactive threat detection and reducing incident response times.
Tip: Real-time updates in soc dashboards help you prevent minor issues from becoming major incidents.
Data Integration and Visualization with FineBI
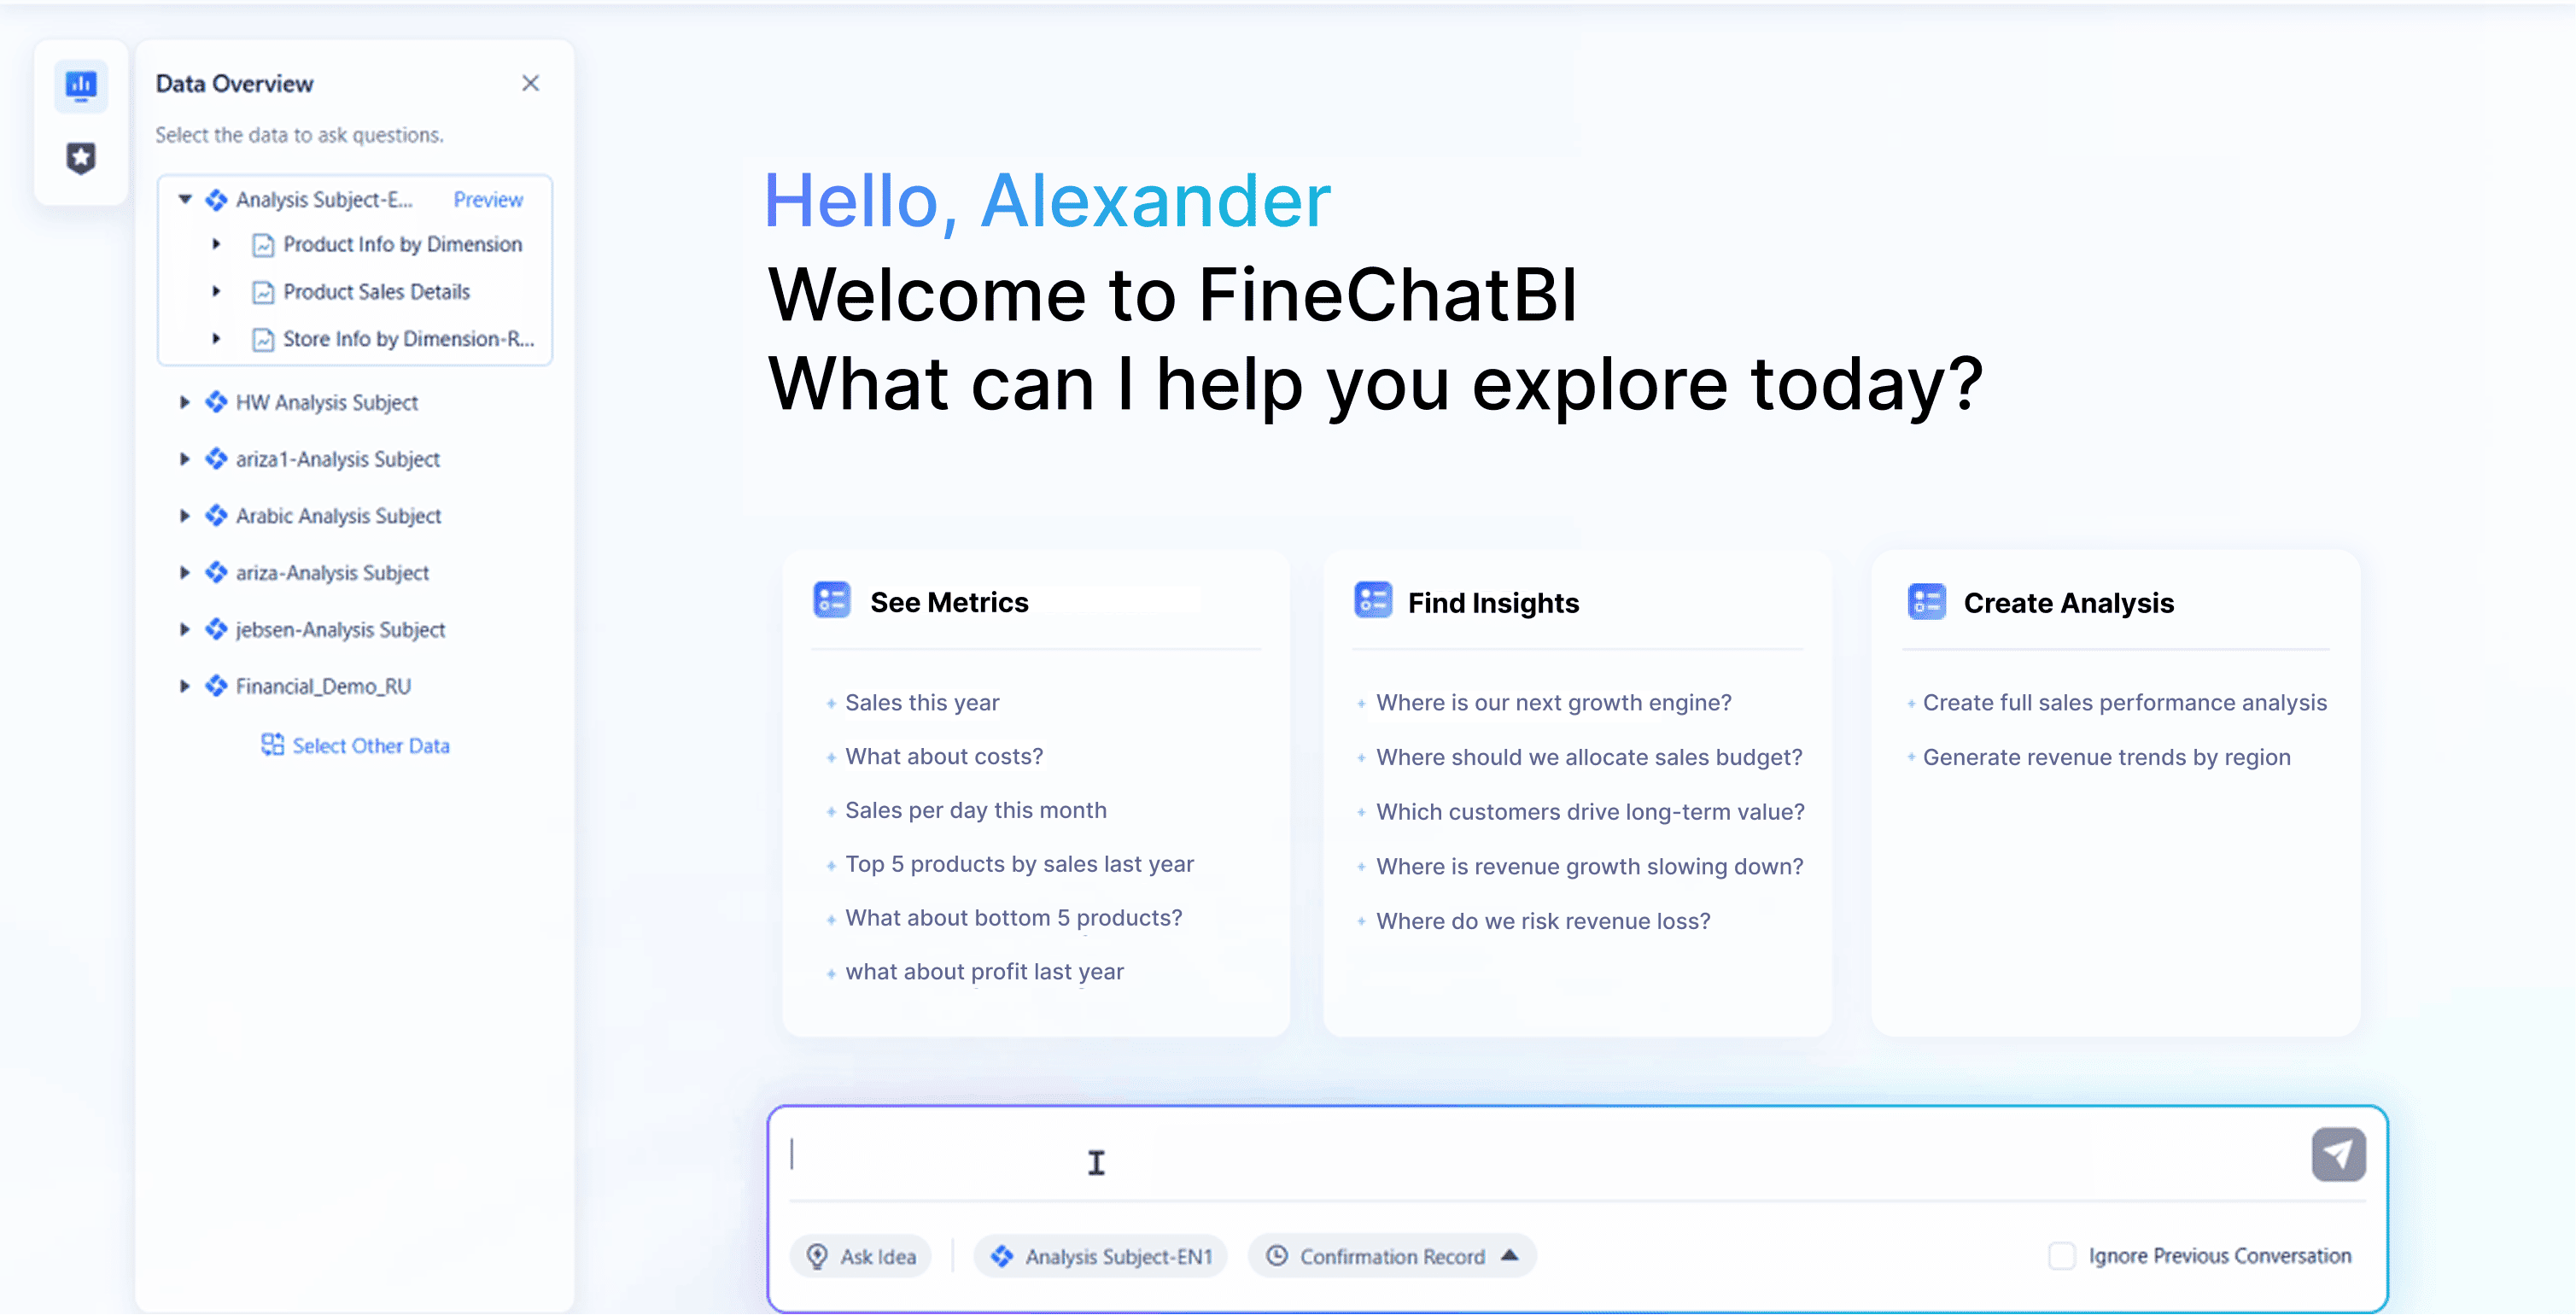
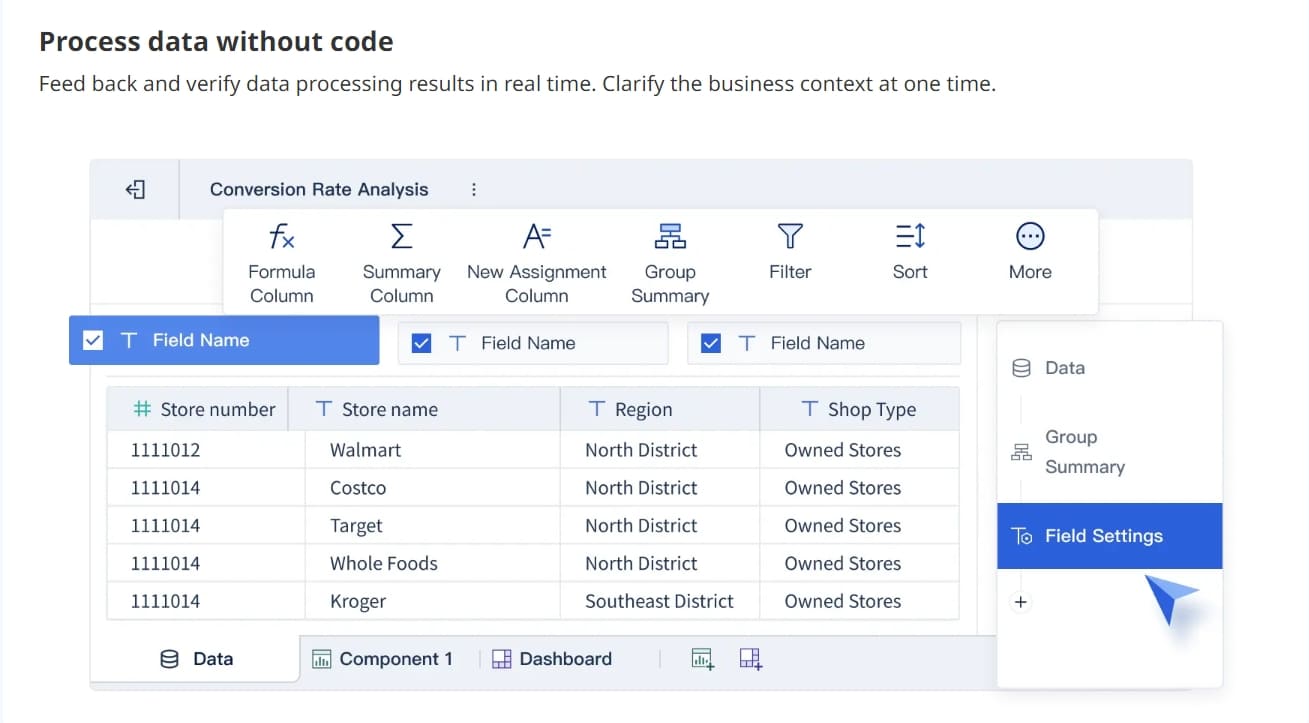
You need dashboards that bring together data from multiple sources. FineBI supports over 60 data connectors, letting you unify information from databases, cloud platforms, and APIs. This integration is a key feature for both it security dashboards and cyber security dashboards. You can visualize security metrics, KPIs, and threat data in one place. FineBI’s drag-and-drop tools make it easy to build dashboards without coding. You can create interactive charts, maps, and tables that show real-time insights. The visual interface helps you simplify complex data, making it easier to interpret and act on information. Multi-cluster and multi-cloud support gives you a holistic view across environments, so you never miss critical events.

- FineBI enables you to:
- Connect to diverse data sources for unified analysis.
- Visualize security metrics and KPIs with customizable charts.
- Schedule real-time updates for continuous monitoring.
- Use templates for faster dashboard creation.

Customizable Components and User Experience
You want dashboards that fit your workflow. Customization is a key feature that improves user satisfaction and productivity. FineBI lets you tailor dashboards for different roles, such as analysts, IT teams, and executives. You can adjust layouts, add filters, and set up role-based access controls. This ensures users see relevant information without exposing sensitive data. The user-friendly interface boosts confidence, especially during high-pressure situations. You can personalize dashboards to track KPIs, monitor threats, and follow up on incidents. The table below shows how user experience impacts effectiveness:
| Aspect | Impact on User Experience |
|---|---|
| Role-based access | Ensures users access relevant information without exposing sensitive data. |
| Customization | Allows users to tailor dashboards to their workflow, enhancing satisfaction and productivity. |
| Usability | Improves user confidence and effectiveness in using security tools under pressure. |

Advanced Analytics and Reporting
You need advanced analytics to uncover hidden threats and trends. Modern soc dashboards include features like trend identification, data correlation, and drill-down capabilities. You can spot spikes in login attempts, correlate logs from different sources, and isolate details for deeper investigation. FineBI integrates machine learning and AI-driven analytics, helping you analyze large datasets and surface actionable insights. You shift from reactive to proactive risk management, reducing the likelihood of cyberattacks. Reporting capabilities support compliance and audit requirements. You can automate reports, export them in various formats, and document compliance status. FineBI’s dashboards let you track KPIs, monitor cybersecurity, and align technical findings with business context.
- Advanced analytics features include:
- Real-time dashboards for enterprise security environments.
- Machine learning integration for deep analysis.
- Scheduled and ad hoc reporting for compliance tracking.
- Drill-down and filtering for detailed incident detection.
- Actionable insights for proactive threat detection.
Note: Compliance dashboards provide a centralized view of your organization’s status, improving decision-making and accountability.
You use security dashboards to monitor threats, track KPIs, and gain real-time insights. FineBI supports all key features, making it a powerful solution for building it security dashboards and cyber security dashboards that meet your organization’s needs.
Security Dashboard Users and Use Cases
A security dashboard is a visual tool that helps you monitor, detect, and respond to threats across your organization in real time.
Roles: Analysts, IT, Executives
You use soc dashboards to support different roles in your organization. Executives rely on dashboards to see risk and measure investment effectiveness. Compliance officers use dashboards to spot gaps in regulations. Operational teams track remediation and identify trends. The table below shows how each role uses a security dashboard:
| Role | Primary Purpose |
|---|---|
| Executives | See a clear picture of organizational risk and assess investment effectiveness. |
| Compliance Officers | Gain visibility into compliance gaps against various frameworks. |
| Operational Teams | Validate remediation progress and identify trends needing attention. |
You also see how dashboards help analysts, IT staff, and executives:
- SOC analysts use dashboards for real-time detection and investigation of suspicious activities.
- SOC managers oversee team performance and resource allocation using operational metrics.
- CISOs need clear summaries to report on cybersecurity trends and risks.
Industry Solutions: Finance, Manufacturing, EHS, Quality Control
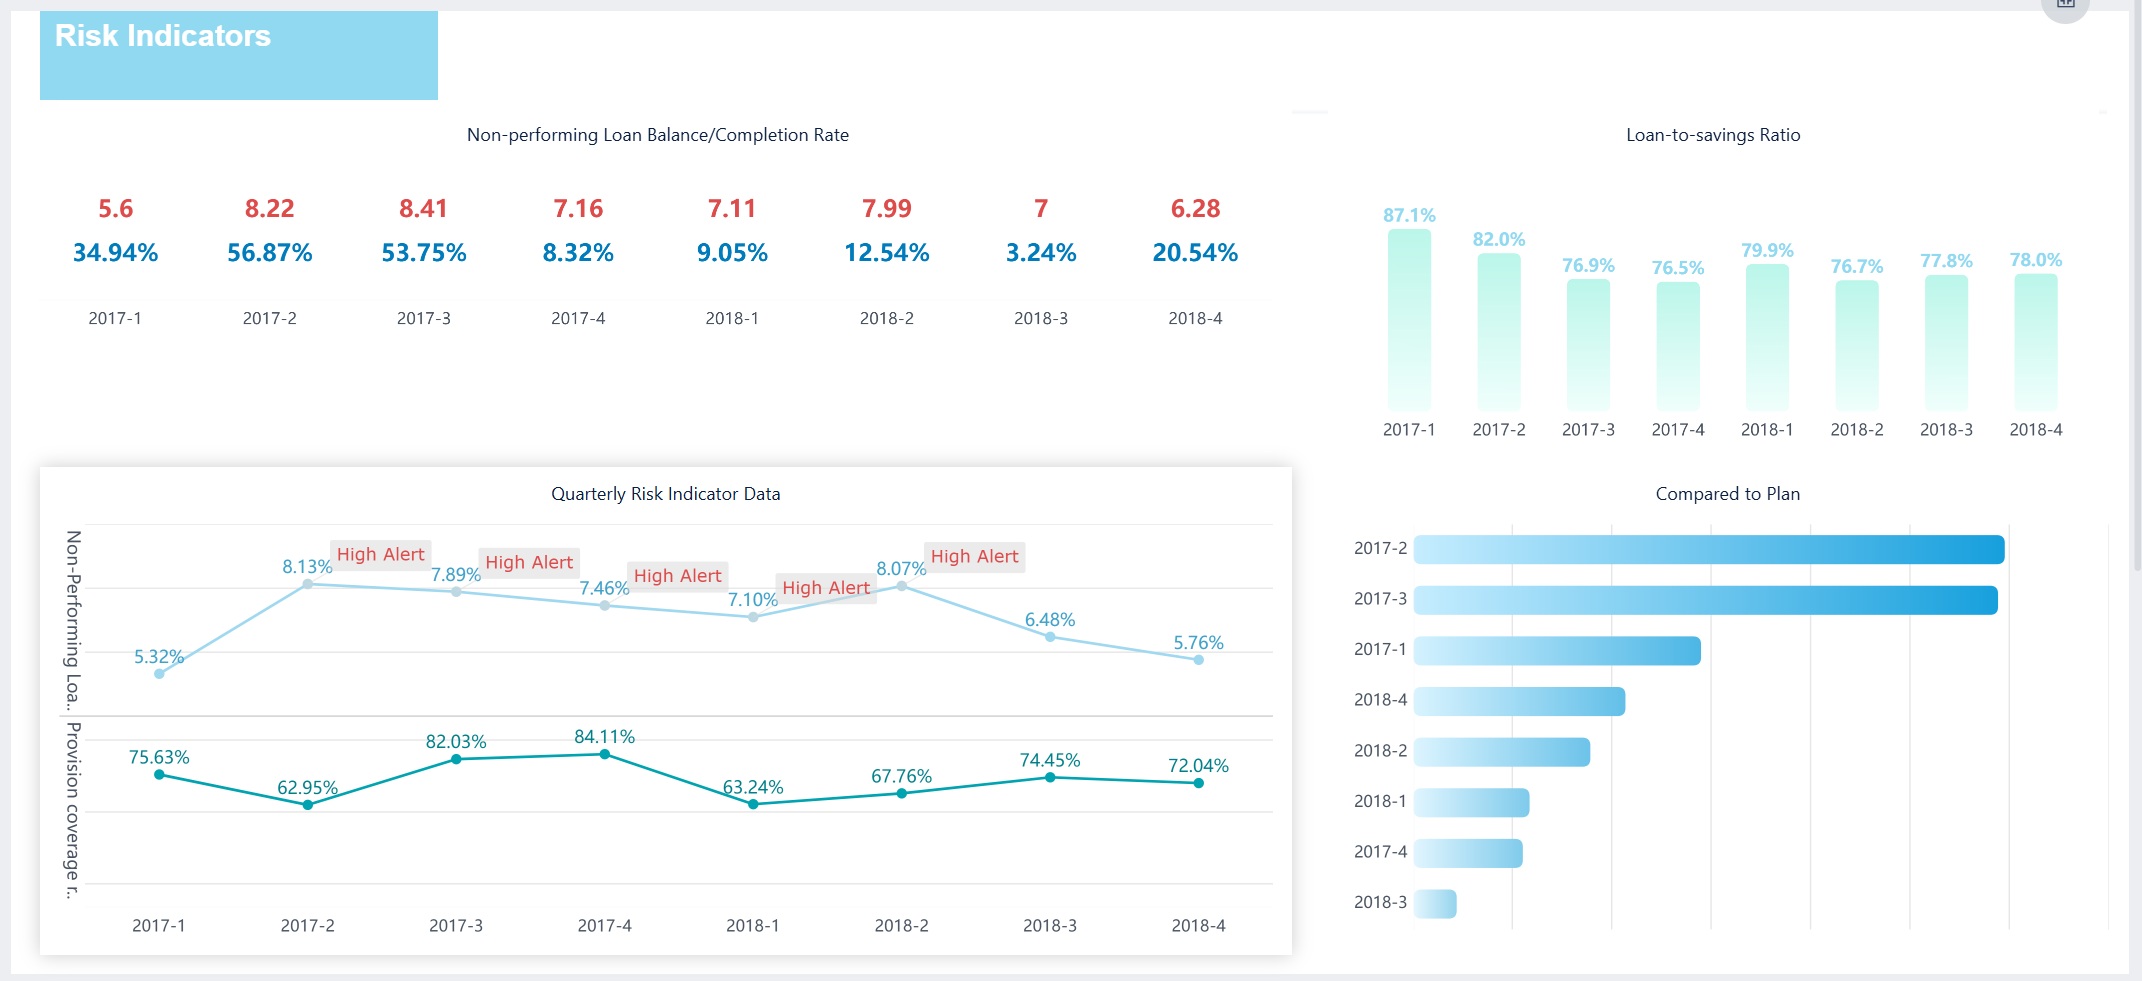
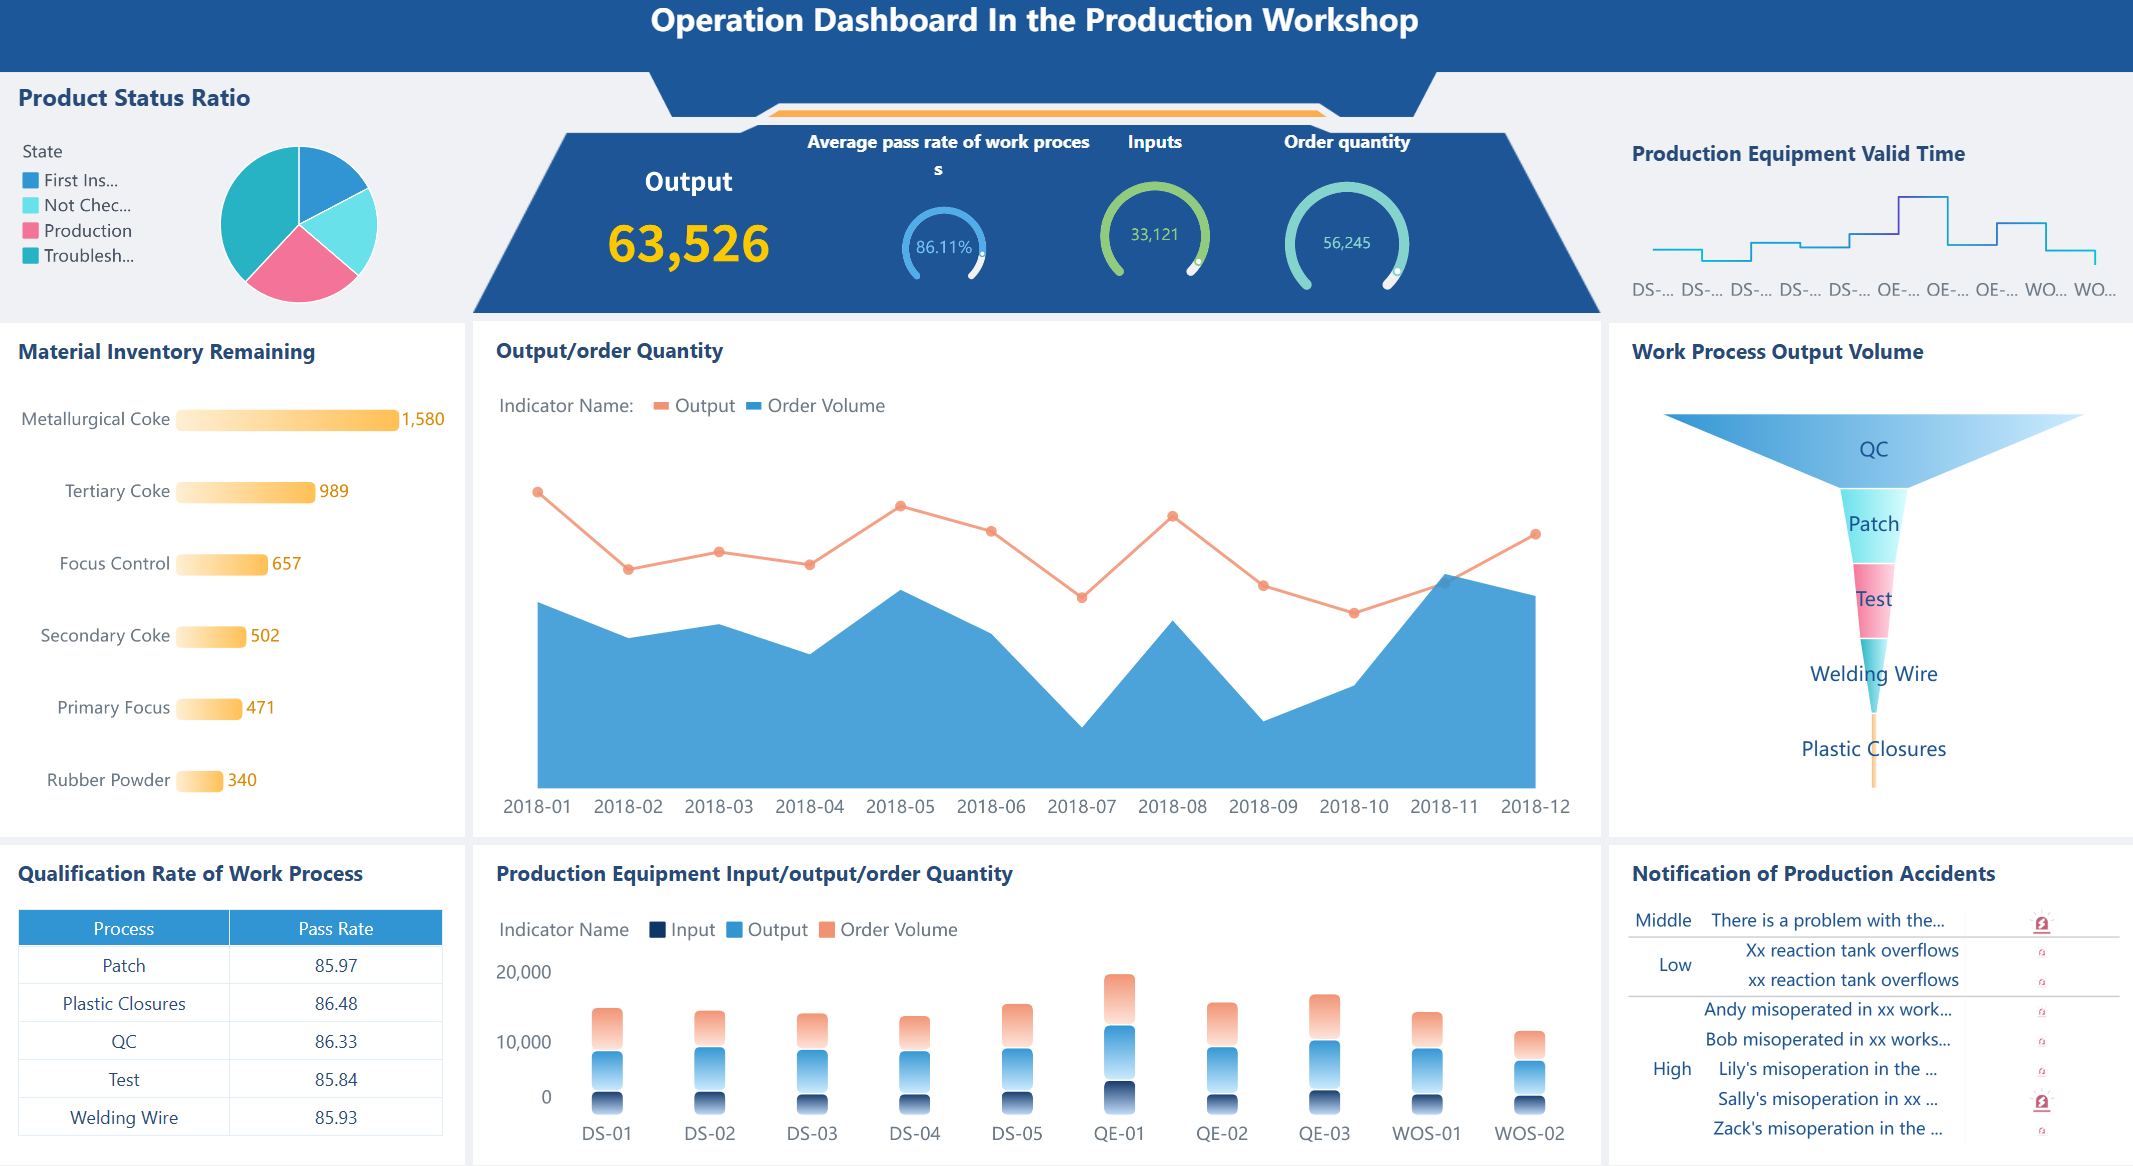
You find soc dashboards in many industries. In finance, dashboards help you with cyber risk management and risk assessment. You track threats and monitor KPIs to protect assets. In manufacturing, dashboards support EHS and quality control. You use dashboards to detect incidents, monitor compliance, and improve safety. Dashboards let you visualize KPIs and spot trends in product quality or workplace safety. You build a stronger cybersecurity strategy by using dashboards for threat detection and incident response.
Tip: Dashboards in manufacturing help you reduce scrap rates and improve product quality by tracking real-time data.
FineBI in Real-World Security Dashboard Applications
FineBI adapts to your needs across industries. You connect multiple data sources and create dashboards for cyber risk management, EHS, and quality control. In finance, you use FineBI to detect threats and assess risk. In manufacturing, you monitor KPIs and respond to incidents quickly. FineBI’s dashboards give you real-time detection, advanced analytics, and customizable layouts. You improve your cybersecurity strategy and streamline incident response. FineBI helps you visualize trends, track KPIs, and make informed decisions.
Security Dashboard Implementation
Usability and Scalability
You need a security dashboard that is easy to use and can grow with your organization. Focus on these usability features for successful implementation:
- User-centric design: Tailor the dashboard for different roles. Executives need clear KPI summaries. Analysts require tools for deep data exploration.
- Performance metrics: Track both technical performance, like load times, and user-focused metrics, such as task completion rates and time-to-insight.
- Regular reviews and updates: Schedule quarterly reviews and make monthly adjustments to keep your dashboard effective.
Scalability matters when your organization handles large volumes of data. Invest in robust infrastructure and effective data management. Large enterprises often use AI-driven platforms that process security logs and provide real-time threat intelligence. Plan carefully, invest in infrastructure, and follow regulatory compliance to ensure your dashboard remains accurate and responsive.
Integration and Governance with FineBI
FineBI offers strong integration and governance features for your security dashboard. You can connect FineBI with your existing security infrastructure and manage user access with ease. The table below highlights key features:
| Feature | Description |
|---|---|
| Dynamic Row-Level Security | Control access based on user roles for better data security. |
| Detailed Audit Logs | Track user activities for compliance and security monitoring. |
| User Management | Manage user permissions and access within the BI environment. |
| Integration with LDAP/SAML | Connect with enterprise identity providers for seamless authentication and authorization. |
| On-Premise Deployment | Maintain control over your security environment for strict compliance purposes. |
These features help you meet compliance requirements, manage sensitive data, and support secure incident response.
Best Practices for Deployment
To maximize adoption and effectiveness, follow these best practices:
- Develop a user adoption plan alongside your dashboard design.
- Provide ongoing training through workshops and online resources.
- Promote dashboards using internal communications and training materials.
- Engage users with contests to encourage practical use.
- Monitor usage and gather feedback to improve your dashboard.
Tip: Regularly review your dashboard’s effectiveness and update it to meet changing compliance and cybersecurity needs. Encourage feedback from users to drive continuous improvement.
A security dashboard gives you a real-time view of your organization’s security status, helping you detect threats and make smart decisions. In 2026, you need dashboards with real-time monitoring, strong analytics, and easy customization. FineBI supports these needs with seamless integration and advanced reporting. Use the table below to evaluate your dashboard options:
| Dashboard Name | Key Features |
|---|---|
| Diligence Activity Dashboard | Tracks active reviews and highlights required actions. |
| ADV & Regulatory Filings | Warns you about operational and compliance risks. |
| Workflow & Collaboration Insights | Improves team accountability and removes bottlenecks. |
| Structured Diligence Data | Turns unstructured data into actionable intelligence. |
| Dynamic Ratings Heatmap | Shows trends and guides your decisions at a glance. |
Choose a dashboard that aligns with your security goals and supports future-proof analytics. FineBI helps you stay ready for tomorrow’s challenges.
Continue Reading About Security Dashboard
How to Create a Risk Management Dashboard for Your Business
What is a Risk Dashboard and How Does It Work
What is Data Asset Management and Why it Matters


FAQ

The Author
Lewis
Senior Data Analyst at FanRuan
Related Articles

How to Build an Investment Portfolio Reporting Dashboard for Executives: KPIs, Benchmarks, and Drill-Down Views
Investment portfolio reporting for executives is not about showing every holding, transaction, and chart your investment team can produce. It is about giving CEOs, CFOs, CIOs, boards, and investment committees a fast, re
Yida YIn
Jun 25, 2026

12 KPI Reporting Examples for Executive Dashboards: What to Show in Weekly, Monthly, and Quarterly Reviews
Executive leaders do not need more data. They need decision ready $1 examples that match how often they review the business and what actions they are expected to take. A weekly $1 should surface fast moving risks and per
Yida YIn
Jun 25, 2026

How to Build a Digital Marketing Reports Dashboard: Executive Examples, KPIs, and Templates
A $1 is the control layer that helps executives and marketing leaders turn scattered channel data into fast, confident decisions. If you are a CEO, CMO, operations director, or marketing analytics lead, the real problem
Yida Yin
May 07, 2026