A saas metrics dashboard is a real-time, visual platform that lets you track, analyze, and share your most important metrics to drive smarter decisions in your saas business. You need to monitor key performance indicators daily to keep your saas on a growth path. When you use a dashboard, you see all your critical data in one place. This helps you spot trends, measure customer engagement, and improve your operations quickly.
Industry studies show that companies using real-time dashboards gain centralized access to revenue and account health, streamline their operations, and uncover insights that boost retention.
- Over half of professionals now rely on dashboards for tracking growth, marketing, customer, and sales metrics.
- Nearly a third focus on financial and user experience metrics.
- Experts recommend dashboards that highlight customer retention and recurring revenue.
You can use a saas metrics dashboard to unify your data, support self-service analytics, and ensure everyone works with the same numbers.
What is a saas metrics dashboard?
A saas metrics dashboard is a real-time tool that lets you track, visualize, and analyze the most important metrics for your saas business in one unified view.
Core purpose and definition
You use a saas metrics dashboard to bring all your key data together. This dashboard helps you see how your saas business performs every day. You can spot trends, measure growth, and respond quickly to changes. The main goal is to give you a single source of truth for your saas metrics.
A saas dashboard stands out from traditional business intelligence dashboards. You get faster setup, easier data integration, and real-time insights. You do not need to manage complex infrastructure. You focus on what matters—your saas growth.
Tip: A saas metrics dashboard gives you predictive analytics, so you can make decisions based on what is happening now, not just what happened last month.
| Feature | SaaS Metrics Dashboards | Traditional BI Dashboards |
|---|---|---|
| Setup Time | Fast setup in days | Lengthy setup times |
| Data Integration | Unified dashboards with multiple data sources | Often requires complex integration |
| Analytics | Predictive analytics for real-time insights | Historical data analysis |
| Cost | Typically 10x cheaper than custom BI | Higher costs due to infrastructure needs |
| Infrastructure | Cloud-native, managed by provider | Requires management of infrastructure |
You can see that a saas metrics dashboard helps you move faster and stay focused on your business goals.
Typical metrics tracked in a saas dashboard
You need to track the right metrics to understand your saas business. The most important metric is Monthly Recurring Revenue (MRR). This shows you how much predictable income your saas generates each month. You also want to know your Customer Lifetime Value (CLV), which tells you how much revenue you can expect from each customer over time.
Other key metrics you should track in your saas dashboard include:
- Churn rate
- Customer Acquisition Cost (CAC)
- Customer retention rate
- Active users
- Expansion MRR
- Net Promoter Score (NPS)
A good saas metrics dashboard lets you see all these metrics in one place. You do not need to switch between tools or spreadsheets. You get a clear picture of your saas health.
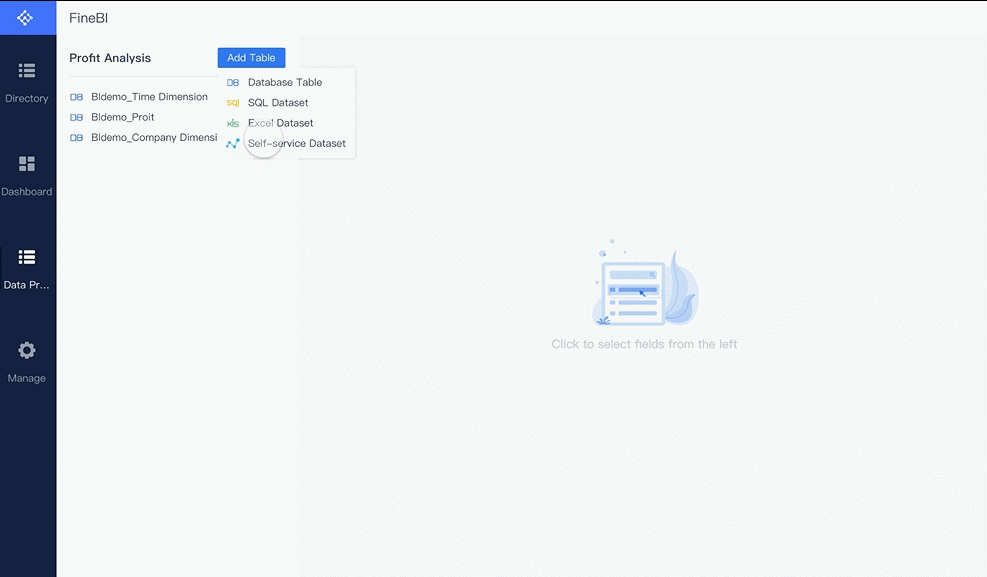
FineBI helps you unify all your saas metrics in a single dashboard. You can connect data from different sources, set up real-time updates, and build interactive dashboards without coding. This means you spend less time gathering data and more time acting on insights.

Note: When you use a saas dashboard powered by a tool like FineBI, you empower your team to make data-driven decisions. Everyone works with the same numbers, so you avoid confusion and improve accountability.
A saas metrics dashboard is not just a reporting tool. It is your command center for growth. You track, analyze, and share the metrics that matter most to your saas business.
Why a saas metrics dashboard matters for business growth
Monitoring saas health and performance
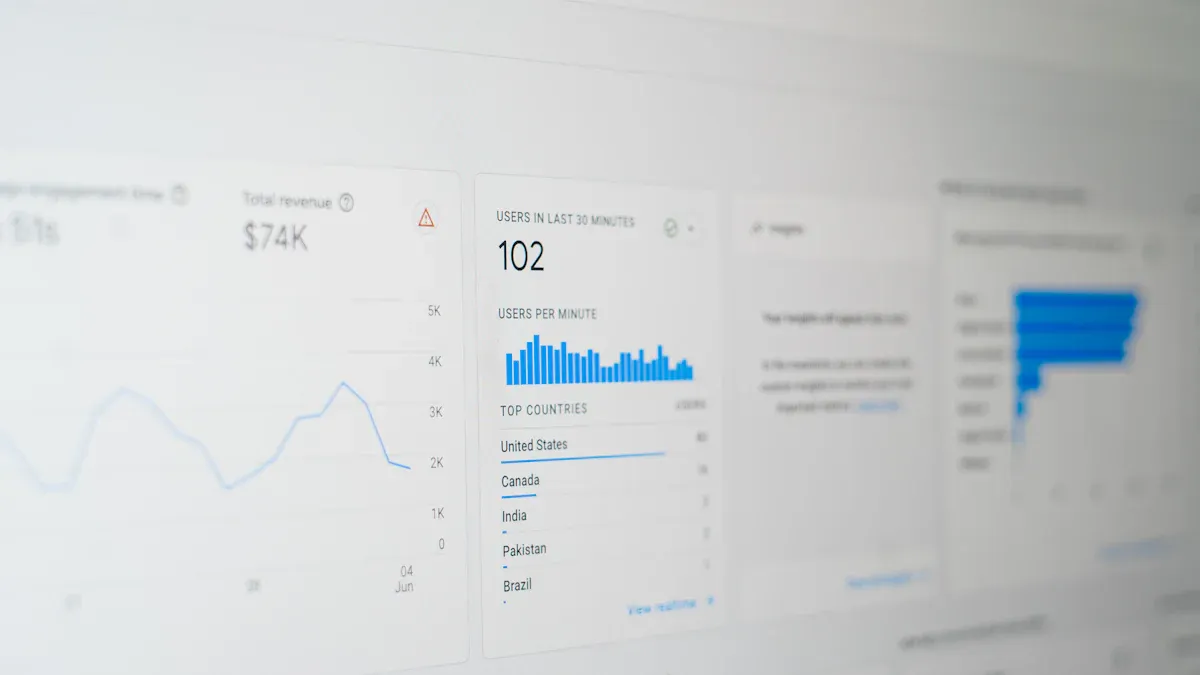
You need to monitor your saas health every day. A dashboard gives you a real-time view of your business. You see how your metrics change and spot problems before they grow. When you track user engagement, support tickets, and product adoption, you catch early warning signs.
| Warning Sign | Description |
|---|---|
| Declining User Engagement | Drops in product logins or feature usage often signal upcoming customer churn. |
| Support Ticket Patterns | Unresolved support tickets in the first hour are associated with higher churn rates. |
| Product Adoption Metrics | Signs include incomplete onboarding after 48 hours and lower feature adoption rates. |
A health score dashboard helps you analyze product usage, satisfaction, and engagement. You spot risks early and take action before customers leave. Dashboards provide actionable insights that link business events to performance dips. You identify revenue-generating opportunities by reviewing key points in your business history.
Tip: When you use a dashboard, you optimize growth metrics and make better decisions for your saas.
Driving data-driven decisions
You make smarter choices when you use data. A saas dashboard gives you a centralized view of your metrics. You see trends and patterns in real time. This helps you respond quickly to market changes and improve your strategy.
- Dashboards provide real-time data, so you act fast.
- Clear visualizations simplify complex data and highlight areas for improvement.
- You base decisions on accurate information from key performance indicators.
Teams use dashboards to support business strategies. For example, Heap’s analytics platform captures every user interaction. This helps teams understand behavior and improve product experiences. Mailtrap automated data flows and built a dashboard for vital metrics. Their team now relies on these insights for decision-making.
| Metric | Impact |
|---|---|
| Improved Decision Making | 90% |
| Enhanced Transparency Across Departments | 80% |
| Enhanced Data-Driven HR Strategies | 70% |
FineBI helps you unify your data and build dashboards that drive decisions. BOE Technology Group used FineBI to standardize metrics and create a unified analysis framework. Their operational efficiency increased by 50%, and inventory costs dropped by 5%. The dashboard enabled centralized monitoring and early risk identification.

Note: When you use a dashboard, you empower your team to make decisions based on real-time insights.
Aligning teams and accountability
A saas dashboard creates a single source of truth. Everyone works with the same metrics and goals. This transparency builds trust and accountability. Teams see their progress and know where to focus.
- Dashboards align teams around common goals.
- Transparency fosters accountability among team members.
- Centralized data access helps departments work with the same information.
- Communication improves, and everyone stays informed.
- Actionable insights drive growth and efficiency across your organization.
In high-performing organizations, 71% of people report good access to necessary data. In lower-performing organizations, only 33% have this access. When you use a dashboard, you foster seamless collaboration among product, engineering, sales, marketing, and customer success teams. You accelerate decision-making and enhance the customer journey.
Tip: A dashboard helps you align your teams, improve communication, and achieve your saas goals faster.
Key features of a saas dashboard
Real-time visualization and interactivity
You need a dashboard that shows your metrics in real time. This feature lets you see changes as they happen, so you can respond quickly. Real-time visualization helps you make smarter decisions and keeps your team engaged. Interactive dashboards allow you to explore data by clicking, filtering, and drilling down into details. You get instant feedback and can adjust your strategy on the spot.
| Benefit | Description |
|---|---|
| Improved decision-making | Enables smarter, faster decisions backed by accurate insights with up-to-the-minute data. |
| Enhanced user engagement | Encourages users to explore data deeply, leading to better insights and understanding. |
You can personalize your analytics dashboard to match your preferences. Responsive designs ensure you access your dashboard from any device, whether you are at your desk or on the go.
Data integration and self-service analysis
A strong saas dashboard connects to many data sources. You can pull data from databases, cloud platforms, and APIs. This integration gives you a complete view of your business. You do not need IT support to customize your dashboard. Drag-and-drop interfaces make it easy to build and adjust your analytics dashboard.
- Flexibility and scalability let you manage different business sizes and industries.
- Easy user interfaces help non-technical users create custom dashboards.
- Data preprocessing tools allow you to clean and organize your metrics before analysis.
- Role-based dashboards show relevant metrics to each team member.
- Visualization options include charts, graphs, and tables for better understanding.
You can use OLAP analysis to dig deeper into your metrics. Mobile access means you can check your dashboard anywhere. Collaborative tools let your team share insights and work together in real time.
Security and access control
Security is essential for any saas dashboard. You need to protect sensitive metrics and customer data. Role-based access control ensures only authorized users see specific information. Identity and access management systems add another layer of protection, including single sign-on and multi-factor authentication.
- Continuous monitoring tracks data movement and identifies threats.
- Compliance with security standards like GDPR and HIPAA keeps your business safe.
- Data loss prevention tools stop unauthorized transfers.
- Audit trails help you review who accessed your dashboard and when.
A secure analytics dashboard builds trust with your customers. You safeguard data, reduce risks, and meet industry regulations.
Benefits of using a saas kpi dashboard
Enhanced performance tracking
A saas kpi dashboard gives you a clear view of your business performance. You can track important kpi and metrics in real time. This helps you see how your company is doing every day. When you monitor customer activity, product usage, and revenue, you can spot trends early. For example, FineBI helped BOE Technology Group reduce inventory costs by 5% and boost operational efficiency by 50%. You can use a dashboard to compare your results with industry standards and set new goals.
| Benefit | Description |
|---|---|
| Data-driven decision-making | Immediate access to critical metrics allows for informed choices and strategic planning. |
| Team alignment | A shared view of metrics improves communication and reduces confusion, aligning efforts. |
| Proactive management | Real-time insights enable early identification of issues, allowing for timely adjustments. |

You can use these insights to make better decisions and keep your business on track.
Faster issue detection and opportunity identification
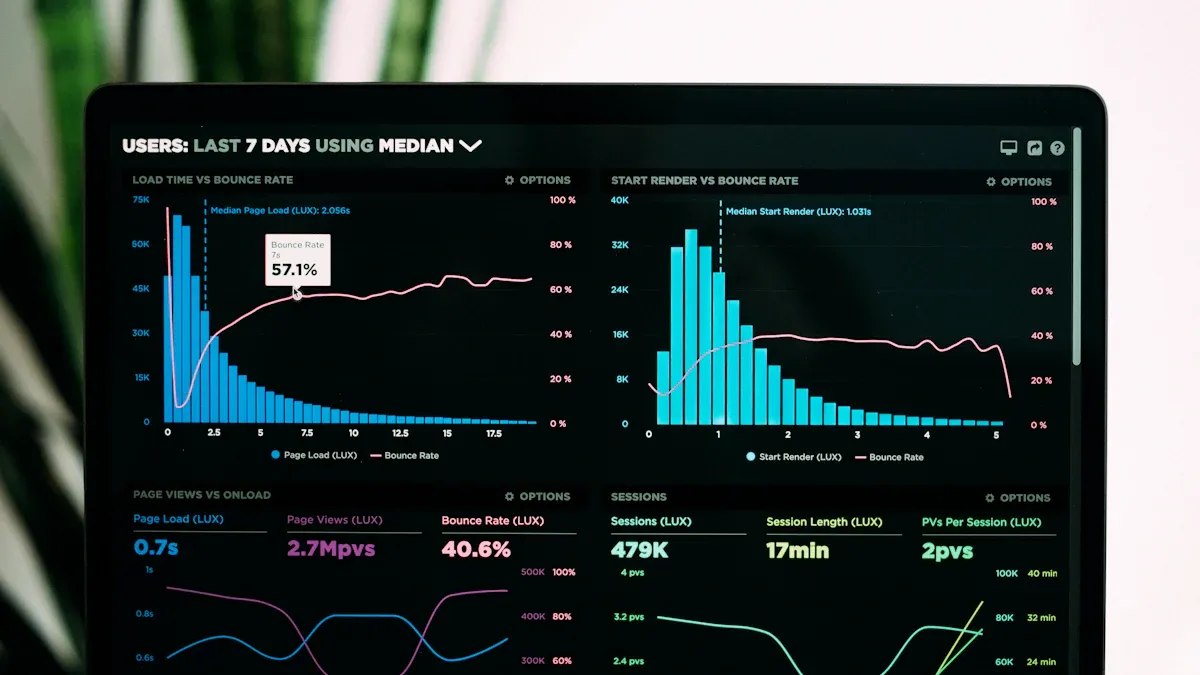
A saas kpi dashboard helps you find problems before they grow. You can see changes in customer behavior, such as a drop in session length or fewer features used per session. These signs warn you about possible churn. Real-time monitoring lets you act quickly. For example, resolving issues early can reduce churn by up to 30%. You can also spot new opportunities, like a sudden increase in product usage or positive customer feedback.
- AI-powered dashboards give you instant insights that help you adapt to market changes.
- You can compare your kpi with industry benchmarks to find areas for growth.
- When you see a higher churn rate than average, you can investigate and fix the cause.
This approach keeps your business agile and ready for new challenges.
Improved reporting and collaboration
A saas kpi dashboard improves how your team works together. Everyone sees the same data, so there is less confusion. Real-time updates make sure your reports are always current. You can share dashboards with your team, making it easy to discuss results and plan next steps. FineBI supports large datasets and enables self-service analytics, so you do not need to wait for IT support.
| Feature | Benefit |
|---|---|
| Real-time data updates | Ensures dashboards reflect the current state of the business, improving reporting accuracy. |
| Enhanced reporting | Improves internal transparency and fosters collaboration among teams. |
| Integration with tools | Streamlines communication and unifies workflows, enhancing collaboration. |

You can use these features to make faster decisions and achieve your business goals.
Choosing the right saas metrics dashboard
Key considerations for selection
When you choose a dashboard for your saas business, you need to focus on integration, scalability, and user experience. A dashboard should connect to all your data sources, whether they are cloud-based or stored locally. You want a solution that grows with your business and supports both small teams and large enterprises.
Here is a comparison to help you evaluate your options:
| Feature | FineBI | Other SaaS Solutions |
|---|---|---|
| Scalability | Suitable for SMBs to large enterprises | Varies by solution |
| Integration Capabilities | Integrates with cloud and local sources | Often limited to specific sources |
| User-Friendliness | Drag-and-drop reporting | Varies, often less intuitive |
| Cost | Budget-friendly | Generally higher |
You should look for a dashboard that offers drag-and-drop functionality. This makes it easy for anyone on your team to build reports and analyze data. A budget-friendly dashboard helps you maximize ROI without sacrificing features.
Tip: Data democratization is key. When everyone can access and use data, your organization makes better decisions and drives growth.
Best practices for implementation
To get the most from your dashboard, follow these best practices:
- Establish your objectives before you start.
- Choose KPIs that match your goals.
- Use your dashboard as the central hub for monitoring performance.
You should design your dashboard with a clear visual hierarchy. Place the most important metrics at the top. Use color and size to highlight critical data. Balance data density with clarity, and leave enough white space for easy reading.
- Personalized onboarding helps users learn quickly.
- Interactive tutorials and quizzes boost engagement.
- Analytics integration lets you track user feedback and improve the dashboard experience.
Successful onboarding improves user satisfaction and retention. When you guide users through the dashboard, they understand how to use it and get value from day one.
"When reading a visualization (or any other kind of communication), your reader has a limited amount of brainpower to dedicate to the problem...any brainpower that is left may then be used to understand the message (if the reader hasn't yet given up in frustration)."
You should update metrics at the right frequency for each role:
| Role | Primary Metrics | Update Frequency |
|---|---|---|
| Executives | MRR, CAC, CLV | Daily |
| Finance Teams | Revenue, Expenses, Cash Flow | Real-time |
| Product Managers | User Engagement, Feature Usage | Hourly |
| Sales Teams | Pipeline, Conversion Rates | Real-time |
A well-implemented dashboard helps every team member stay informed and act quickly.
A SaaS metrics dashboard gives you a clear view of your business health and growth. You track the right metrics, measure progress, and make fast, informed decisions.
- Focus on relevant metrics and clear design to reach your goals
- Use AI and embedded analytics for deeper insights
- Align teams and boost efficiency with real-time data
- Spot trends and act quickly
- Monitor MRR, ARR, and churn for financial health
FineBI helps you overcome analytics challenges with features like no-code dashboards, real-time analytics, and enterprise-grade security:
| Feature | Description |
|---|---|
| No-code platform | Build visualizations without coding |
| Real-time analytics | See instant updates and insights |
| Integrated ETL tools | Prepare and manage your data easily |
| Mobile app support | Access insights anywhere |
| Scalability | Grows with your business |
| In-memory computing | Fast response for large data |
| Enterprise security | Role-based access and audit logging |

Explore a SaaS metrics dashboard today to drive your business forward.

Continue Reading About SaaS metrics dashboard


FAQ

The Author
Lewis
Senior Data Analyst at FanRuan
Related Articles

How to Build an Investment Portfolio Reporting Dashboard for Executives: KPIs, Benchmarks, and Drill-Down Views
Investment portfolio reporting for executives is not about showing every holding, transaction, and chart your investment team can produce. It is about giving CEOs, CFOs, CIOs, boards, and investment committees a fast, re
Yida YIn
Jun 25, 2026

12 KPI Reporting Examples for Executive Dashboards: What to Show in Weekly, Monthly, and Quarterly Reviews
Executive leaders do not need more data. They need decision ready $1 examples that match how often they review the business and what actions they are expected to take. A weekly $1 should surface fast moving risks and per
Yida YIn
Jun 25, 2026

How to Build a Digital Marketing Reports Dashboard: Executive Examples, KPIs, and Templates
A $1 is the control layer that helps executives and marketing leaders turn scattered channel data into fast, confident decisions. If you are a CEO, CMO, operations director, or marketing analytics lead, the real problem
Yida Yin
May 07, 2026