SaaS analytics involves collecting, analyzing, and interpreting data tailored to SaaS businesses. It empowers you to make smarter decisions by uncovering insights from key metrics like Customer Lifetime Value (CLTV) and Monthly Recurring Revenue (MRR). These metrics help you prioritize customer retention, optimize marketing strategies, and predict revenue streams. For instance, tracking churn rate reveals how well you retain customers, while Customer Acquisition Cost (CAC) evaluates the efficiency of your marketing efforts. By leveraging SaaS analytics, you can transform raw data into actionable strategies that drive growth and improve customer satisfaction.

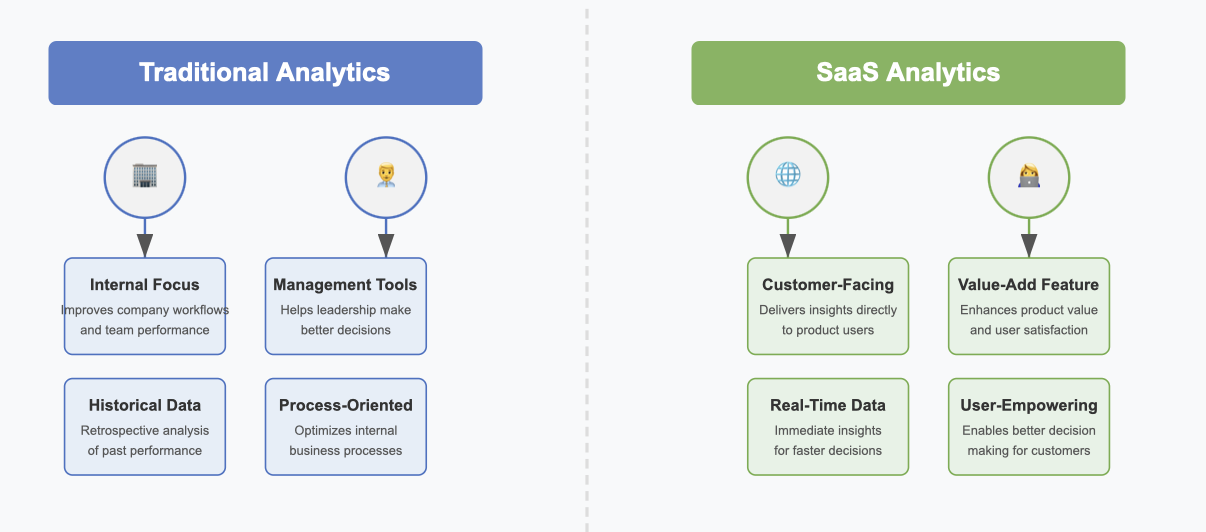
SaaS analytics refers to the process of gathering, analyzing, and interpreting data specifically for software-as-a-service businesses. It focuses on metrics that reveal how your customers interact with your product, how much revenue you generate, and how efficiently you operate. Unlike traditional analytics, which often centers on internal processes, SaaS analytics emphasizes customer behavior and product performance. For example, tracking Monthly Recurring Revenue (MRR) helps you understand predictable income, while Customer Lifetime Value (LTV) shows the total revenue you can expect from a single customer.
Key metrics in SaaS analytics include:
| Metric | Description |
|---|---|
| Monthly Recurring Revenue (MRR) | Tracks predictable monthly income, essential for financial planning. |
| Customer Lifetime Value (LTV) | Measures the total revenue a customer brings over their relationship with your business. |
| Churn Rate | Indicates the percentage of customers who stop using your service, highlighting retention issues. |
| Customer Acquisition Cost (CAC) | Shows how much you spend to acquire a new customer, helping you optimize marketing budgets. |
By focusing on these metrics, you can make informed decisions that improve customer retention and drive growth.
SaaS analytics stands apart from traditional analytics in its focus and application. Traditional analytics often revolves around internal operations, such as improving team efficiency or optimizing supply chains. SaaS analytics, on the other hand, prioritizes customer-facing insights. It provides real-time data that helps you enhance user experiences and adapt your product to meet customer needs.
For instance:
This customer-centric approach makes SaaS analytics a powerful tool for improving engagement and satisfaction.
SaaS analytics plays a pivotal role in shaping modern business strategies. It enables you to monitor user engagement, predict trends, and make data-driven decisions. By analyzing customer behavior, you can identify which features drive the most value and which areas need improvement. This insight allows you to refine your product and stay competitive.
| Aspect | Description |
|---|---|
| Customer Behavior Insights | Helps you understand how users interact with your product. |
| Predict Future Trends | Uses historical data to forecast market changes and customer needs. |
| Data-Informed Decisions | Empowers you to base strategies on facts rather than assumptions. |
| Churn Rate Analysis | Identifies reasons for customer loss, enabling proactive retention strategies. |
Additionally, SaaS analytics reduces infrastructure costs by leveraging cloud-based tools. It also provides real-time insights, allowing you to address performance issues before they escalate. For example, if your analytics reveal slow load times, you can resolve them quickly to maintain a positive user experience. This proactive approach ensures your business remains agile and customer-focused.
SaaS analytics empowers you to make informed decisions by providing real-time insights into your business operations. It allows you to track key metrics like Monthly Recurring Revenue (MRR) and Annual Recurring Revenue (ARR), which are essential for understanding your financial health. For example, MRR helps you monitor predictable income, while ARR offers a long-term perspective on revenue trends. By analyzing these metrics, you can identify areas for improvement and allocate resources more effectively.
| Metric | Description |
|---|---|
| Monthly Recurring Revenue | A key metric for understanding the revenue generated from subscriptions on a monthly basis. |
| Annual Recurring Revenue | Indicates the total revenue expected from subscriptions over a year. |
| Customer Churn Rate | Measures the percentage of customers who stop using the service over a specific period. |
SaaS analytics also helps you predict customer churn and forecast revenue growth. With historical data, you can assess the potential success of new features and adjust your strategies accordingly. This data-driven approach ensures that your decisions are based on facts rather than assumptions, giving you a competitive edge in the marketplace.
Retaining customers is more cost-effective than acquiring new ones, and SaaS analytics plays a vital role in achieving this. By tracking metrics like churn rate and retention rate, you can understand customer behavior and identify at-risk users. For instance, a high churn rate may indicate dissatisfaction, prompting you to address issues before they escalate. Retention rate, on the other hand, highlights customer loyalty and the effectiveness of your engagement strategies.
| Metric | Description |
|---|---|
| Churn Rate | Measures the percentage of customers or revenue lost over a specific period. |
| Retention Rate | Highlights the percentage of customers or revenue retained, indicating customer loyalty. |
| Balance | An optimal balance between low churn and high retention signifies a compelling value proposition. |
SaaS analytics enables you to segment feedback by user cohorts, such as power users and disengaged users. This segmentation helps you tailor your engagement strategies to meet specific needs. Additionally, tracking Net Promoter Score (NPS) trends provides insights into overall satisfaction, allowing you to enhance the customer experience. By acting on these insights, you can build stronger relationships and foster long-term loyalty.
SaaS analytics directly impacts your business growth by optimizing revenue strategies. Metrics like Customer Lifetime Value (CLTV) and churn rate help you understand the financial impact of customer retention and acquisition efforts. For example, a high CLTV indicates successful upselling and cross-selling strategies, while a low churn rate reflects strong customer satisfaction.
| Metric | Description |
|---|---|
| Monthly Recurring Revenue | A key indicator of revenue growth for SaaS companies, reflecting predictable income streams. |
| Annual Recurring Revenue | Provides a yearly perspective on revenue, essential for long-term financial planning. |
| Customer Lifetime Value | Indicates the total revenue expected from a customer over their relationship with the company. |
| Churn Rate | Measures customer retention and satisfaction, directly impacting revenue stability and growth. |
SaaS analytics enhances customer acquisition and retention by providing actionable insights. Real-time data allows you to identify trends and adapt your strategies to maximize profitability. For instance, analyzing conversion rates helps you evaluate the effectiveness of your marketing campaigns. By leveraging these insights, you can drive sustainable business growth and maintain a competitive edge.
In today’s fast-paced business environment, staying ahead of market trends is essential for success. SaaS analytics equips you with the tools to detect emerging patterns and adapt your strategies accordingly. By analyzing real-time data, you can identify shifts in customer behavior, market demands, and industry trends. This proactive approach ensures that your business remains competitive and responsive to change.
For example, companies like Sage rely on thorough market analysis and audience data evaluation before launching new products. This strategy prevents wasted resources on solutions that fail to meet customer needs. SaaS analytics enables you to replicate this approach by providing insights into key performance indicators and customer preferences. With this information, you can refine your offerings and align them with market expectations.
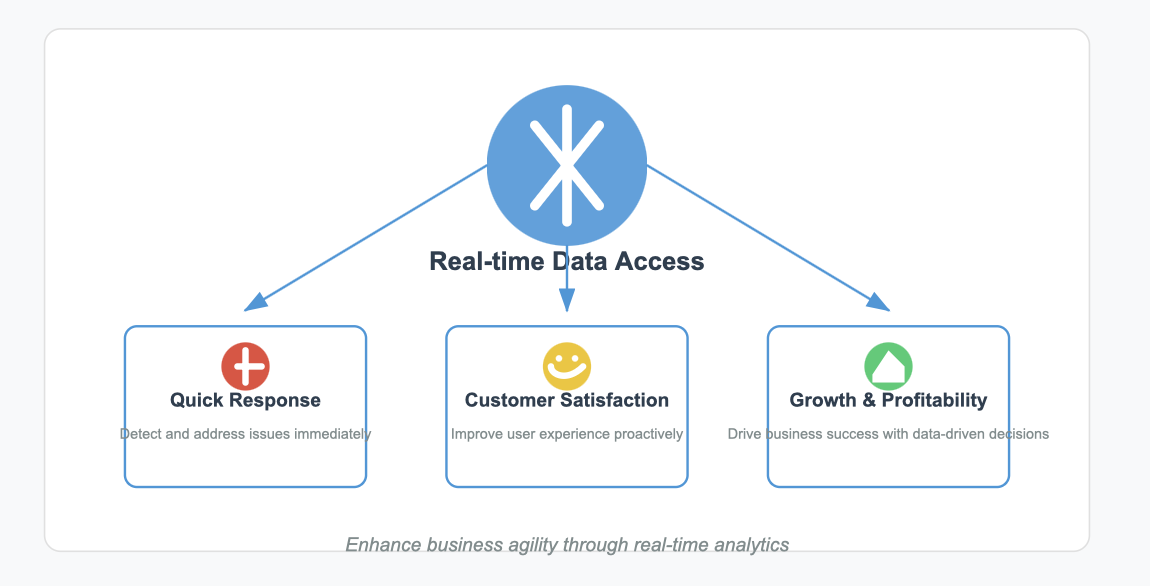
Real-time access to critical data is another advantage of SaaS analytics. It allows your team to respond quickly to changes in customer behavior or market conditions. For instance, if you notice a sudden drop in user engagement, you can investigate the cause and implement corrective measures immediately. This agility not only improves customer satisfaction but also drives growth and profitability.
SaaS analytics also helps you forecast future trends by analyzing historical data. By understanding past patterns, you can predict upcoming shifts in the market and prepare your business to capitalize on new opportunities. For example, if your analytics reveal a growing demand for a specific feature, you can prioritize its development to meet customer expectations.
Additionally, SaaS analytics supports data-driven decision-making across your organization. It empowers you to base your strategies on facts rather than assumptions, reducing the risk of costly mistakes. Whether you’re planning a marketing campaign or launching a new product, the insights provided by SaaS analytics ensure that your decisions are well-informed and aligned with your goals.
By leveraging SaaS analytics, you can stay ahead of the curve and adapt to market changes with confidence. This capability not only enhances your operational efficiency but also strengthens your competitive edge in the industry.
Monthly Recurring Revenue (MRR) is one of the most critical metrics for any subscription business. It represents the predictable revenue your business generates from subscriptions each month. By tracking MRR, you gain a clear understanding of your financial health and can forecast future growth. For example, if your MRR increases steadily, it indicates that your customer base is expanding or existing customers are upgrading their plans.
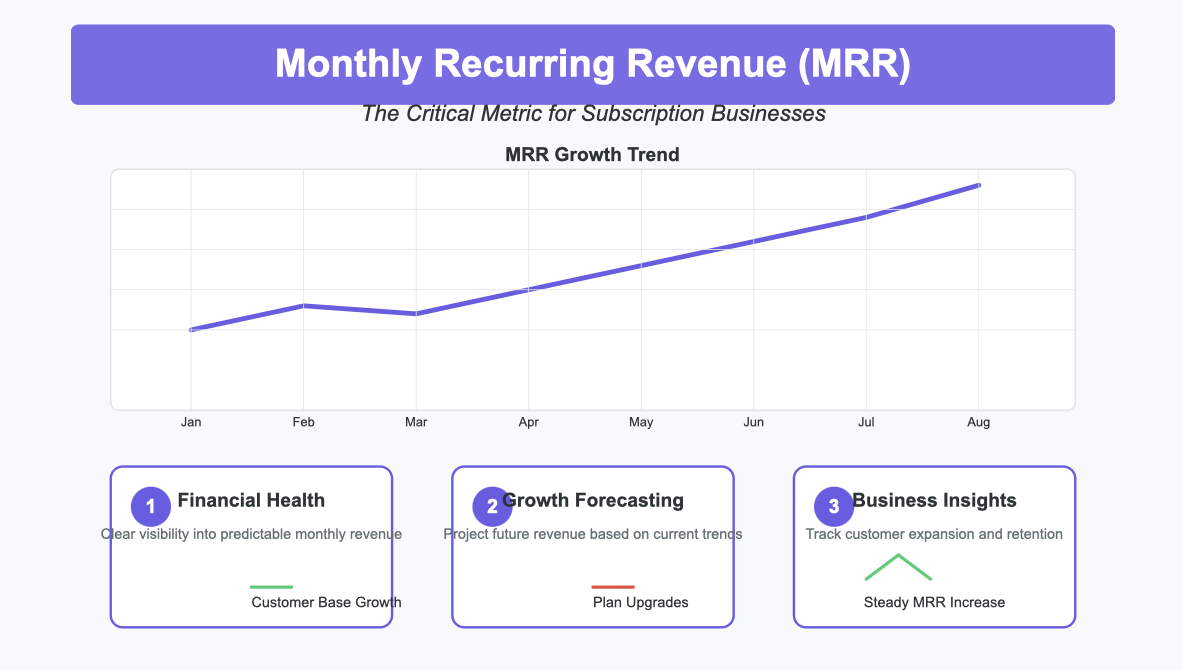
MRR also helps you evaluate the impact of pricing changes or promotional campaigns. For instance, introducing a discount might temporarily reduce MRR, but it could attract more customers in the long run. To measure MRR effectively, focus on revenue from recurring subscriptions and exclude one-time payments.
Here’s a quick comparison of related metrics:
| Metric | Description |
|---|---|
| MRR | Revenue from customers on a monthly basis, excluding one-off payments. |
| ARR | Annualized version of MRR, providing a yearly perspective. |
| NRR | Revenue retained from existing customers after accounting for churn. |
| CMRR | Predictable revenue based on contracts, useful for forecasting. |
By monitoring MRR alongside these metrics, you can make informed decisions to optimize your subscription business metrics.
Customer Acquisition Cost (CAC) measures how much you spend to acquire a new customer. It includes expenses like marketing campaigns, sales efforts, and software tools. Understanding CAC is essential for evaluating the profitability of your SaaS business. A high CAC might indicate inefficiencies in your acquisition strategy, while a low CAC suggests effective marketing and sales efforts.
To calculate CAC, divide your total sales and marketing costs by the number of new customers acquired during a specific period. For example, if you spend $10,000 on marketing and gain 100 new customers, your CAC is $100.
Platforms like Snowflake and HubSpot can help you gather the necessary data for CAC analysis:
Additionally, comparing CAC with Customer Lifetime Value (CLTV) provides deeper insights into acquisition efficiency. If your CAC is significantly lower than CLTV, your business is on a sustainable path. However, if CAC exceeds CLTV, you may need to refine your strategies.
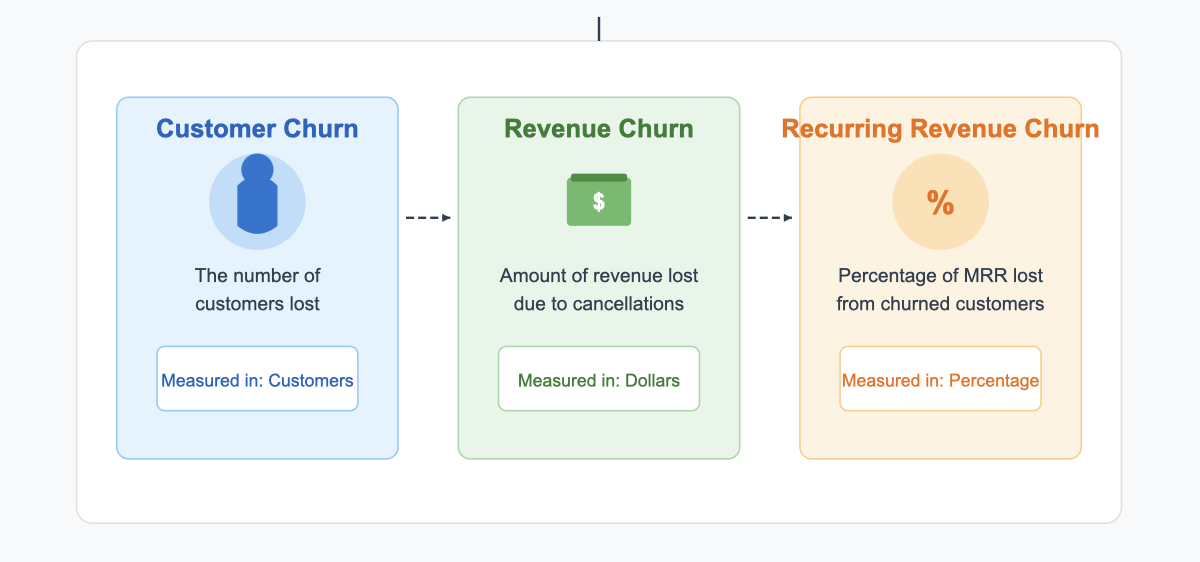
Churn Rate measures the percentage of customers who stop using your service over a given period. It’s a vital metric for understanding customer retention and satisfaction. A high churn rate often signals dissatisfaction with your product or service, while a low churn rate indicates strong customer loyalty.
To calculate churn rate:
For example, if you start the month with 1,000 customers and lose 50, your churn rate is 5%.
Churn can take different forms:
Tracking churn rate helps you identify areas for improvement. For instance, if churn spikes after a product update, you might need to address usability issues. By reducing churn, you can improve retention and drive long-term growth.
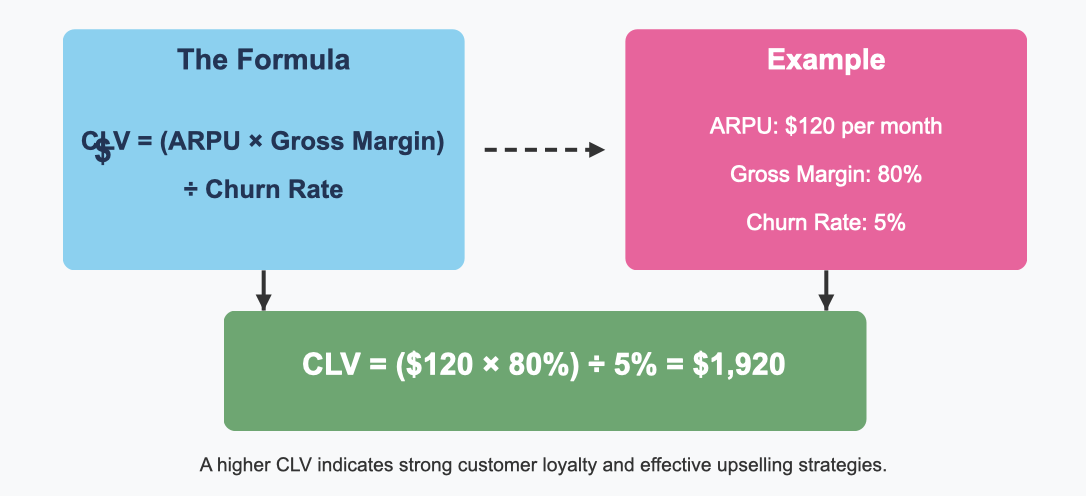
Customer Lifetime Value (CLV) is a critical metric in saas analytics. It measures the total revenue you can expect from a customer throughout their relationship with your business. Understanding CLV helps you evaluate the long-term profitability of your customer base and refine your acquisition and retention strategies.
To calculate CLV, you can use the formula:
CLV = (ARPU x Gross Margin) / Churn Rate
For example:
Using the formula, CLV = ($120 x 80%) / 5% = $1,920. This value represents the expected net profit from each customer. A higher CLV indicates strong customer loyalty and effective upselling strategies.
Tracking CLV allows you to identify which customer segments bring the most value. You can then focus on retaining these high-value customers. Additionally, comparing CLV with Customer Acquisition Cost (CAC) ensures your acquisition efforts remain profitable. For instance, if your CAC is $500 and your CLV is $1,920, your business is on a sustainable path.
Tip: Regularly monitor CLV to adapt your strategies and maximize customer profitability.
Net Promoter Score (NPS) measures customer satisfaction and loyalty by asking a simple question: "How likely are you to recommend our product to others?" Customers respond on a scale from 0 to 10, and their answers classify them into three groups:
To calculate NPS, subtract the percentage of detractors from the percentage of promoters. For example, if 60% of respondents are promoters and 20% are detractors, your NPS is 40. A higher NPS indicates stronger customer loyalty and satisfaction.
NPS provides valuable insights into your customer experience. By analyzing trends, you can identify areas for improvement. For instance, if your NPS drops after a product update, you might need to address usability issues. Additionally, segmenting NPS by customer cohorts helps you tailor your engagement strategies. For example, you can focus on converting passives into promoters by offering personalized incentives.
Note: Use NPS as a benchmark to track your progress and enhance customer loyalty over time.
Expansion revenue and upsell metrics measure your ability to grow revenue from existing customers. These metrics are essential in saas analytics, as they highlight the success of your upselling and cross-selling strategies.
Key metrics include:
| Metric | Description |
|---|---|
| Expansion MRR | Tracks the increase in Monthly Recurring Revenue from upgrades or upsells. |
| Net Dollar Retention (NDR) | Measures revenue retention and growth, factoring in churn and expansion revenue. |
To calculate NDR, consider:
For example, if your starting MRR is $50,000, expansion revenue is $10,000, and churned revenue is $5,000, your NDR is:
NDR = [(Starting MRR + Expansion Revenue - Revenue Lost from Churn) / Starting MRR] x 100
NDR = [(50,000 + 10,000 - 5,000) / 50,000] x 100 = 110%
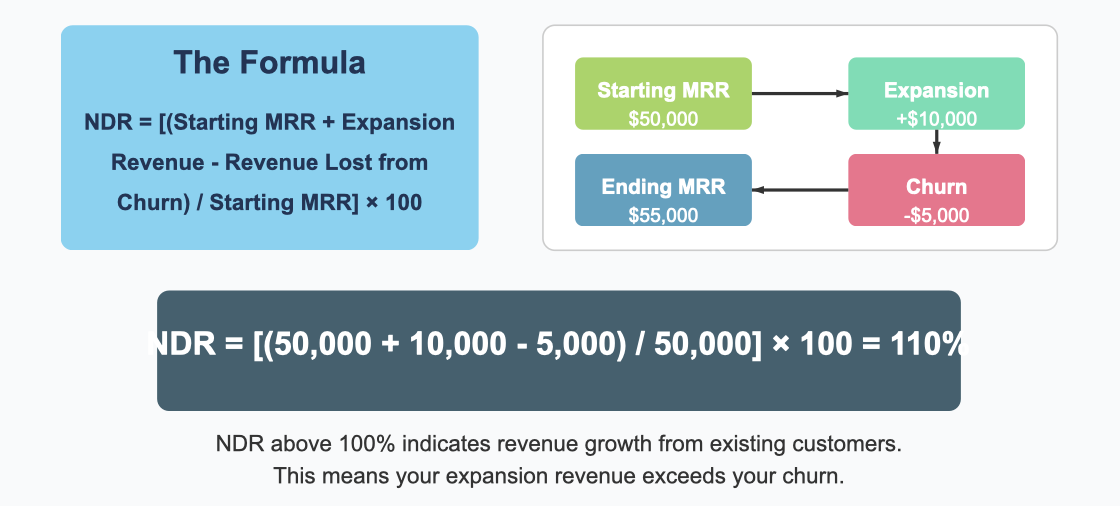
An NDR above 100% indicates that your expansion revenue offsets churn, leading to overall growth. This metric reflects the effectiveness of your customer success strategies.
Tip: Focus on upselling to high-value customers to maximize expansion revenue and improve NDR.
To implement SaaS analytics effectively, you must begin by defining clear goals. These goals should align with your business objectives and provide a roadmap for your analytics efforts. For example, if your aim is to improve customer retention, focus on metrics like churn rate and Net Promoter Score (NPS). Clear objectives ensure that your analytics efforts remain targeted and impactful.
For instance, a SaaS company aiming to boost revenue might prioritize tracking Monthly Recurring Revenue (MRR) and Customer Lifetime Value (CLTV). These metrics provide actionable insights into financial performance and customer behavior. By setting clear goals, you create a foundation for effective analytics implementation.
Tip: Regularly review your goals to ensure they remain relevant as your business evolves.
Selecting the right tools is crucial for successful SaaS analytics. Tools like FineBI and FineReport offer robust features tailored to SaaS businesses. When evaluating tools, consider the following criteria:
For example, FineBI excels in self-service analytics, allowing users to explore data independently. It supports integration with various data sources and provides real-time insights. FineReport, on the other hand, specializes in creating pixel-perfect reports and dashboards, making it ideal for detailed reporting needs.
You can try it out in the demo model below:
Additionally, consider the cost structure of the tools. Beyond the base cost, evaluate setup fees and usage-based charges. This ensures you select a solution that fits your budget without compromising on functionality.
Note: The right tool not only simplifies data analysis but also enhances decision-making across your organization.
Data collection and organization form the backbone of SaaS analytics. Start by gathering data from all relevant sources, such as CRM systems, marketing platforms, and customer support tools. Automated tools can streamline this process, reducing the risk of human error.
To ensure data quality:
For example, documenting all data sources and methods enhances transparency and ensures reliable analytics. Once collected, organize the data into a centralized system. Tools like FineBI simplify this process by integrating data from multiple sources and presenting it in an accessible format.
Analyzing the organized data helps you extract meaningful insights. Use visualization techniques to identify trends and patterns. For instance, tracking customer behavior over time can reveal opportunities for upselling or improving engagement strategies.
Tip: Regularly update your data collection methods to adapt to new business needs and technologies.

Analyzing data effectively allows you to uncover actionable insights that can transform your SaaS business. By focusing on key metrics, you can identify patterns and trends that drive decision-making. For instance, tracking metrics like churn rate, customer acquisition cost (CAC), monthly recurring revenue (MRR), and customer lifetime value (CLTV) provides a comprehensive view of your business performance.
| Metric | Description |
|---|---|
| Churn Rate | Percentage of customers or revenue lost over a specific period |
| Customer Acquisition Cost (CAC) | Cost associated with acquiring a new customer |
| Monthly Recurring Revenue (MRR) | Predictable revenue generated from subscriptions monthly |
| Customer Lifetime Value (CLTV) | Total revenue expected from a customer over their lifetime |
These metrics help you understand customer behavior, optimize marketing strategies, enhance product development, and improve customer retention. For example, analyzing churn rate can reveal why customers leave, enabling you to address their concerns proactively. Similarly, studying MRR trends helps you forecast revenue and plan for growth.
To derive actionable insights, you should segment your data by customer cohorts. This segmentation allows you to identify high-value customers and tailor your strategies to meet their needs. Additionally, using visualization tools like FineBI simplifies the process of interpreting complex data. These tools present data insights in an accessible format, making it easier to spot opportunities and challenges.
Tip: Regularly review your analytics to ensure your strategies remain aligned with your business goals. This practice keeps your SaaS business agile and responsive to market changes.

Once you have actionable insights, the next step is to create strategies that leverage these findings. SaaS analytics helps you interpret complex data and turn it into practical solutions. For example, analyzing customer acquisition channels can optimize your marketing efforts, while understanding customer usage patterns can guide product development.
Here are some ways to use analytics insights to drive measurable improvements:
For instance, if your analytics reveal a high churn rate among new users, you can implement onboarding programs to improve their experience. Similarly, tracking CLTV alongside CAC ensures your acquisition strategies remain profitable. By focusing on high-value customers, you can maximize revenue and reduce costs.
SaaS analytics also supports long-term planning. Historical data helps you predict future trends, enabling you to allocate resources effectively. For example, if your data insights indicate growing demand for a specific feature, you can prioritize its development to stay ahead of competitors.
Note: Align your strategies with your analytics findings to ensure they address real challenges. This approach enhances efficiency and drives sustainable growth.
SaaS businesses often face the challenge of managing vast amounts of data. With multiple sources generating information, it becomes difficult to identify what matters most. Prioritizing relevant data ensures that your analytics efforts focus on actionable insights rather than overwhelming details.
To manage data overload effectively, start by defining clear objectives. Identify the metrics that align with your business goals, such as churn rate or customer lifetime value. Use tools like FineBI to filter and visualize data, making it easier to spot trends. Additionally, segment your data by customer behavior or product usage. This approach helps you focus on specific areas that drive growth.

Automation also plays a key role. By automating data collection and reporting, you reduce manual effort and minimize errors. For example, setting up automated dashboards allows you to monitor key performance indicators in real time. This streamlines decision-making and ensures your team stays focused on priorities.
Accurate and consistent data forms the foundation of reliable SaaS analytics. Errors or inconsistencies can lead to flawed insights, impacting your decisions. To maintain data quality, implement best practices like regular audits and robust governance policies.
| Best Practice | Description |
|---|---|
| Data Quality Checks | Regularly check for and rectify errors to maintain data integrity. |
| Tracking Plan Document | Maintain a document that outlines data tracking processes. |
| Regular Audits | Conduct audits to ensure ongoing accuracy and consistency of data. |
| Robust Data Governance | Establish policies on data access, accuracy, and privacy. |
Effective governance ensures that your data remains reliable. For instance, setting clear policies on data access and privacy prevents unauthorized changes. Regular audits help you identify and correct discrepancies, ensuring your analytics reflect the true state of your business. By prioritizing accuracy, you build trust in your data and make better decisions.
Integrating analytics across teams fosters collaboration and improves decision-making. When departments work in silos, valuable insights often go unnoticed. Breaking down these barriers ensures that everyone benefits from shared data.
| Evidence Type | Description |
|---|---|
| Breaking Down Silos | Enhances collaboration by uniting departments, improving efficiency. |
| Leadership Insights | Provides leaders with a comprehensive view of departmental contributions. |
To achieve integration, encourage a data-driven culture. Provide training and resources to improve data literacy across teams. Tools like FineReport simplify data sharing, enabling departments to access and analyze information independently. This approach not only enhances collaboration but also aligns team efforts with business goals.
Building a unified analytics framework ensures that all teams contribute to your SaaS success. For example, marketing can use customer insights to refine campaigns, while product teams leverage usage data to improve features. By integrating analytics, you create a cohesive strategy that drives growth.
Adapting to changing business needs is essential for staying competitive in the SaaS industry. SaaS analytics provides the tools you need to keep pace with evolving demands. By analyzing customer behavior and performance metrics, you can identify trends and adjust your strategies to meet new challenges.
SaaS companies collect vast amounts of data from customer interactions. This data offers valuable insights into how users engage with your product. For example, tracking usage trends helps you understand which features customers value most. With this knowledge, you can prioritize updates that enhance user satisfaction. Additionally, analyzing performance metrics allows you to identify areas for improvement, ensuring your product remains relevant in a competitive market.
Customer feedback also plays a critical role in adapting your strategies. By integrating user feedback into your analytics, you can address customer concerns and refine your offerings. For instance, if customers frequently request a specific feature, adding it to your product roadmap can boost satisfaction and retention. This approach not only improves your product but also strengthens customer loyalty.

The flexibility of SaaS analytics enables you to respond quickly to market changes. Real-time data allows you to monitor shifts in customer behavior and adjust your strategies accordingly. For example, if you notice a decline in user engagement, you can investigate the cause and implement solutions immediately. This agility ensures your business stays aligned with customer needs and market trends.
Innovation is another key benefit of adapting SaaS analytics. By leveraging data insights, you can explore new opportunities and develop features that set your product apart. For example, analyzing customer usage patterns might reveal untapped markets or potential areas for expansion. This proactive approach positions your business for long-term growth.
Incorporating SaaS analytics into your decision-making process ensures you remain adaptable and customer-focused. By continuously monitoring data and responding to feedback, you can stay ahead of the competition and meet the ever-changing demands of the SaaS landscape.

FineBI demonstrates how you can use saas analytics to improve customer retention. By analyzing customer journey metrics, you gain insights into user behavior and identify areas for enhancement. For example, tracking metrics like Net Promoter Score (NPS) and Customer Satisfaction Score (CSAT) reveals how satisfied your customers are. These scores strongly correlate with retention rates, helping you understand the health of your customer relationships.
FineBI enables you to segment your users based on their engagement levels. This segmentation allows you to focus on at-risk users and implement targeted campaigns to retain them. For instance, you can offer personalized incentives or address specific pain points to persuade these users to stay. Measuring the effectiveness of these campaigns ensures that your strategies actively reduce churn rates while fostering loyalty.
| Evidence Type | Description |
|---|---|
| Customer Retention | Analyzing customer journey metrics and integrating feedback enhances user experience, fostering loyalty and engagement. |
| Churn Reduction | Targeted campaigns based on churn data help retain at-risk users, actively reducing churn rates. |
FineReport showcases how you can optimize pricing strategies to maximize revenue and improve retention. By leveraging its advanced reporting capabilities, you can analyze the impact of different pricing models on customer behavior. For example, per-active-user pricing encourages long-term commitment by aligning costs with actual usage. This approach ensures fairness and transparency, which strengthens customer trust.
FineReport’s detailed dashboards allow you to monitor the performance of your pricing strategies in real time. You can identify trends, such as which pricing tiers attract the most customers or which discounts drive the highest conversions. These insights help you refine your pricing models to meet customer expectations while maintaining profitability. With FineReport, you can create a balanced pricing strategy that supports sustainable growth.

FineChatBI highlights the power of predictive analytics in reducing churn. By analyzing historical data, you can identify patterns that indicate when customers are likely to leave. For example, a sudden drop in usage or negative feedback might signal dissatisfaction. FineChatBI uses this data to predict churn risks, enabling you to take proactive measures.
With FineChatBI, you can implement a complete data analysis loop. This loop guides you from descriptive analytics, which explains past behavior, to prescriptive analytics, which suggests actionable solutions. For instance, if the system predicts a high churn risk for a specific user segment, you can launch targeted retention campaigns. These campaigns might include personalized offers or enhanced support services to address customer concerns.
FineChatBI’s ability to combine rule-based and large models ensures precision in its predictions. This accuracy allows you to focus your efforts where they matter most, reducing churn rates and improving customer satisfaction.
FineVis transforms how you visualize and interpret data in your SaaS business. Its advanced features allow you to create dynamic dashboards and interactive charts that simplify complex datasets. By using FineVis, you can uncover trends and patterns that might otherwise go unnoticed. This capability ensures you make informed decisions based on clear and actionable insights.
One of FineVis’s standout features is its zero-code interface. You can build dashboards and visualizations without needing technical expertise. Simply drag and drop elements to create charts, graphs, or even 3D visualizations. This accessibility empowers every team member, from marketing to product development, to explore data independently. For example, a sales team can track customer acquisition trends, while a product team can monitor feature usage.
You can try it out in the demo model below:
FineVis also supports real-time analytics, which is crucial for SaaS businesses. You can monitor key metrics like churn rate or Monthly Recurring Revenue (MRR) as they update. This real-time capability helps you respond quickly to changes in customer behavior or market conditions. For instance, if you notice a sudden drop in user engagement, you can investigate and address the issue immediately.
Another advantage of FineVis is its adaptability across devices. Whether you’re using a smartphone, tablet, or desktop, FineVis ensures seamless access to your dashboards. This flexibility allows you to stay connected to your analytics wherever you are. Additionally, its industry-specific solutions cater to sectors like manufacturing, healthcare, and logistics, making it a versatile tool for diverse SaaS applications.
FineVis doesn’t just present data; it tells a story. Its customizable dashboards let you highlight the most critical insights for your business. You can use features like interactive maps or Sankey diagrams to visualize customer journeys or revenue flows. These visualizations make it easier to communicate findings to stakeholders and align your team around shared goals.
By leveraging FineVis, you enhance your SaaS analytics capabilities. Its intuitive design, real-time updates, and advanced visualization tools ensure you extract maximum value from your data. This approach not only improves decision-making but also strengthens your competitive edge in the SaaS market.
SaaS analytics transforms how you manage your subscription-based business. It provides actionable insights into key metrics like Monthly Recurring Revenue (MRR), Customer Acquisition Cost (CAC), and Customer Lifetime Value (CLTV). These metrics help you optimize marketing, improve retention, and predict growth.
| Metric | Description |
|---|---|
| Monthly Recurring Revenue (MRR) | Tracks predictable, recurring income generated each month, indicating growth potential. |
| Customer Acquisition Cost (CAC) | Measures the cost to acquire a new customer, essential for optimizing marketing efforts. |
| Customer Lifetime Value (CLTV) | Predicts total revenue a customer brings throughout their relationship, guiding retention strategies. |
Adopting SaaS business intelligence tools like FineBI, FineReport, FineVis, and FineChatBI empowers you to make informed decisions. These tools enhance data analytics, improve customer experiences, and drive sustainable growth. By leveraging these solutions, you can stay competitive in the dynamic B2B SaaS landscape.
Click the banner below to try FineBI for free and empower your enterprise to transform data into productivity!
Why Care About Data Platforms? Find Out Here!
Understanding Descriptive Analytics: What It Is and How It Works
Step-by-Step Guide to Setting Up a Data Analytics Framework
Write a Killer Visual Analysis Essay in 2025!
Descriptive Analytics Unlocked: Turn Numbers into Insights
Sales Analytics in 2025: Why It’s a Must-Have!
1. What is SaaS analytics?
SaaS analytics involves collecting and analyzing data specific to subscription-based businesses. It helps you track metrics like Monthly Recurring Revenue (MRR) and Customer Lifetime Value (CLTV) to improve decision-making, customer retention, and revenue growth.
2. Why is churn rate important in SaaS analytics?
Churn rate measures the percentage of customers who stop using your service. It helps you identify retention issues and improve customer satisfaction. Lower churn rates indicate stronger loyalty and better engagement.
3. How can SaaS analytics improve customer retention?
SaaS analytics tracks metrics like Net Promoter Score (NPS) and churn rate. These insights help you identify at-risk customers and implement targeted strategies, such as personalized offers or improved onboarding, to retain them.
4. What tools are best for SaaS analytics?
Tools like FineBI, FineReport, and FineChatBI provide advanced features for data visualization, reporting, and predictive analytics. They simplify data analysis and help you make informed decisions to drive growth.
5. How do you calculate Customer Lifetime Value (CLTV)?
Use the formula:
CLTV = (ARPU x Gross Margin) / Churn Rate
This calculation helps you estimate the total revenue a customer generates during their relationship with your business.
6. Can SaaS analytics predict future trends?
Yes, SaaS analytics uses historical data to forecast trends. It helps you anticipate customer needs, market changes, and revenue opportunities, enabling proactive decision-making.
7. What is the difference between MRR and ARR?
Monthly Recurring Revenue (MRR) tracks predictable monthly income, while Annual Recurring Revenue (ARR) provides a yearly perspective. Both metrics help you monitor financial health and forecast growth.
8. How does SaaS analytics support marketing strategies?
SaaS analytics evaluates metrics like Customer Acquisition Cost (CAC) and conversion rates. These insights help you optimize campaigns, allocate budgets effectively, and attract high-value customers.

The Author
Lewis
Senior Data Analyst at FanRuan
Related Articles
Data Analyst Dashboard: A Scenario-Based Guide to KPI Views That Drive Better Business Decisions
Learn how data analyst dashboards turn raw data into actionable KPI views for operational, analytical, and strategic decisions. Drive better business outcomes.
Lewis Chou
May 03, 2026

Self-Service Analytics Defined and Why You Need It
Self-service analytics lets you analyze data without IT help, empowering faster, data-driven decisions and boosting agility for your business.
Lewis
Jan 04, 2026

Best Self-Service Tools for Analytics You Should Know
See which self-service tools for analytics let business users access data, build dashboards, and make decisions faster—no IT help needed.
Lewis
Dec 29, 2025


