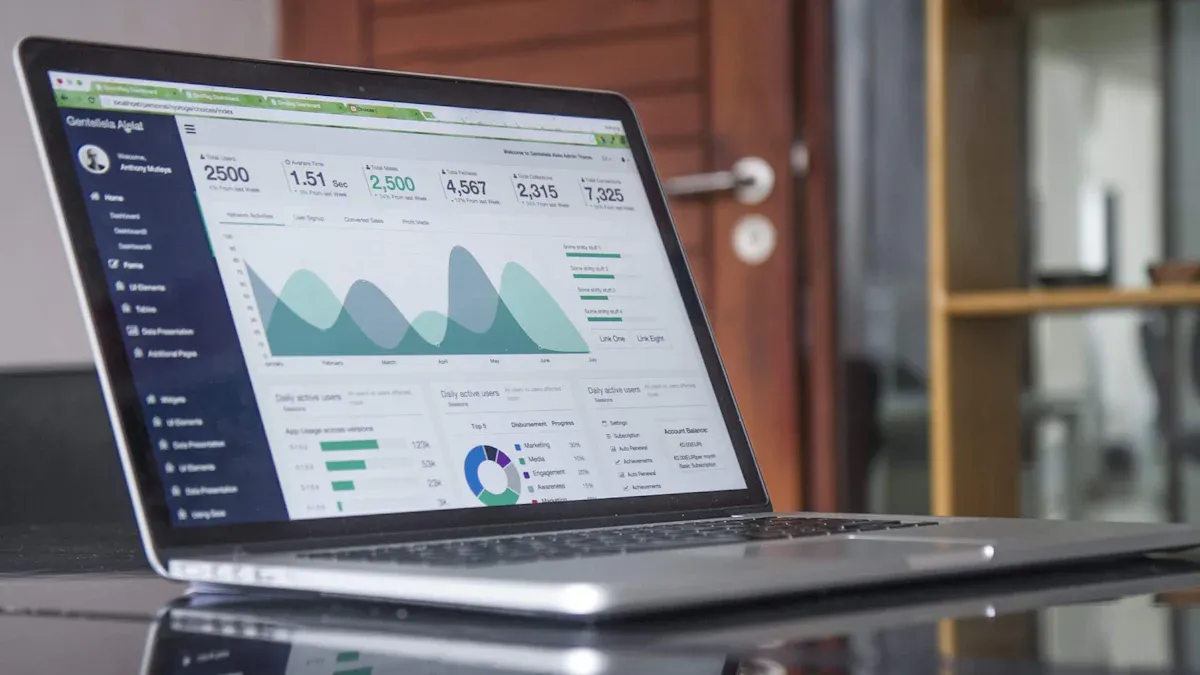
SaaS business intelligence gives you the power to analyze and visualize data using cloud-based tools. You gain the ability to access insights anytime, anywhere, without managing complex infrastructure. This approach helps you make informed decisions quickly and efficiently.
Many organizations struggle with data fragmentation, integration complexity, and security vulnerabilities. SaaS business intelligence addresses these challenges by unifying data, streamlining workflows, and strengthening compliance. FineBI stands out as a leading BI solution that helps you overcome these obstacles and unlock the true value of your business data.

SaaS business intelligence is a cloud-based software solution that helps you analyze data, generate reports, and gain actionable insights. You access these tools through web applications, which means you do not need to install complex software or invest in expensive hardware. SaaS business intelligence platforms let you connect to many data sources, process information, and visualize results in dashboards. You can use these tools from anywhere with an internet connection.
Industry analysts define SaaS business intelligence as a solution that gives organizations robust analytics capabilities without the burden of maintaining infrastructure. You can focus on data analysis and business insights instead of worrying about technical details. The architecture of SaaS business intelligence platforms includes several core components:
| Core Component | Description |
|---|---|
| Data Sources and Data Integration | You connect to internal and external data sources. Integration ensures consistency and reliability. |
| Data Warehousing and Storage | The platform stores structured and unstructured data for reporting and analysis. |
| Data Processing and Management | Data cleansing, aggregation, and transformation prepare your data for analysis. |
| Reporting and Visualization Tools | Dashboards and self-service BI tools help you explore and present data insights. |
FineBI is a modern example of business intelligence tool. It allows you to connect to over 60 data sources, prepare and process data, and create interactive dashboards. You can use drag-and-drop features to build visualizations and share insights across your organization.
You may wonder how SaaS business intelligence compares to traditional business intelligence tools. The differences are clear when you look at deployment speed, cost, scalability, and flexibility.
| Feature | SaaS BI Solution | Classical BI Systems |
|---|---|---|
| Implementation time | Days | 6–12 months |
| Cost | 10x cheaper, no infra overhead (cloud cost management) | $1M+ build + $15–20K/month support |
| Deployment Speed | SaaS BI Solution | Classical BI Systems |
|---|---|---|
| Setup | Quick and easy: Minimal IT involvement. You can start in hours or days. | Lengthy and complex: Weeks or months. Requires dedicated IT resources. |
SaaS business intelligence tools set up quickly. You do not need to wait for long installations or complex configurations. Maintenance and updates happen automatically, so you always use the latest features. You save money because you do not need to buy servers or pay for ongoing support.
SaaS business intelligence platforms offer strong scalability and flexibility:
Traditional BI tools often struggle with scalability. Performance drops as data volumes increase. Costs rise quickly, and you may need more IT support.
SaaS business intelligence tools operate fully in the cloud. You can grow your data usage instantly. The system keeps dashboards responsive and insights current. You maintain strong user adoption and keep costs low.
SaaS business intelligence helps you make faster, smarter decisions. You get real-time insights from live dashboards. You respond immediately to changes in performance. Predictive and prescriptive analytics let you forecast outcomes and choose the best actions. Automation reduces human errors, so you trust your data.
Centralized data gives you a single source of truth. Your departments align on key metrics, which improves accountability. You eliminate manual reporting, saving time and money. You track key performance indicators and solve problems before they grow.
SaaS business intelligence supports many use cases for small and medium-sized enterprises:
FineBI is a leading business intelligence platform. It empowers you to connect, analyze, and share data across your organization. You transform raw data into valuable insights. You track KPIs, identify trends, and predict future outcomes. FineBI boosts your data analysis efficiency and supports real-time analysis, helping you make data-driven decisions.
SaaS business intelligence changes how you use data. You move from slow, manual processes to fast, automated analytics. You gain the flexibility to adapt as your business grows. You unlock the full value of your data and drive better business outcomes.
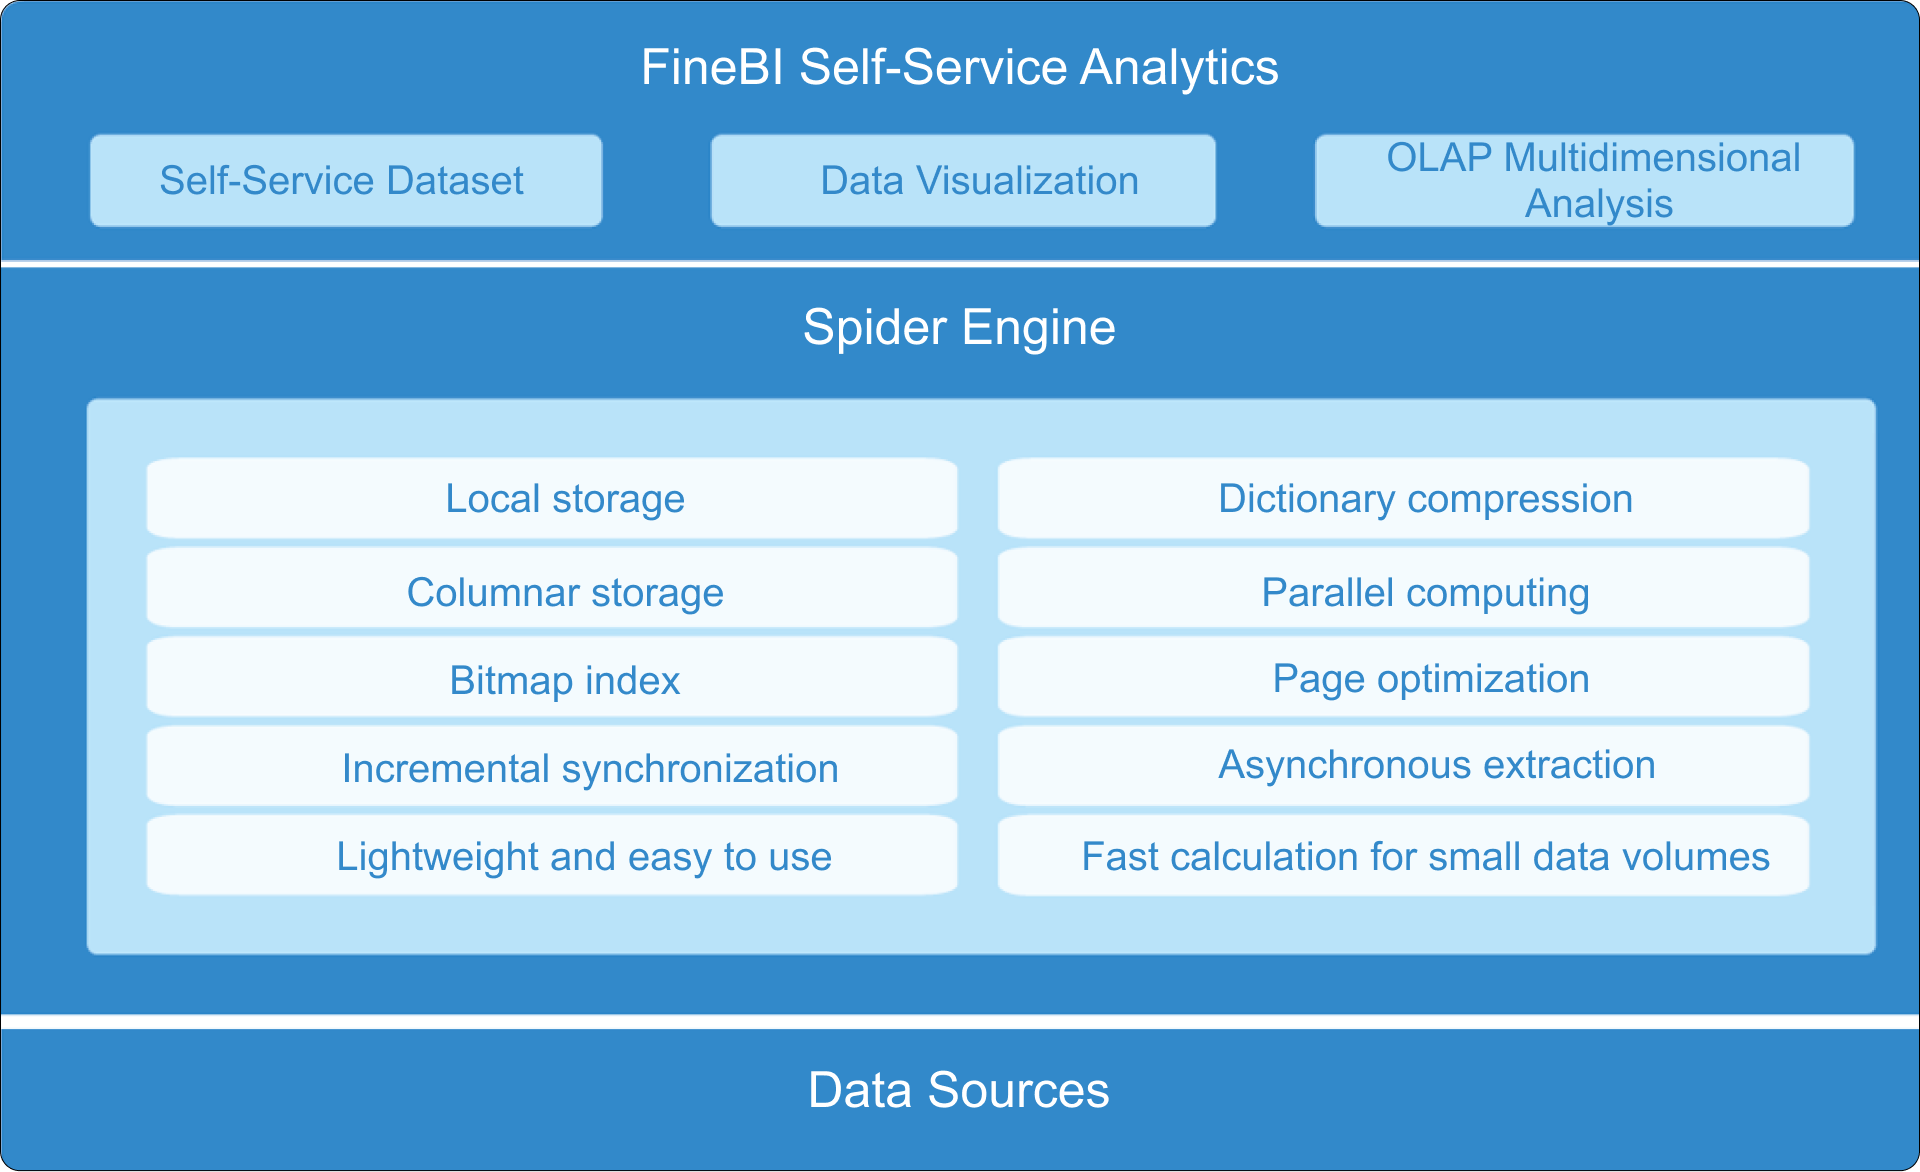
SaaS business intelligence platforms follow a clear workflow that helps you turn raw data into actionable insights. You start by integrating and processing data from many sources. You then explore and visualize this data to uncover trends and patterns. Finally, you publish dashboards and manage governance to ensure secure sharing and compliance. FineBI provides a strong example of this workflow, making each stage simple and effective for your business.
You begin your SaaS business intelligence journey with data integration. This step connects your business to a wide range of data sources, such as customer relationship management programs, enterprise resource planning systems, databases, data warehouses, analytics systems, and other business applications. FineBI supports connections with over 30 big data platforms and SQL data sources, giving you flexibility and reach.
The main stages of data integration and processing include:
| Stage | Description |
|---|---|
| Data Integration | Connect to diverse sources, including cloud and on-premises systems, to unify your business data. |
| Data Management | Organize data using a folder-based approach, which helps you classify information by business subject. |
| Data Visualization | Model data based on warehouse relationships, preparing it for deeper analysis and visualization. |
You extract, transform, and load data to prepare it for analysis. Extraction pulls data from different systems. Transformation cleans and standardizes the data, making it consistent and reliable. Loading brings the processed data into the SaaS platform, ready for further exploration.
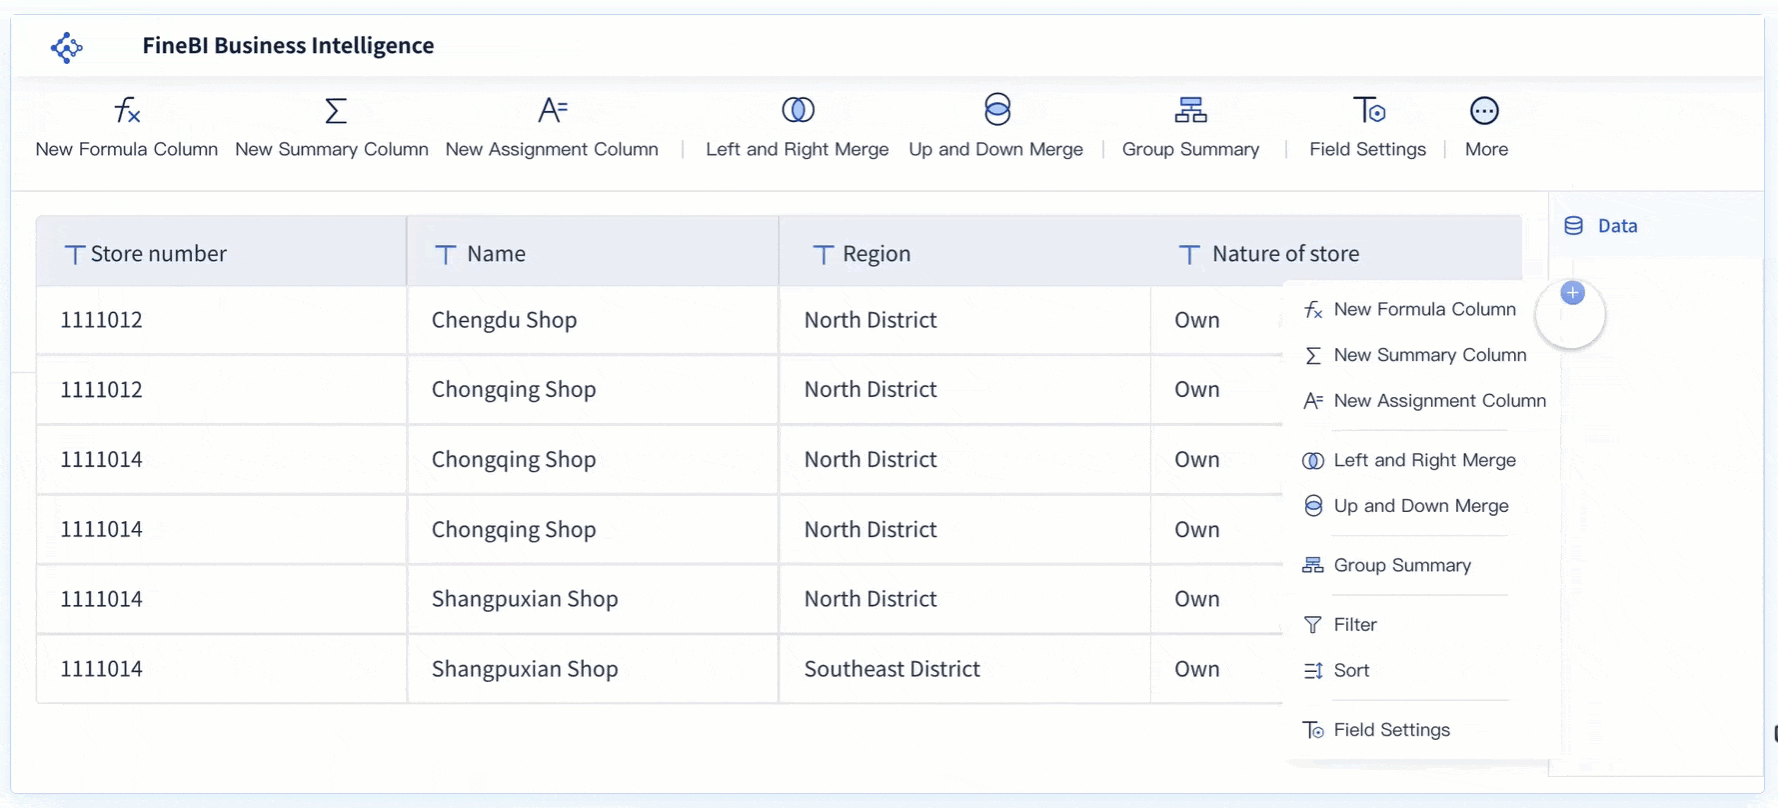
FineBI streamlines this process. You can connect to over 60 data sources, including files and APIs. You can upload Excel or CSV files, or fetch real-time data from web APIs. FineBI also supports advanced connections through JDBC, ODBC, and SDKs, so you can integrate legacy systems or custom business applications. This flexibility ensures you always have the data you need for business analytics.
Tip: Organizing your data by business package subjects in FineBI makes it easier to manage and understand, especially as your organization grows.

Once you have integrated and processed your data, you move to visualization and exploration. Business intelligence platforms like FineBI make this step accessible to everyone in your business, not just technical users.
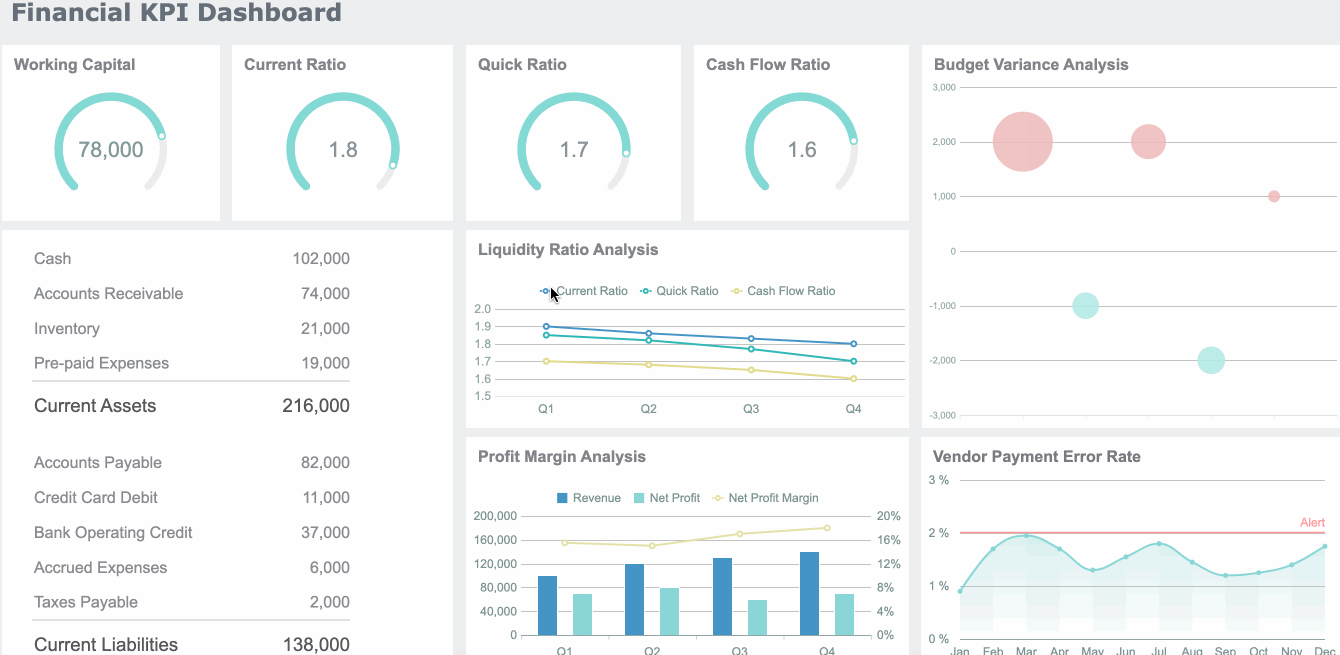
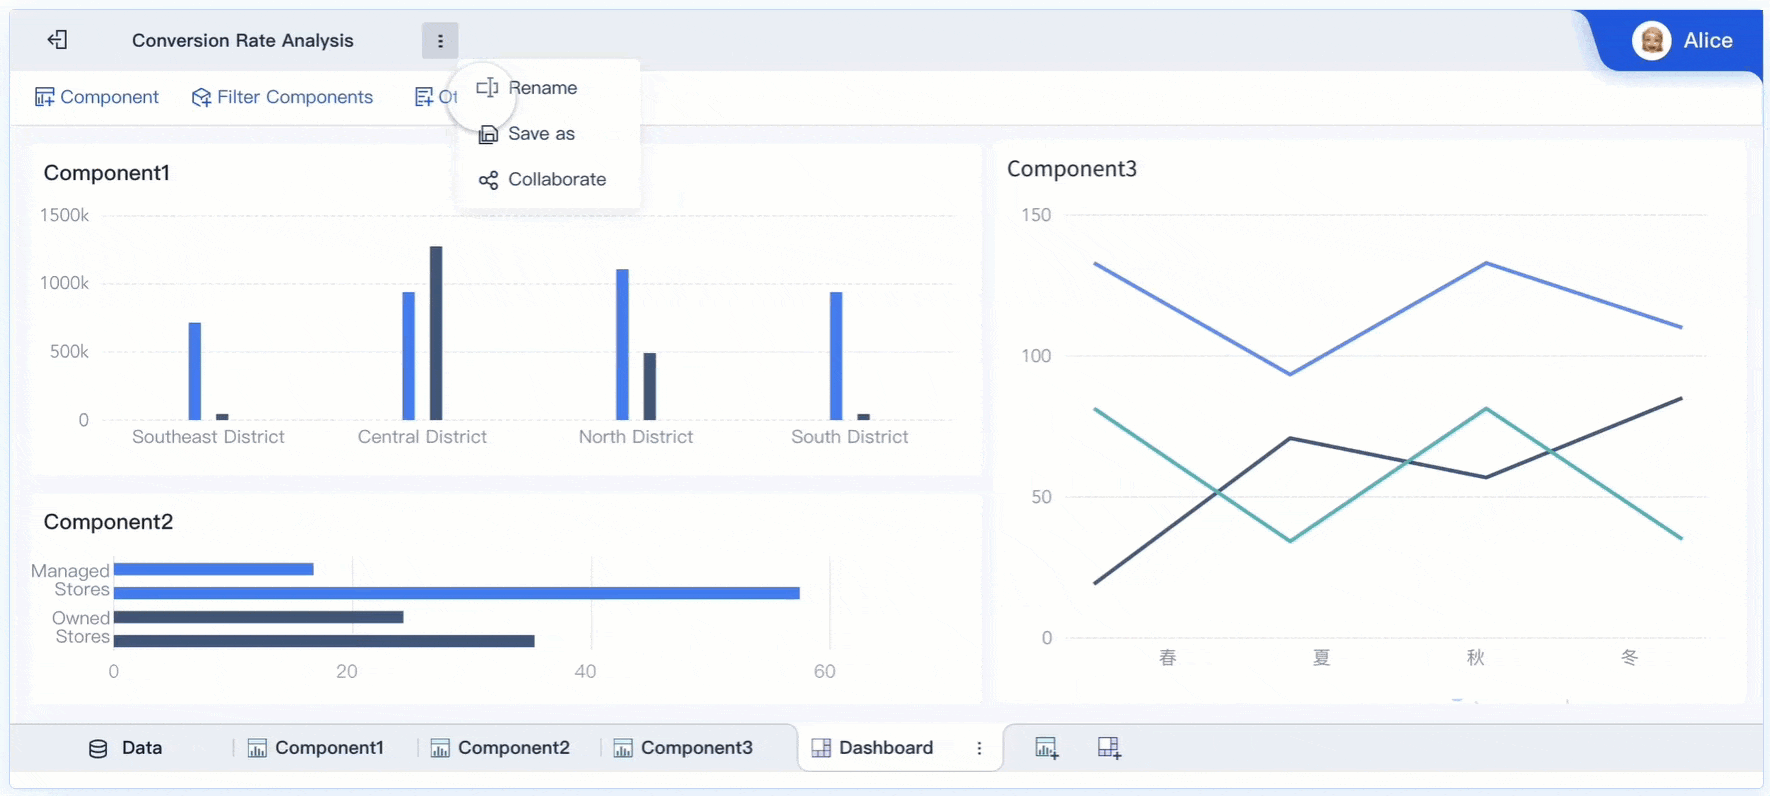
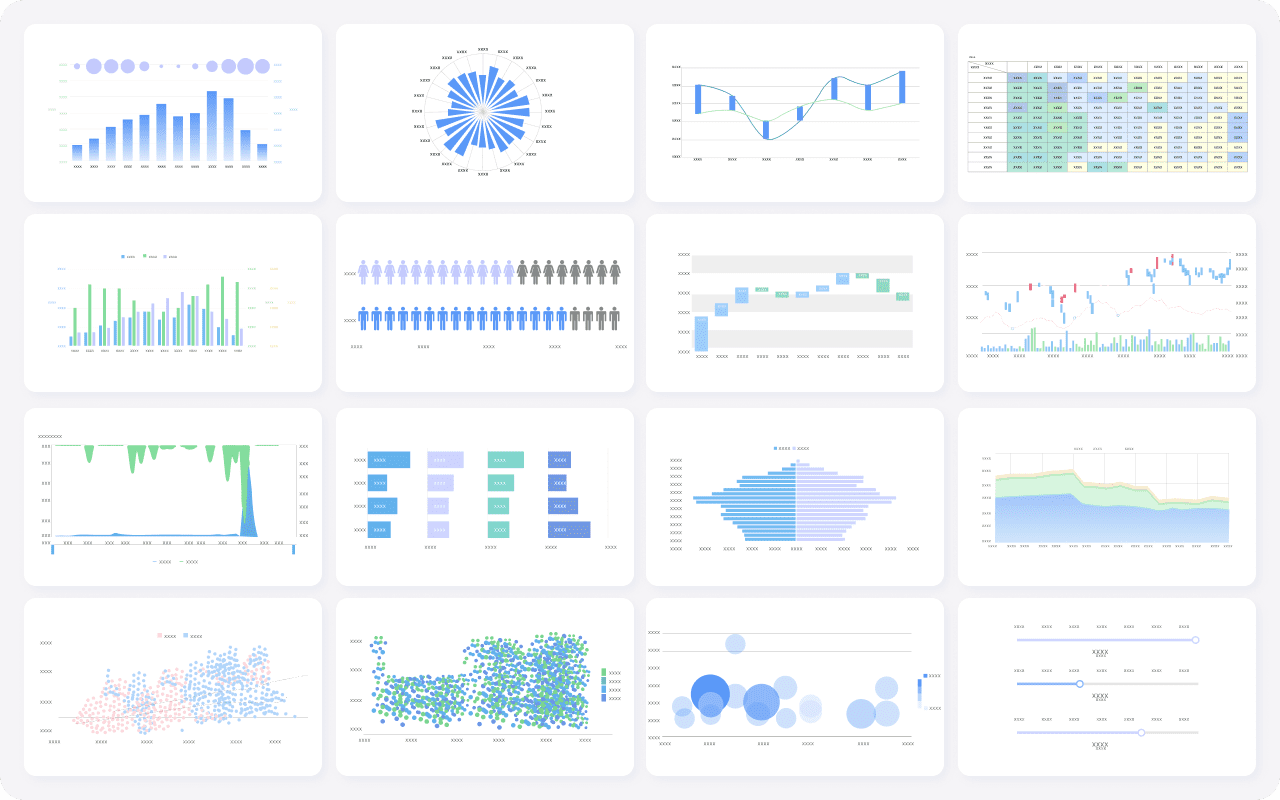
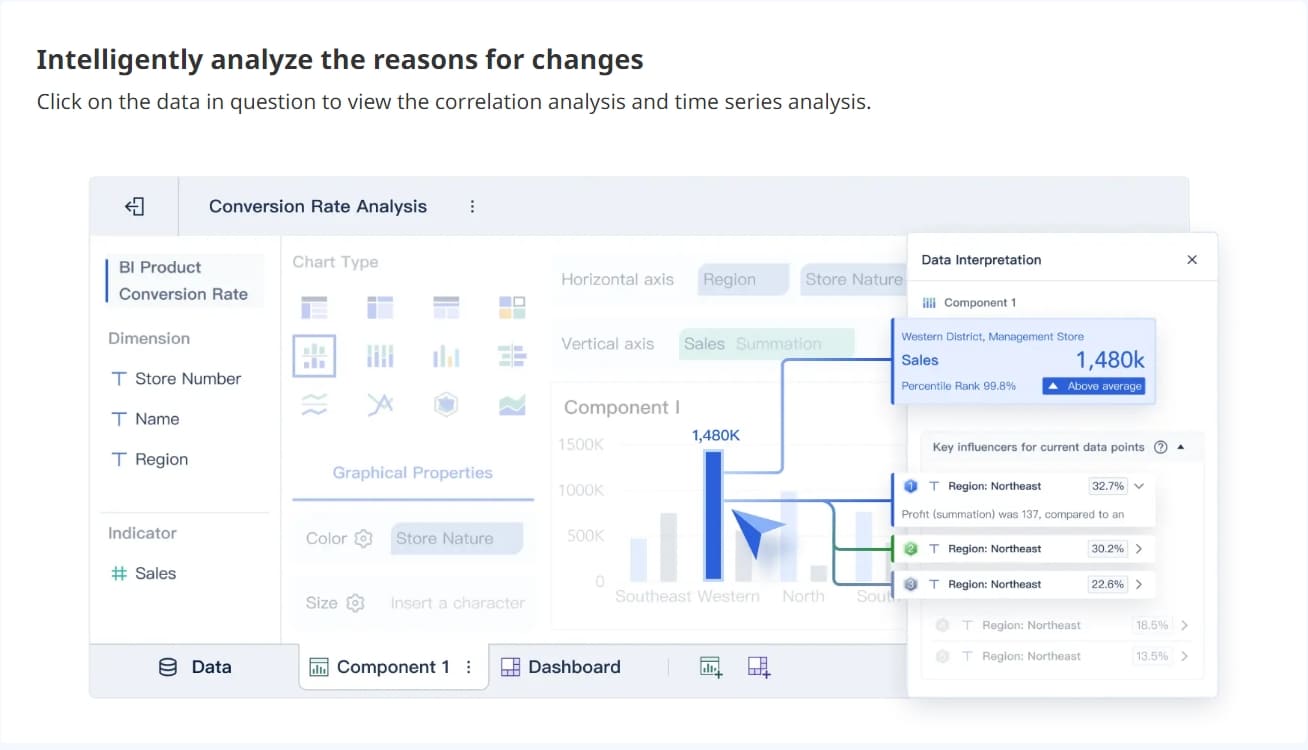
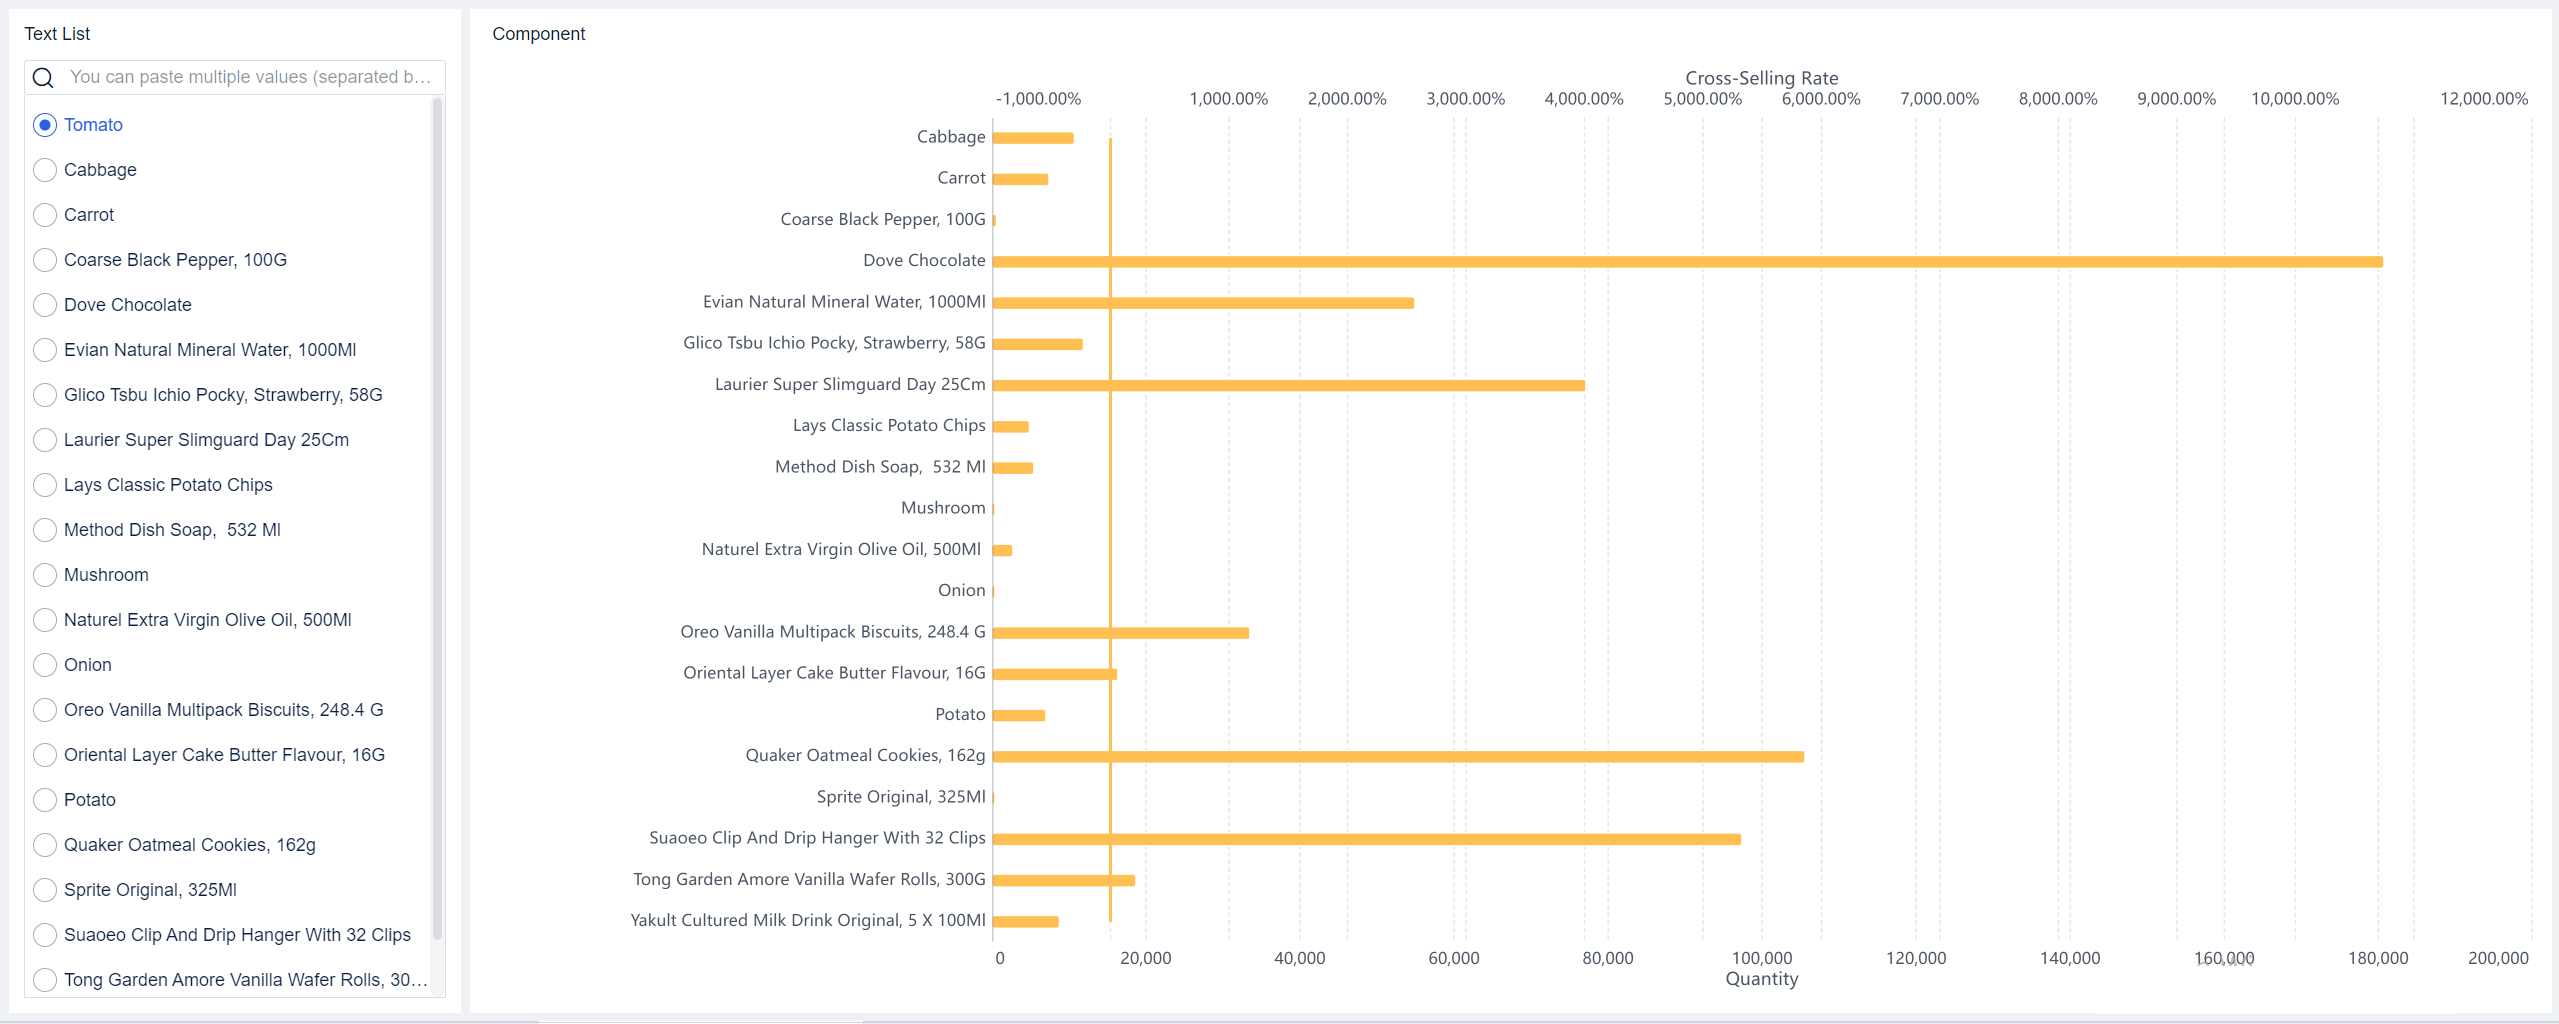
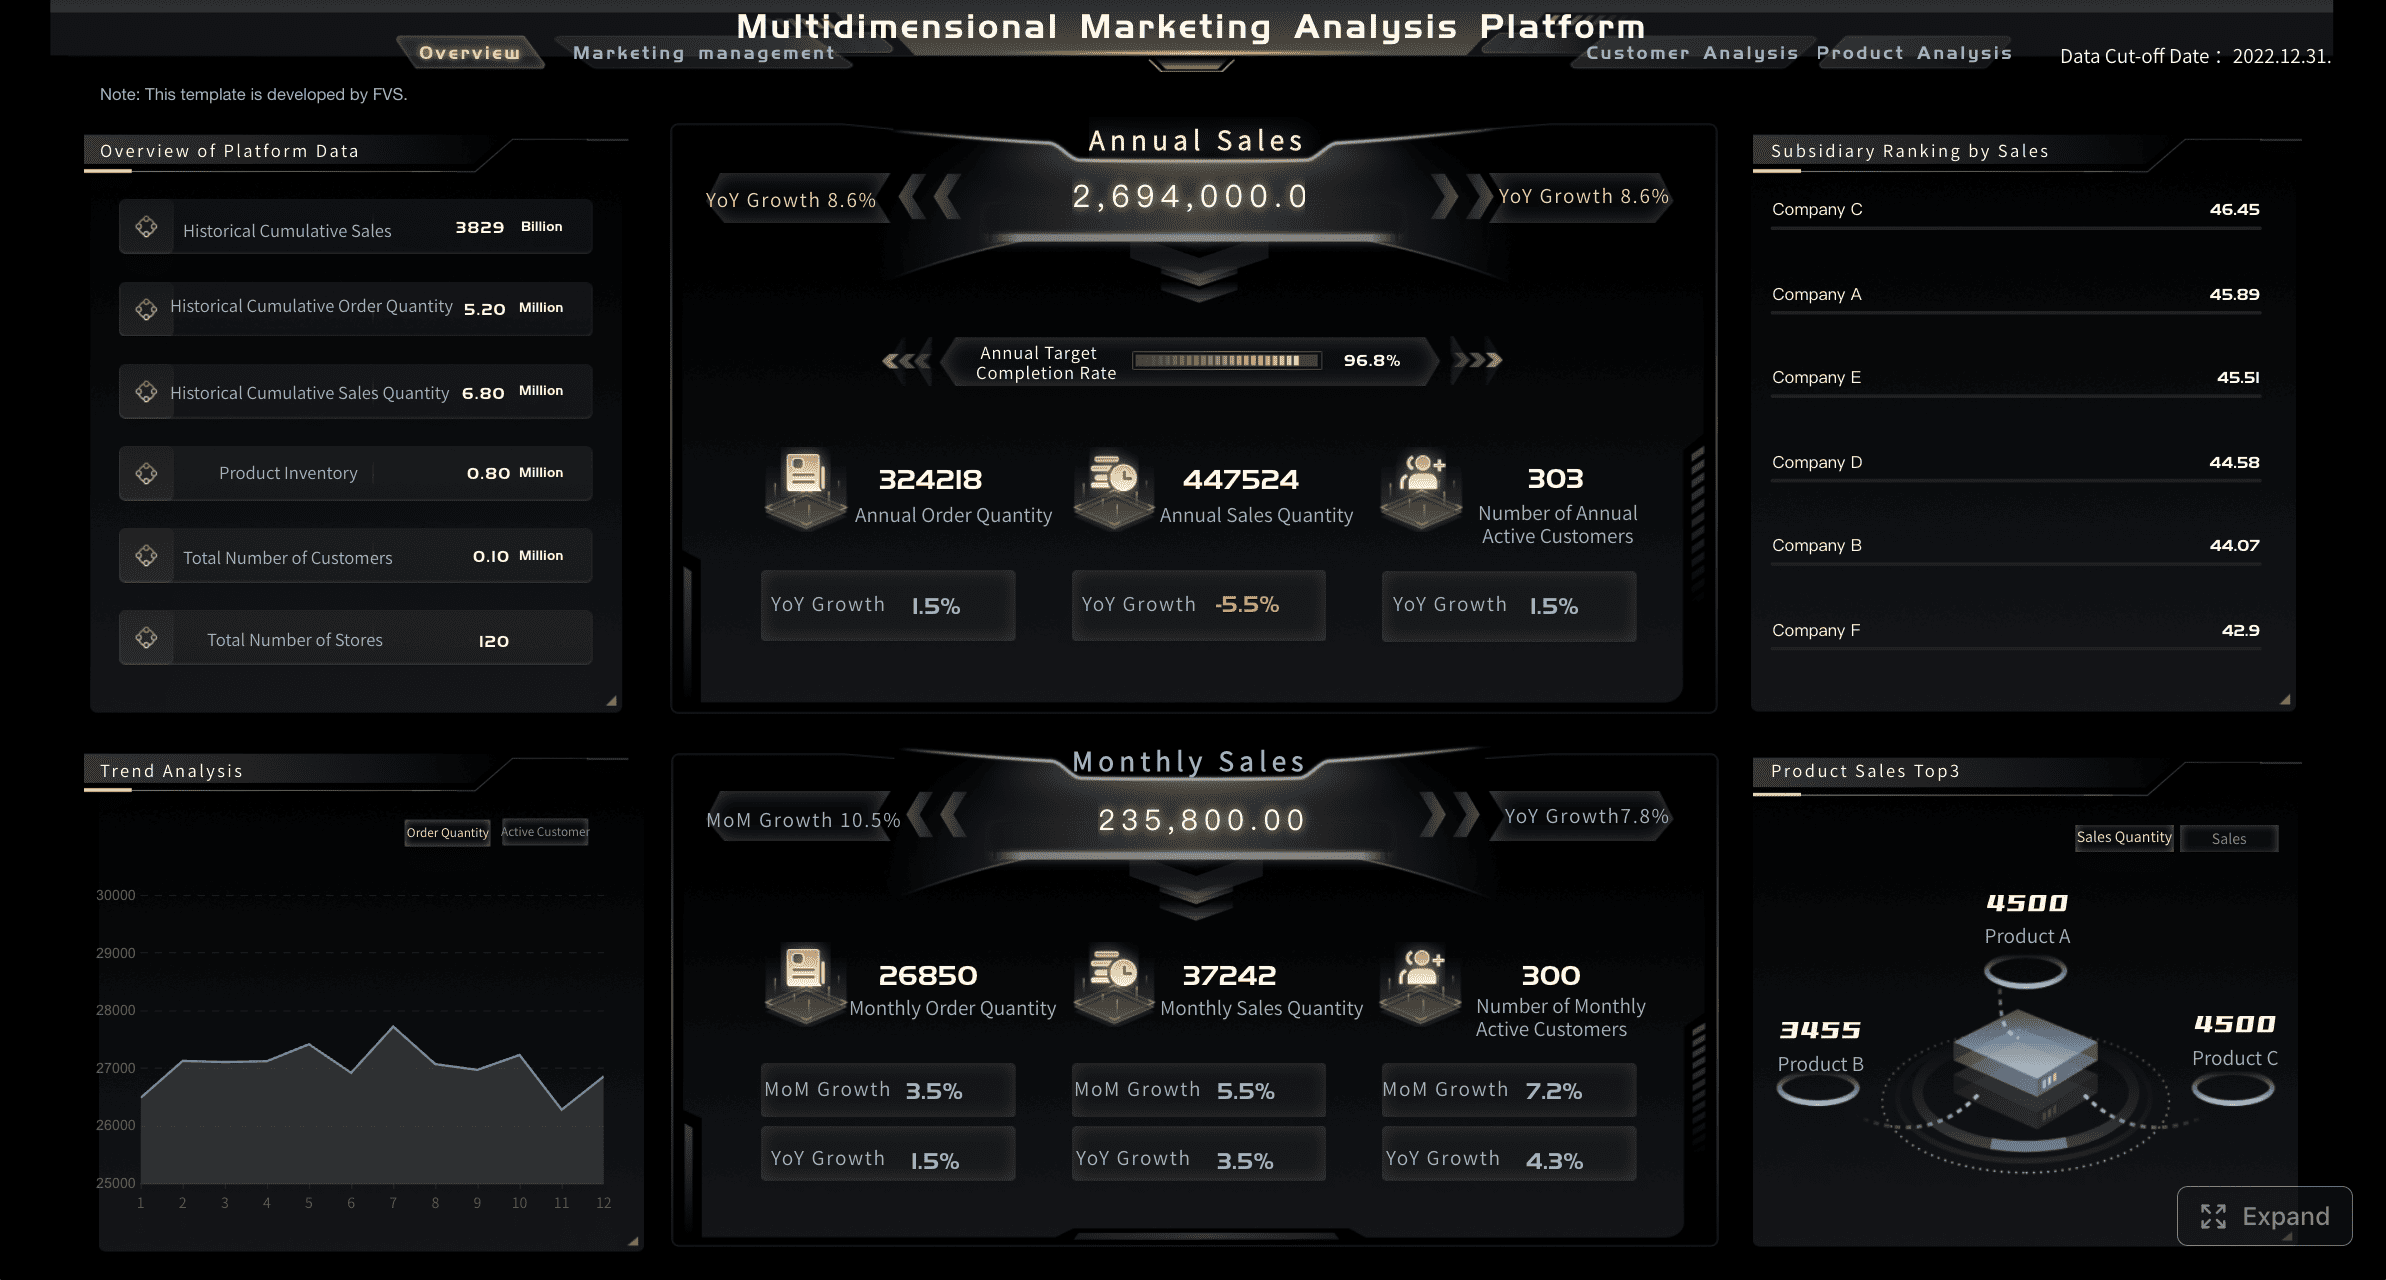
You use intuitive interfaces to interact with your data. FineBI offers a drag-and-drop dashboard editor, so you can build and customize dashboards without IT support. You can create compelling visuals, such as bar charts, line graphs, maps, and pivot tables. These visuals help you understand complex data and make faster decisions.
| Best Practice | Impact on User Experience |
|---|---|
| Optimize user experience | Unlocks engagement and understanding |
| Create compelling visuals | Produces digestible insights for informed decisions |
| Follow a six-step process | Elevates quality and impact of visuals |
You benefit from features like real-time filtering, drill-down analysis, and interactive dashboards. These tools let you explore data from different angles and uncover hidden trends. FineBI also supports natural language queries, so you can ask questions in plain English and receive immediate visual responses. This approach democratizes data analytics, enabling everyone in your organization to participate in data-driven decision-making.
FineBI's visual exploration tools help you transform raw data into actionable insights. You can save reusable templates, apply filters, and share dashboards with your team. This process turns data analysis into a collaborative and dynamic experience.
The final stage in the business intelligence workflow is publishing and governance. You need to share insights securely and ensure compliance with business policies. FineBI makes this process straightforward and robust.
You can publish dashboards and reports to specific users or groups. FineBI supports role-based access control, so only authorized users can view or edit sensitive data. The platform tracks user activity and provides audit logs, which help you monitor data usage and maintain accountability.
Business intelligence platforms use different governance models to manage data publishing:
| Governance Model | Description | Best For | Strengths | Risks |
|---|---|---|---|---|
| Centralized Model | A single team sets policy and enforces controls across the enterprise. | Highly regulated environments, public sector, companies needing uniform controls | Consistent policies, faster regulatory alignment | Slower domain-specific changes, bottlenecks |
| Decentralized Model | Each unit governs its own data domain with minimal oversight. | Diversified conglomerates, organizations prioritizing local agility | Speed, autonomy, closer fit to local processes | Policy drift, duplicate definitions |
| Federated Model | Central authority defines common policies; local teams implement governance. | Mid- to large-sized organizations needing consistency and local nuance | Shared standards with room for domain specifics | Requires clear decision rights, potential fragmentation |
You can choose the model that fits your business needs. FineBI supports centralized, decentralized, and federated governance, giving you flexibility as your organization evolves.
To ensure secure data publishing and sharing, SaaS platforms use strong encryption protocols, role-based access controls, and compliance with industry standards like ISO 27001 and SOC 2. FineBI follows these best practices, so you can trust your data remains protected.
Note: Frameworks such as the Data Management Body of Knowledge (DMBOK), COBIT, and the Data Governance Institute (DGI) Framework provide guidance for building strong governance in SaaS business intelligence.
By following this workflow—data integration and processing, visualization and exploration, and publishing and governance—you unlock the full value of your business data. Business intelligence platforms like FineBI help you gain real-time insights, drive better decisions, and foster a data-driven culture across your organization.
SaaS business intelligence gives you the power to explore and analyze data without waiting for IT support. You can access data from many sources and create your own dashboards. Most platforms show that only a small percentage of users perform true self-service analytics, but the impact is significant. You can:
These features help you turn raw data into actionable insights. You gain the flexibility to answer business questions quickly.
SaaS business intelligence platforms deliver real-time data insights to distributed teams. You can see the latest information as soon as it becomes available. The following table shows how these features benefit your business:
| Feature | Benefit |
|---|---|
| Real-time data access | Access current data immediately, eliminating delays in decision-making. |
| Customizable dashboards | Tailor insights to your needs, making analysis more relevant. |
| Self-service capabilities | Generate reports and insights without IT support. |
| Collaborative sharing | Distribute insights securely and control access. |
| Real-time collaboration | Work together on analysis projects for better decisions. |
| Continuous monitoring | Move from periodic reporting to ongoing analysis, spotting opportunities and issues faster. |
Modern SaaS business intelligence tools make teamwork easier. You can share data, dashboards, and reports with your team. Collaboration happens inside the platform or through tools like Slack or Teams.
Security and governance are essential in SaaS business intelligence. Leading platforms hold certifications such as SOC 2, ISO/IEC 27001, CSA STAR, HIPAA, PCI DSS, and GDPR compliance. You benefit from:
SaaS business intelligence platforms use data catalogs, classification tools, and access management to keep your data safe and compliant.
FineBI stands out among business intelligence tools. You can connect to over 60 data sources, process large datasets, and build dashboards with a drag-and-drop interface. FineBI supports real-time analysis and collaboration, making it easy for you to share data insights across your organization. Large enterprises, such as those in biotechnology, have used FineBI to improve operational efficiency and drive digital transformation. FineBI's high-performance engine and flexible governance help you scale your business analytics as your needs grow.
Selecting the best SaaS business intelligence tool for your organization requires careful evaluation. You should focus on criteria that match your business needs and future growth. Consider the following factors:
| Criteria | Description |
|---|---|
| Deployment Options | Choose a solution that fits your compliance and cloud requirements. |
| Security | Look for certifications like SOC 2, GDPR, and HIPAA. |
| Scalability | Ensure the tool can handle more users and data as your business grows. |
| User Experience | Select a platform with an intuitive interface for easy access to insights. |
| Reporting Capabilities | The tool should deliver actionable insights, not just data presentation. |
| Data Visualization | Clear and interpretable visuals help you understand trends quickly. |
| Maintenance | Automated updates and user management simplify ongoing use. |
| Implementation Speed | Fast deployment and self-service options reduce time to value. |
FineBI meets these criteria by offering strong security, seamless integration, and user-friendly dashboards. You can scale your data analysis as your business expands.
A structured approach helps you achieve a smooth SaaS business intelligence rollout. Follow these steps:
FineBI supports these steps with robust integration and training resources, making your transition to cloud analytics easier.
You may face obstacles during SaaS business intelligence deployment. Common issues include unclear objectives, data migration problems, integration difficulties, and user resistance. To overcome these:
FineBI addresses these challenges with flexible integration, strong security, and user-friendly features.
SaaS business intelligence transforms how you approach data across industries. You can track key performance indicators and other metrics to understand business performance. Many organizations use SaaS BI to accelerate decision-making by providing comprehensive views of data. You optimize business processes and increase productivity when you identify inefficiencies. Marketing and sales teams analyze customer data to improve engagement and tailor campaigns. Executives rely on SaaS business intelligence for strategic planning, gaining visibility into organizational performance. You can pinpoint problem areas in operations and support quality control efforts. In finance, SaaS BI helps you detect fraudulent activities and protect assets.
BOE Technology Group faced challenges with fragmented data and inconsistent metrics. You may encounter similar issues in your organization. BOE implemented FineBI, a leading business intelligence solution, to build a unified data warehouse and standardize metric definitions. The company created dashboards for KPI monitoring and cross-factory benchmarking. As a result, BOE reduced inventory costs by 5% and increased operational efficiency by 50%. You can see how SaaS business intelligence drives digital transformation and supports data-driven decision-making.
You want to measure the return on investment when adopting SaaS business intelligence. Start by evaluating improvements in efficiency and productivity. You save time by automating reporting and analysis. You reduce costs by eliminating manual processes and minimizing IT involvement. SaaS BI platforms help you make faster decisions, which leads to better business outcomes. You gain a competitive advantage by leveraging cloud-based data analytics. Dashboards provide real-time insights, allowing you to respond quickly to changes. When you use SaaS business intelligence, you unlock measurable value for your organization.
You gain practical value from SaaS business intelligence by streamlining data analysis and tracking key metrics. This approach supports faster business decisions and improves your ability to respond to change. FineBI helps you simplify the process of making sense of your data. Evaluate your current tools and consider how SaaS can support your future growth. Start exploring new solutions to unlock better results for your business.

How to Do Retention Analysis for Business Success
What is Pareto Chart and How Does it Work
How DuPont Analysis Helps You Understand Your Business

The Author
Lewis
Senior Data Analyst at FanRuan
Related Articles

Customer Insights Dashboard: What Enterprise Teams Should Track and Why It Matters
Learn what enterprise teams should track in a customer insights dashboard to centralize data, improve decisions, and drive revenue and retention.
Lewis Chou
May 01, 2026
Customer 360 Dashboard: What It Is, What It Tracks, and Why Enterprises Need One
Learn what a Customer 360 Dashboard is, what it tracks across the customer lifecycle, and why enterprises need one for unified data and better decisions.
Lewis Chou
Apr 28, 2026
What Is a Customer Intelligence Dashboard? A Practical Framework to Unify CRM, Marketing, and Service Data
Learn how a customer intelligence dashboard unifies CRM, marketing, and service data to improve customer insights, team handoffs, and business outcomes.
Lewis Chou
Apr 28, 2026


