An erm dashboard is a centralized platform that visualizes and manages your organization’s key risks in real time. You can set up a user-friendly dashboard by selecting the right platform, integrating enterprise risk management principles, and committing to ongoing improvement. Integrating these principles will give you:
- Standardized risk reporting
- A comprehensive view of your company’s risk profile
- Improved resource allocation
- Consistent measurement of performance
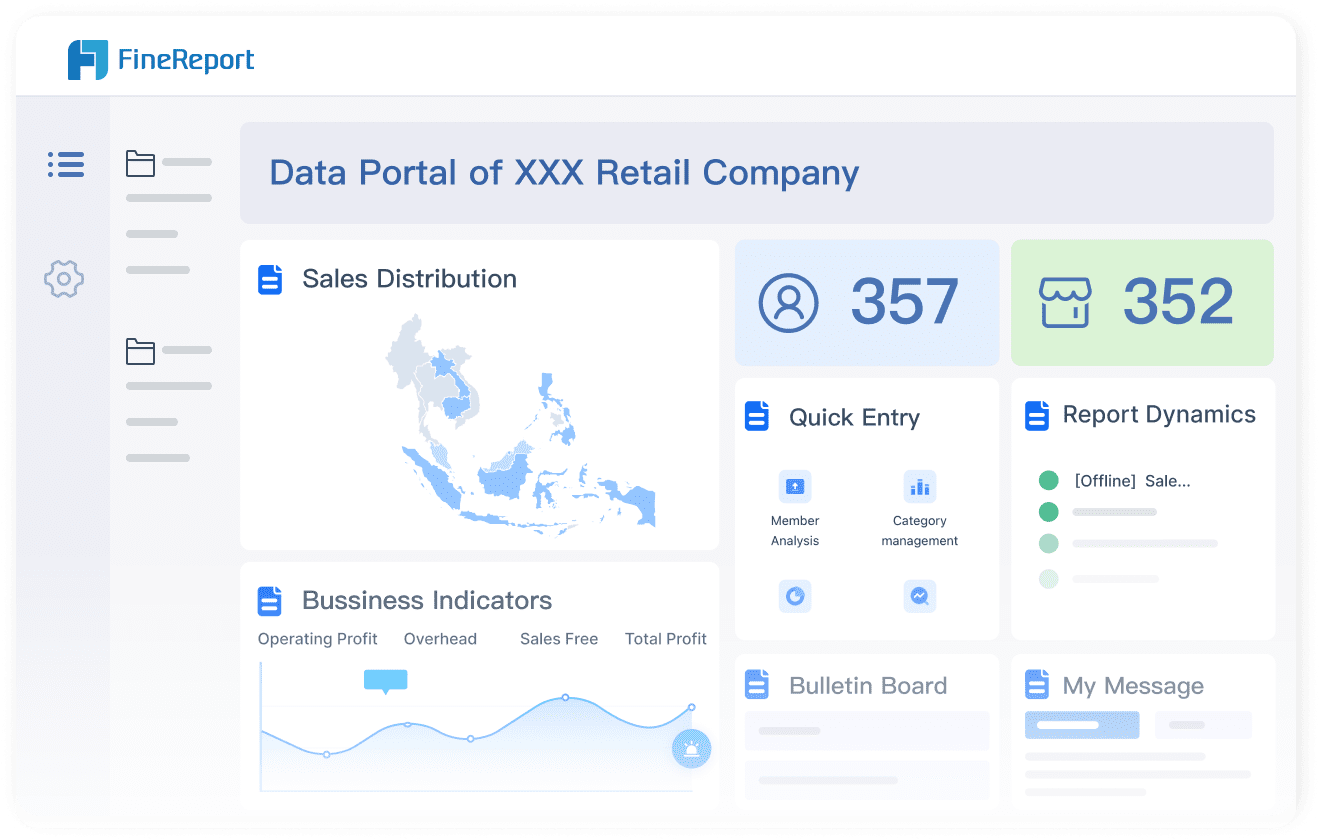
With FineReport, you can build an effective dashboard even if you have only basic technical skills.
Selecting the Right ERM Dashboard Platform
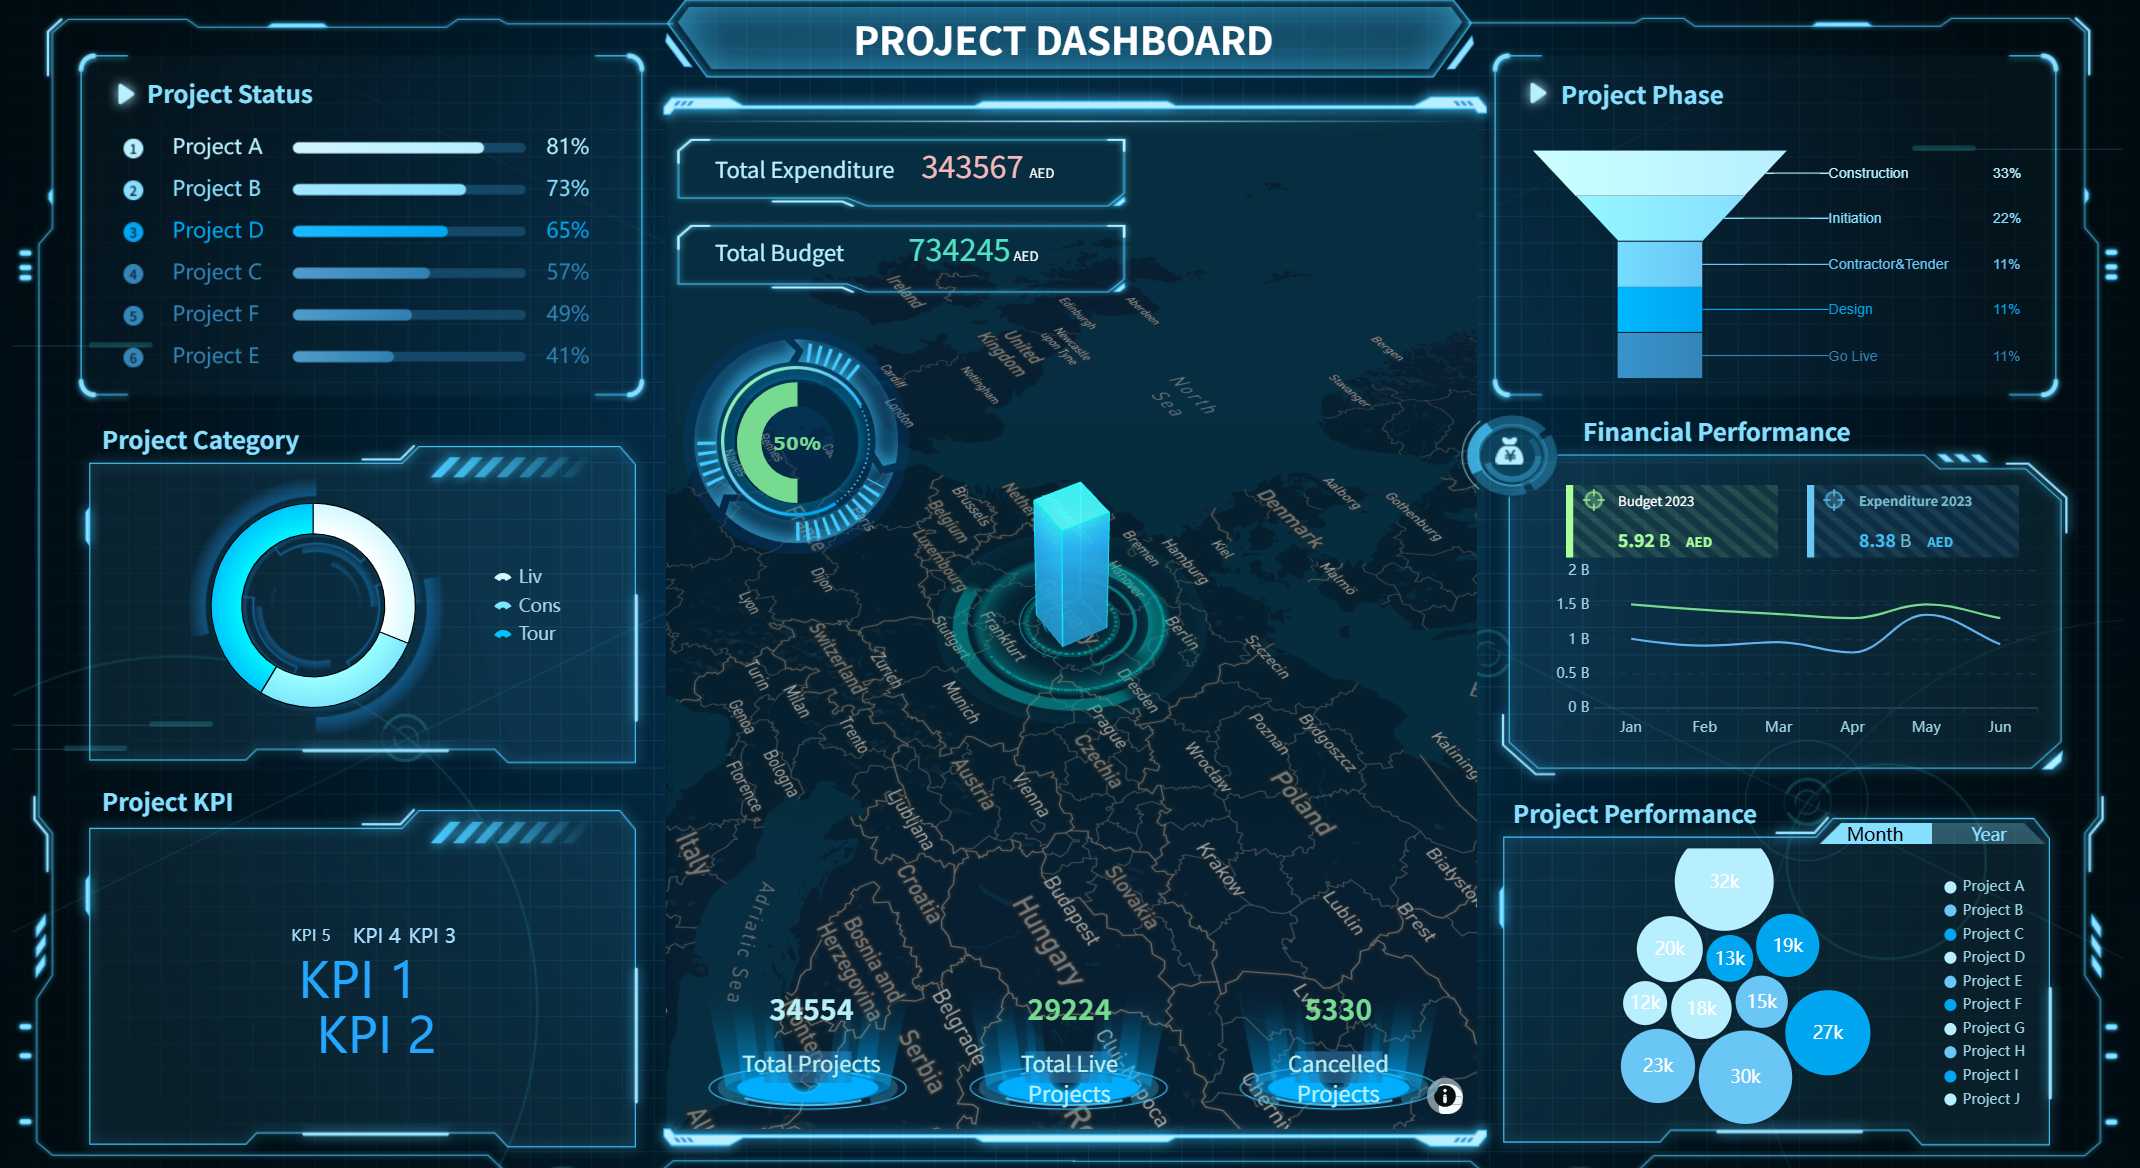
An erm dashboard is a visual tool that centralizes your organization’s risk data, enabling you to track, assess, and respond to threats in real time.
Evaluating Dashboard Tools for Enterprise Risk Management
When you design a risk management dashboard, you need to choose a platform that aligns with your enterprise risk management strategy and supports your risk management goals. Start by reviewing the most popular dashboard platforms used by enterprises in 2024:
- LogicManager
- RiskWatch
- RSA Archer
- MetricStream
- SAP GRC
- IBM OpenPages
- Sphera
- Diligent
- Protecht
- Risk Cloud
- Resolver
- Acuity
To select the right risk management dashboard, focus on these criteria:
- Define your strategic objectives and values.
- Choose measures and KPIs that reflect both success and failure.
- Identify undesirable outcomes and visualize potential risks.
- Highlight catastrophic events and problematic incidents.
- Set boundaries for acceptable and unacceptable risk levels.
- Establish clear limits for tolerable and intolerable risks.
Tip: Prioritize platforms that allow you to integrate data from multiple sources and support real-time monitoring. This ensures your enterprise risk management dashboard delivers accurate, actionable insights.
Mobile accessibility plays a vital role in risk management. With mobile tools, your team can collect real-time data, upload media on-site, and stay connected wherever they are. This capability keeps everyone engaged and ensures immediate access to accurate information, which is essential for effective risk identification and mitigation.
Customizing FineReport for Your Organization
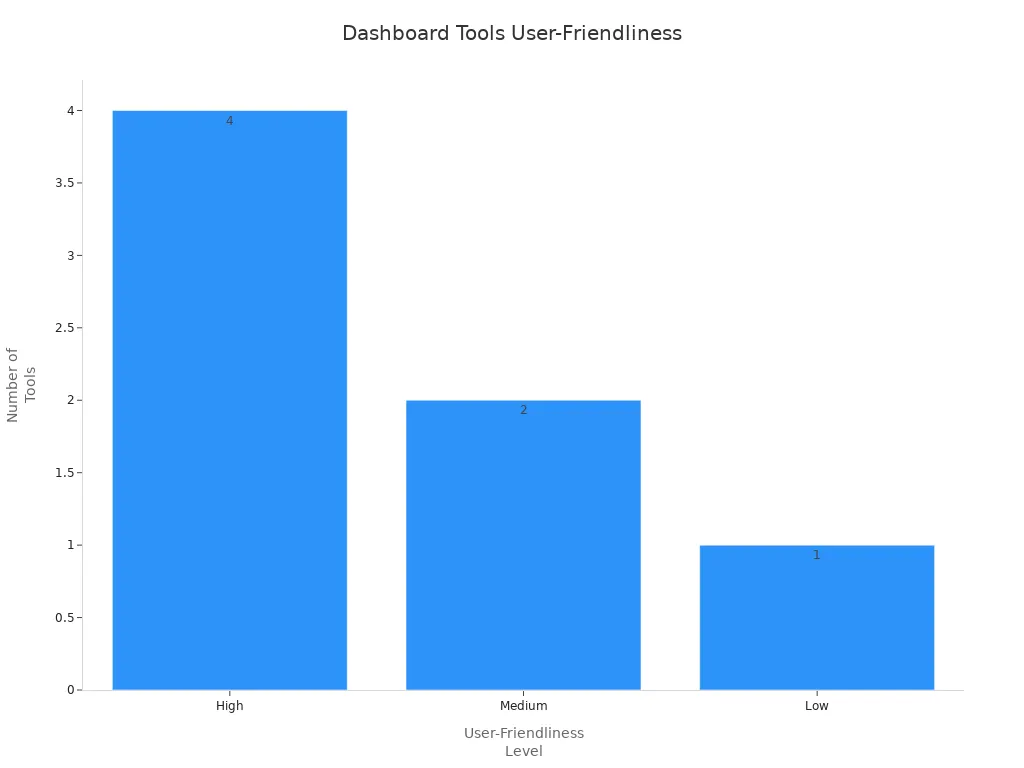
FineReport stands out for its user-friendly design, robust data integration, and mobile accessibility. You can easily drag and drop components to build dashboards that fit your enterprise risk management needs. The table below compares FineReport’s ease of use with other popular tools:
| Tool | User-Friendliness | Notes |
|---|---|---|
| FineReport | High | Intuitive design mode, easy drag-and-drop functionality. |
| Metabase | High | User-friendly but relies on SQL. |
| Google Data Studio | High | User-friendly but lacks real-time updates. |
| Matomo | Low | Poor UI/UX design, steep learning curve. |
| Tableau | High | User-friendly but has data security limitations. |
| Grafana | Medium | User-friendly but higher learning curve. |
| Databox | Medium | Can be confusing for beginners. |
FineReport enables you to connect to various data sources, automate risk management processes, and visualize key performance indicators. You can customize dashboards for different departments, ensuring each team monitors the most relevant metrics. With mobile access, your management team can review risk data and KPIs anytime, supporting quick decision-making and continuous improvement. This flexibility helps your enterprise maximize the effectiveness of its risk management dashboard and ensures ongoing benefits from your enterprise risk management efforts.

Essential Features of an ERM Dashboard

An erm dashboard is a centralized digital platform that visualizes, tracks, and manages your organization’s risks, supporting informed decision-making and proactive risk mitigation.
A user-friendly risk management dashboard must deliver real-time visibility into enterprise risk management activities, facilitate data-driven decisions, and streamline monitoring of critical risk metrics. When you design a risk management dashboard, you empower your team to identify, assess, and respond to threats efficiently. The effectiveness of your dashboard depends on its ability to integrate key performance indicators, enable seamless data entry, and consolidate information from multiple sources.
Key Risk Indicators and Data Entry Forms
Key risk indicators (KRIs) serve as early warning signals for emerging risks. You need to monitor these metrics to spot trends and take timely action. KRIs align risk management activities with your enterprise risk management strategy, helping you allocate resources and adjust strategies for maximum effectiveness. By tracking KRIs, you strengthen your organization’s resilience and support continuous improvement.
KRIs provide early alerts, facilitate timely actions, and enhance your ability to prevent or mitigate risks. They help you monitor trends, align risk management with organizational goals, and inform risk mitigation strategies.
To maximize the benefits of your risk management dashboard, you should incorporate data entry forms. FineReport offers intuitive forms that simplify data collection and ensure accuracy. You can use these forms to record incidents, update risk registers, and capture feedback from stakeholders. The Excel import feature in FineReport streamlines data management, allowing you to transfer existing records quickly and efficiently. This capability eliminates manual entry, saves time, and reduces errors.
| Feature | Benefit |
|---|---|
| Direct Excel Import | Eliminates manual data entry, streamlining the process for risk management dashboards. |
| Familiarity with Excel | Business personnel can quickly transfer existing data without needing additional training. |
| Batch Import | Saves time by allowing multiple records to be imported at once, enhancing efficiency. |
![]()
Integrating Multiple Data Sources with FineReport
Enterprise risk management requires a holistic view of risks across departments and systems. You need a dashboard that consolidates data from various sources, enabling comprehensive analysis and informed decision-making. FineReport excels in this area, allowing you to connect to databases and generate reports using SQL. You can collect data from multiple sources, breaking down silos and supporting enterprise-wide risk identification.
FineReport enables seamless integration with databases, letting you effortlessly generate reports and consolidate data for your risk management dashboard.
A robust risk management dashboard should include the following essential features:
| Feature | Description |
|---|---|
| Visualization | Quickly view key information about risks. |
| Risk Assessment | Evaluate and prioritize risks effectively. |
| Compliance Tracking | Ensure adherence to regulations and standards. |
| Communication Tools | Share information among stakeholders. |
| Real-Time Dashboards | Fast access to actionable data for decision makers. |
| Risk Register | Centralized repository for recording and managing risks. |
| Risk Exposure Heat Mapping | Visual tools to represent risk levels and trends. |
You can leverage FineReport to design a risk management dashboard that supports enterprise risk management, integrates key performance indicators, and provides actionable insights. By combining KRIs, data entry forms, and multi-source integration, you create a dashboard that drives improvement, enhances monitoring, and supports effective risk mitigation strategies.

Organizing Your Risk Management Dashboard

An erm dashboard is a centralized digital tool that visualizes, tracks, and manages enterprise risks, supporting informed decisions and proactive mitigation.
Organizing Your Risk Management Dashboard
Structuring Sections for Easy Navigation
When you design a risk management dashboard, you need to organize information so users can navigate with ease. Logical sectioning reduces cognitive load and keeps attention on critical risk metrics. Start by defining the purpose and scope of your dashboard. Identify key stakeholders who will use the dashboard and select relevant metrics and kpis that align with your enterprise risk management strategy. Present data in a clear format, using visual elements to highlight key performance indicators and strategies.
Use these best practices to structure your risk management dashboard:
- Define the purpose and scope to determine what data to include.
- Identify stakeholders and tailor sections to their needs.
- Select actionable metrics and kpis for effective monitoring.
- Design with clarity, using visual hierarchy and white space.
- Add interactive elements for deeper risk identification.
- Test with a pilot group and refine based on feedback.
- Train users to maximize dashboard effectiveness.
Logical sectioning and consistent labeling help users trust the data and minimize confusion. Group metrics into meaningful sections to focus attention on enterprise risk management activities. Use layout, color, and typography to emphasize high-priority data. Organize information so users can scan and locate insights quickly.
Setting Permissions and User Roles in FineReport
Effective risk management requires secure access control. FineReport’s permission management system supports collaborative enterprise risk management by allowing you to set clear roles and permissions. Begin by listing all resources in your risk management dashboard that need access control, such as pages, data entities, and APIs. Define user roles based on job duties, such as administrators, managers, contributors, and viewers. Assign permissions using the principle of least privilege, ensuring each user accesses only what they need for risk identification and mitigation.

Regularly review and update roles as responsibilities change. Audit permissions to maintain security and compliance. FineReport offers features that enhance collaborative risk management:
| Feature | Benefit for Collaborative Risk Management |
|---|---|
| Shared annotations and comments | Facilitates communication of insights within teams. |
| Template lockdown | Maintains integrity and security of sensitive information. |
| Data permission controls | Ensures safe and secure data sharing among users. |
Set permission end dates for temporary roles and log all changes for accountability. Multi-factor authentication adds another layer of security for sensitive access. These strategies help you maintain the effectiveness of your risk management dashboard and support ongoing improvement in enterprise risk management.
Testing and Improving Your ERM Dashboard
An erm dashboard is a digital platform that centralizes risk data, enabling you to monitor, assess, and respond to enterprise risks in real time. You can improve your risk management dashboard by testing usability, gathering feedback, and using analytics for continuous improvement. This approach strengthens enterprise risk management and supports effective risk mitigation.
Gathering Team Feedback on Dashboard Usability
You need to ensure your risk management dashboard works for everyone on your team. Start by collecting feedback through NPS surveys to measure satisfaction. In-app widgets help you capture immediate reactions and feature-specific comments. User interviews reveal pain points and detailed insights about enterprise risk management activities. Usage analytics show how team members interact with the dashboard and which features drive engagement.
A/B testing lets you compare different dashboard layouts, chart types, and navigation setups. You can measure task completion times and ease of navigation to find the best design for your enterprise. Tracking tools such as session recordings, heat maps, and click path analysis highlight where users struggle. These strategies help you identify areas for improvement and boost risk management effectiveness.
Accessibility testing is also important. Make sure your dashboard meets WCAG 2.1 standards by checking color contrast, keyboard navigation, and screen reader compatibility. Combine automated tools with hands-on testing to ensure everyone can use your risk management dashboard.
Continuous Enhancement with FineReport Analytics
Continuous improvement is key to effective risk management. FineReport provides analytics and scheduled reporting that support ongoing enhancement of your enterprise risk management dashboard. You can track kpis, risk metrics, and data trends over time. Scheduled reports ensure that risk data, schedule deviations, and interdependencies appear in your central risk register for enterprise-wide visibility.
| Evidence Aspect | Description |
|---|---|
| Risk Register Inclusion | Schedule deviation risks are included in the central risk register for enterprise-level visibility. |
| Interdependency Mapping | Relationships between schedule deviations and other business risks are identified to understand effects. |
| Unified Risk Scoring | Consistent evaluation methodologies enable comparative analysis between schedule risks and other risks. |
| Integrated Reporting | Schedule metrics are consolidated with other risk indicators in executive dashboards and reports. |
| Coordinated Response Planning | Mitigation strategies for schedule deviations are aligned with broader business continuity protocols. |
FineReport’s analytics help you monitor risk management effectiveness and risk mitigation effectiveness. You can use these insights to refine your enterprise risk management strategy, adjust risk management strategies, and ensure your dashboard continues to deliver value. This process supports ongoing risk identification, monitoring, and improvement, maximizing the benefits for your enterprise.
An erm dashboard is a digital platform that gives you real-time visibility into your enterprise’s risks through clear visualization and actionable insights.
To build a user-friendly risk management dashboard, follow these steps:
- Analyze your organization’s needs and gather requirements.
- Design the system architecture and develop your dashboard.
- Integrate with current systems and test thoroughly.
- Deploy, educate users, and provide ongoing support.
Simplicity and clarity in your enterprise risk management dashboard speed up decision-making and reduce cognitive load. The table below highlights the impact:
| Evidence Type | Description | Impact on Risk Management Outcomes |
|---|---|---|
| Speed of Decision-Making | Dashboards with fewer than seven visual elements are interpreted 40% faster. | Enables faster decision-making, crucial for effective risk management. |
| Accessibility | Simple dashboards empower non-technical users to engage with data easily. | Improves engagement and consistent adoption of dashboards. |
| Cognitive Load Reduction | Users experience less mental fatigue when scanning data quickly. | Leads to better engagement and consistent use of dashboards. |
Continuous improvement in enterprise risk management ensures your risk management dashboard stays relevant. You should align reports with measurable objectives, review and refine regularly, and encourage feedback for stronger risk identification.
FineReport empowers you to create a risk management dashboard that delivers real-time visibility, supports your enterprise strategy, and drives ongoing improvement. Start building or refining your dashboard today to unlock the full benefits of enterprise risk management.

Continue Reading About ERM dashboard
How to Create a Risk Management Dashboard for Your Business
What is a Risk Dashboard and How Does It Work
What ESG Risk Management Is and Why It Matters For Companies


FAQ

The Author
Lewis
Senior Data Analyst at FanRuan