A network dashboard is a digital interface that displays key network metrics, device status, and performance indicators in real time, helping you manage and monitor your network infrastructure efficiently. You gain instant access to critical data, which supports better network management and comprehensive network visibility. Real-time monitoring allows you to spot abnormal activity and address incidents quickly. FineReport empowers you to streamline network management by integrating data from various sources and turning raw information into actionable insights.
Unified network visibility improves operational efficiency, enhances security, and speeds up deployment. The table below shows the impact:
| Impact of Unified Network Visibility | Percentage |
|---|---|
| Consistent and correct network policies | 34% |
| Enhanced network security | 33% |
| Speed deployment times | 32% |
Network dashboards help you eliminate system switching, improve collaboration, and lower operational costs. You can expect improved productivity across your network management processes.

A network dashboard is a centralized digital platform that lets you monitor, analyze, and manage your entire network infrastructure in real time, providing instant access to performance metrics, device status, and security alerts so you can make informed decisions and maintain optimal network health.
You use a network dashboard to bring all your network monitoring needs into one place. This tool displays live data about your network, such as device status, bandwidth usage, and security events. Unlike traditional network monitoring tools, network dashboards combine data collection, analysis, alerting, and reporting into a single, interactive interface. This unified approach helps you see not only what is happening in your network but also why it is happening and what you should do next.
Network dashboards stand out because they offer advanced analytics and AI-driven insights. You can customize your dashboard to focus on the most important metrics for your organization. The platform supports scalability, so you can monitor multiple data centers or remote sites as your network grows. Interoperability ensures that your dashboard works smoothly with your existing technologies, allowing real-time tracking of applications and traffic. Security and compliance features, such as encryption and access controls, help protect your data and meet regulatory requirements.
Tip: Customizable dashboards let you rearrange, resize, or remove elements, so you always see the metrics that matter most.
Here is a table summarizing the core components you will find in a modern network monitoring dashboard:
| Core Component | Description |
|---|---|
| Customizability | Personalize your dashboard to focus on essential metrics. |
| Scalability | Monitor multiple data centers and large networks. |
| Interoperability | Integrate with existing technologies for real-time tracking. |
| Alerting and Reporting | Receive real-time alerts and generate insightful reports. |
| Security and Compliance | Protect data privacy with encryption and access controls. |
A network monitoring dashboard works by collecting data from various sources across your network. It gathers information from routers, switches, servers, and endpoints. The dashboard then analyzes this data in real time, looking for patterns, anomalies, or performance issues. You receive alerts when the system detects unusual activity or potential threats. The dashboard also generates reports that help you understand root causes and trends.
Traditional network monitoring tools use separate systems for data collection, analysis, and alerting. In contrast, network monitoring dashboards integrate these functions into a single platform. This integration gives you a proactive and intelligent approach to network management. You can track traffic flows, monitor device health, and optimize performance from one place. The dashboard’s analytics help you identify not just what is wrong, but also who or what is affected and how to fix it.
You benefit from features like real-time visualization, automated alerts, and detailed reporting. These tools help you prevent problems before they impact your business. You can also use the dashboard to optimize network performance, plan for capacity, and ensure compliance with security standards.
Many types of organizations rely on network monitoring dashboards to keep their systems running smoothly. You might use a network monitoring dashboard if you work in IT, operations, or security. These dashboards are especially valuable in industries where uptime and security are critical.
Here are some of the most common use cases for network monitoring dashboards in enterprise environments:
You can also use specialized dashboards, such as:
Network monitoring dashboards see high adoption rates in several industries. The table below shows how different sectors use these tools:
| Industry | Adoption Rate |
|---|---|
| Financial Services | 83% |
| Local Government | 87% |
| Healthcare | 84% |
| Retail | 44% |
| Professional Services | Strong |
| Manufacturing | Strong |
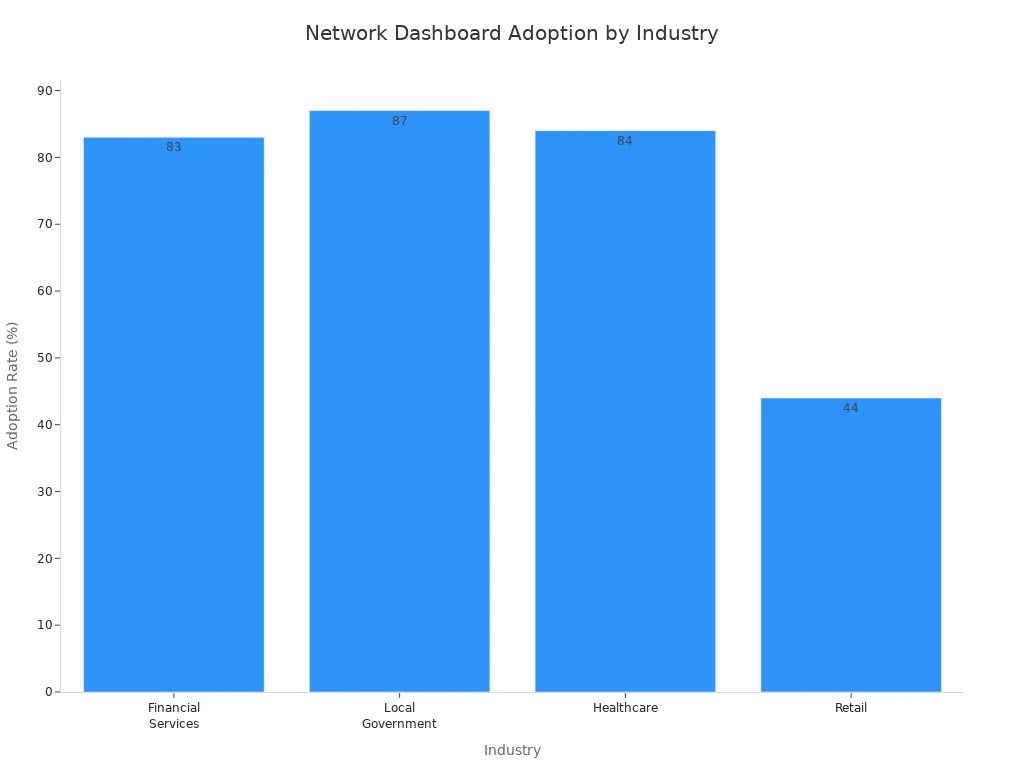
You will find network monitoring dashboards in financial services, government, healthcare, and manufacturing because these industries need reliable, secure, and efficient networks. You can use these dashboards to monitor, analyze, and optimize your network in real time, no matter your industry or organization size.
A network dashboard is a centralized digital platform that lets you monitor, analyze, and manage your network infrastructure in real time, providing instant access to performance metrics, device status, and security alerts.
You need real-time monitoring capabilities to keep your network healthy and secure. With a network monitoring dashboard, you can track network health and efficiency as events happen. You see live updates on device status, bandwidth usage, and security measures. This helps you identify vulnerabilities and reduce risks before they impact your business.
FineReport’s drag-and-drop interface makes it easy for you to create interactive dashboards for real-time data monitoring. You do not need advanced technical skills to set up custom views. You can monitor multiple devices and locations from one screen. The dashboard automatically generates visualizations and updates documentation based on monitoring data. You get a clear, information-rich view of your network health.
Tip: Real-time monitoring helps you spot abnormal activity and respond quickly, minimizing downtime and security threats.
You rely on performance metrics and analytics to understand how your network operates. A network monitoring dashboard feature lets you analyze bandwidth usage, device performance, and traffic patterns. You can use AI-powered analytics to minimize alert fatigue and correlate events across your infrastructure. Topology mapping automatically generates network maps, helping you visualize dependencies and identify bottlenecks.
| Feature | Description |
|---|---|
| AI-Powered Analytics | Uses AIOps to reduce alert fatigue and connect events across your network. |
| Topology Mapping | Creates network maps to show dependencies and spot bottlenecks. |
| Custom Dashboards | Lets you track specific performance metrics for Wi-Fi and network services. |
You can monitor large-scale networks using lightweight software agents that gather statistics. These statistics are sent to a scalable repository for big data analytics. This approach separates monitoring from storage and analysis, making it easier to manage complex environments. FineReport supports multi-source data integration, so you can combine data from different systems and get a complete picture of your network performance monitoring.

Note: Comprehensive analytics help you optimize bandwidth usage and improve network efficiency.
You need effective alerts and notifications to manage your network proactively. A network monitoring dashboard feature sends you alerts when performance metrics exceed set limits or when security incidents occur. You can differentiate between alerts and incidents, so you know what needs immediate attention. Critical alerts cover major issues, while performance alerts help you address minor problems before they escalate.
You can tune thresholds to minimize false positives and avoid alert fatigue. Customizable policy templates let you tailor alert policies to your needs. Efficient notification channels integrate with communication tools like Microsoft Teams and Slack, enhancing your response times. Automation supports timely responses and proactive mitigation strategies.
Integrating notifications with other network monitoring software and management systems streamlines your workflow. You receive alerts through standard protocols such as SMTP, Syslog, and SNMP traps, making it easier to respond quickly.
Customization and integration are essential network monitoring dashboard features that improve your workflow efficiency. You can create custom dashboards that focus on the metrics most relevant to your organization. This tailored approach enhances decision-making speed and helps you prioritize critical information.
FineReport supports mobile dashboards and advanced 3D dashboards, so you can monitor your network from any device and visualize complex data in new ways. You can access your dashboards on smartphones, tablets, or large screens, making network device monitoring flexible and convenient.

Callout: Customization and integration features help you adapt your network monitoring dashboard to changing business needs and scale as your network grows.
You can use FineReport to monitor, analyze, and optimize your network with ease. The combination of real-time monitoring, advanced analytics, effective alerts, and flexible customization makes FineReport a powerful network monitoring dashboard solution for any organization.

A network dashboard is a centralized platform that lets you monitor, analyze, and manage your network in real time, giving you instant access to network performance, device status, and security measures so you can maintain network health and make informed decisions.
You can troubleshoot network issues much faster with a network dashboard. Real-time monitoring and automated alerts help you detect problems before they affect network health. You receive instant notifications about abnormal activity, which supports quicker troubleshooting and reduces downtime. Automation streamlines workflows, minimizes human error, and ensures consistent monitoring. You can focus on strategic tasks instead of manual reporting.
Network dashboards strengthen your security measures and help you meet compliance standards. You can monitor for threats, track incidents, and use security and compliance features like access controls and encryption. This reduces the time your network is exposed to vulnerabilities and improves your audit scores. Security monitoring becomes proactive, not reactive.
You boost efficiency and productivity by using a network dashboard. In manufacturing, real-time insights let you monitor production and predict future demand. FineReport’s OEE dashboards help you shift from reactive to proactive decision-making. The Kintetsu customer story shows how real-time dashboards improved information management and operational efficiency. You can monitor, analyze, and optimize your network, leading to better performance and lower costs.
A network dashboard is a centralized digital platform that displays real-time network data, helping you monitor, analyze, and manage your network infrastructure efficiently.
When you select a network monitoring solution, you must consider scalability and integration. You want a system that grows with your network monitoring needs. Look for features that support expanding networks, cloud and hybrid compatibility, and minimal system impact. The ability to add devices and endpoints easily ensures your monitoring stays effective as your network grows.
| Factor | Description |
|---|---|
| Support for Expanding Networks | Add more devices and endpoints as needed. |
| Cloud and Hybrid Compatibility | Works with on-premise and cloud infrastructures. |
| Minimal System Impact | Efficient data collection without slowing down your network. |
You should also check for third-party integrations, API support, and AI-powered analytics. These features enhance integration and automation capabilities, making your monitoring more powerful. FineReport offers flexible deployment and cross-platform compatibility, so you can monitor physical, virtual, and cloud environments with ease.

Customization and user experience play a big role in network monitoring. You need dashboards that flatten the learning curve and reduce errors. Navigation dashboards let you interact with data by zooming, searching, filtering, and sorting. Customization options, templates, and automation features simplify your tasks. Visual aids like colors, icons, and heatmaps help you complete tasks faster.
A consistent visual design ensures clarity. FineReport’s drag-and-drop interface lets you build dashboards that match your workflow, making monitoring easy for everyone. Integration with cloud-centric and user-centric rules supports productivity and collaboration.

Cost and support influence your choice of network monitoring. You must look beyond initial costs and consider long-term expenses for support and maintenance. Free tools may seem attractive, but hidden costs can add up. Comprehensive solutions with robust support allow you to focus on business goals instead of technical issues. FineReport provides strong support services, helping you maximize your investment.
To get the most from your network monitoring dashboard, follow best practices. Understand your network needs and tailor the solution to your goals. Select software that fits your technical environment. Plan a structured implementation with clear objectives and roles. Train your team to use monitoring features effectively. Continuously optimize your monitoring based on performance data.
Tip: Integrate your monitoring system with existing support processes and establish baseline measurements for performance. This helps you identify issues early and improve network health.
A network dashboard is a digital tool that lets you monitor, analyze, and manage your network in real time from a single interface. You gain clear visibility into your network, helping you spot issues and improve performance. Businesses using dashboards report faster project delivery, higher conversion rates, and major cost savings.
| Key Insight | Description |
|---|---|
| Market Dominance | Solutions with real-time network insights held 63.95% of the market share in 2024. |
| Resilience Building | Network dashboards support business continuity and risk management. |
Choose FineReport for a scalable, customizable network dashboard that grows with your needs and keeps your network secure.
Telecom Network Analytics Explained and Why You Should Care
What Are the Top Digital Marketing Analytics Tools for 2025?
How to Create a Digital Marketing Reports Dashboard
What is a Digital Marketing Dashboard and Why Does it Matter

The Author
Lewis
Senior Data Analyst at FanRuan
Related Articles
What Is a Call Tracking Dashboard? Key Metrics, Use Cases, and How It Works
A call tracking dashboard gives enterprise teams a unified view of how phone calls connect to marketing spend, lead quality, sales outcomes, and service performance. For IT leaders, its value is not limited to reporting:
Yida Yin
May 07, 2026

Payment Analytics Dashboard: 12 KPIs Every Operations Leader Should Track to Cut Revenue Leakage
Losing revenue to declines? Discover 12 essential KPIs to track in your payment analytics dashboard to stop leakage and manage disputes.
Lewis Chou
May 05, 2026

SOC Dashboard Explained: 12 Essential KPIs, Views, and Workflows Security Teams Use
Learn about SOC dashboards, the 12 essential KPIs for security teams, and how they centralize alerts and workflows for faster threat detection and response.
Lewis Chou
May 05, 2026


