What is a risk management dashboard? This tool gives you a clear way to track, analyze, and respond to risk in your business. You identify key risk factors, select the right metrics, and build a dashboard that helps you make fast, informed decisions. FineBI stands out for building risk dashboards because it lets you connect different data sources, process risk data, and create visual reports with drag-and-drop ease. You should always tailor your dashboard to your business needs and your audience. Usability and regular updates help your dashboard stay effective.
Many businesses face challenges when creating dashboards. The most common issues include integrating risk data from different sources, understanding risk in context, and visualizing risk information for stakeholders.
| Challenge | Description |
|---|---|
| Data Integration | Organizations struggle to collect and integrate risk-related data from various sources. |
| Understanding Risk in Context | Data silos prevent effective sharing and reduce the value of risk management. |
| Effective Data Visualization | Turning risk analysis into actionable insights is essential for stakeholder communication. |
Define Risk Management Dashboard Goals
What is a risk management dashboard? This dashboard is a centralized tool that helps you monitor, analyze, and respond to risk across your organization. You use it to visualize risk data, track key indicators, and support decision-making for third-party risk management, compliance, and operational safety.
A risk dashboard gives you a clear view of risk exposure and helps you act quickly. You can see trends, spot emerging risks, and share insights with stakeholders. This approach improves reporting and supports accountability in your business.
Set Objectives
Start by clarifying what you want your risk dashboard to achieve. Most organizations use a risk dashboard to uncover hidden risks, act on data-driven insights, improve accountability, allocate resources, and simplify compliance reporting. The table below shows common goals and their descriptions:
| Goal | Description |
|---|---|
| Uncover Hidden Risks | Provides real-time visibility into emerging risks, enabling early identification and timely intervention. |
| Act on Data-Driven Insights | Empowers decision-makers to make informed choices based on solid, data-backed insights. |
| Improve Accountability | Ensures responsibilities are clearly defined, enhancing collaboration and tracking of mitigation efforts. |
| Allocate Resources Where Needed Most | Helps prioritize areas requiring attention, enhancing operational efficiency in risk management. |
| Simplify Compliance and Reporting | Eases the burden of compliance by providing detailed, up-to-date reports for audits and adherence. |
You should align your risk dashboard objectives with your business strategy. In finance and manufacturing, dashboards often focus on third-party risk management, regulatory compliance, and asset protection.
Identify Users
Identify who will use your risk dashboard. Different users need different information for effective risk management and reporting. The table below outlines typical user types and their key needs:
| User Type | Key Information Needed |
|---|---|
| Board of Directors and Executives | High-level risk overview, key risk indicators, risk appetite, emerging risks, compliance status |
| Senior Management and Department Heads | Detailed risk metrics, risk mitigation strategies, resource allocation, interdependencies, benchmarking |
| Middle Management and Team Leaders | Operational risk indicators, performance metrics, progress on initiatives, training effectiveness, incident reports |
| Front-line Employees | Task-specific guidelines, safety checklists, incident reporting tools, personal performance metrics |
FineBI supports different user roles and departments, making it easy to customize dashboards for each audience. You can set permissions and tailor reporting for executives, managers, and front-line staff.
Align Features
Align dashboard features with user needs and industry context. In finance, you need consolidated data to avoid strategic risks and real-time monitoring for exposure. Manufacturing teams benefit from dashboards that track performance, safety, and third-party risk management. Consider these best practices:
- Consolidate risk data to provide a single source of truth.
- Enable real-time reporting and monitoring for quick response.
- Offer historical data for informed decision-making.
- Address specific challenges like cash flow, asset quality, and compliance.
- Provide intuitive navigation so users can switch between summary and detailed views.
A risk dashboard built with FineBI lets you configure features for each department. You can create dashboards that support third-party risk management, compliance reporting, and operational analysis. This approach ensures your risk management dashboard delivers actionable insights to every stakeholder.
Risk Management Dashboard Components
What is a risk management dashboard? A risk management dashboard is a centralized tool that helps you track, analyze, and respond to risk across your organization. You use it to bring together risk data, monitor key risk metrics, and support decision-making for third-party risk management, compliance, and operational safety.
A risk management dashboard gives you a real-time view of your risk landscape. You can see trends, spot emerging threats, and share insights with stakeholders. This dashboard helps you act quickly and improves your reporting and accountability.
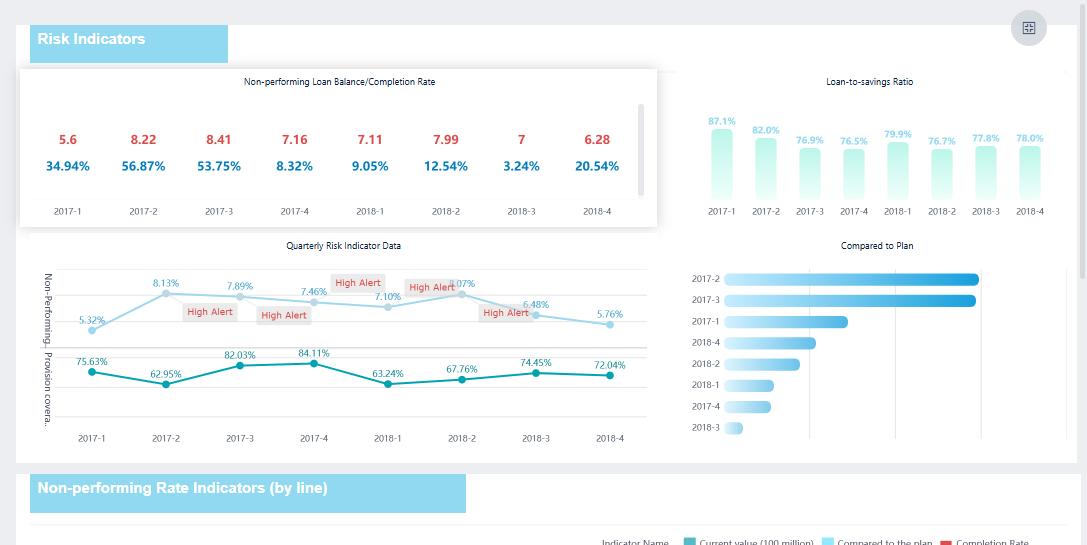
Risk Overview
You start with a risk overview. This section of the dashboard provides real-time data visualizations that help you spot issues as they arise. Customizable views let you focus on high-level summaries or drill down into details. You can tailor the risk overview for executives, managers, or teams involved in third-party risk management.
Key Metrics
Key metrics form the backbone of your risk dashboard. These metrics help you measure risk exposure, compliance, and operational effectiveness. Here are common metrics you should track:
| Metric Type | Description |
|---|---|
| Data Breach Incidents | Number and severity of data breach occurrences, indicating the effectiveness of data protection. |
| Vulnerability Assessment Results | Quantity and severity of vulnerabilities found, aiding in prioritization of fixes. |
| Compliance Status | Overview of compliance with data protection laws and industry standards. |
| User Access Monitoring | Monitors anomalous user behavior to identify potential security risks. |
| Patch Management Effectiveness | Timeliness and effectiveness of applying security updates. |
| Third-Party Risk Management | Evaluates the security stance of external partners and providers. |
You can use FineBI to visualize these metrics, making it easier to understand risk trends and share findings in your reporting.

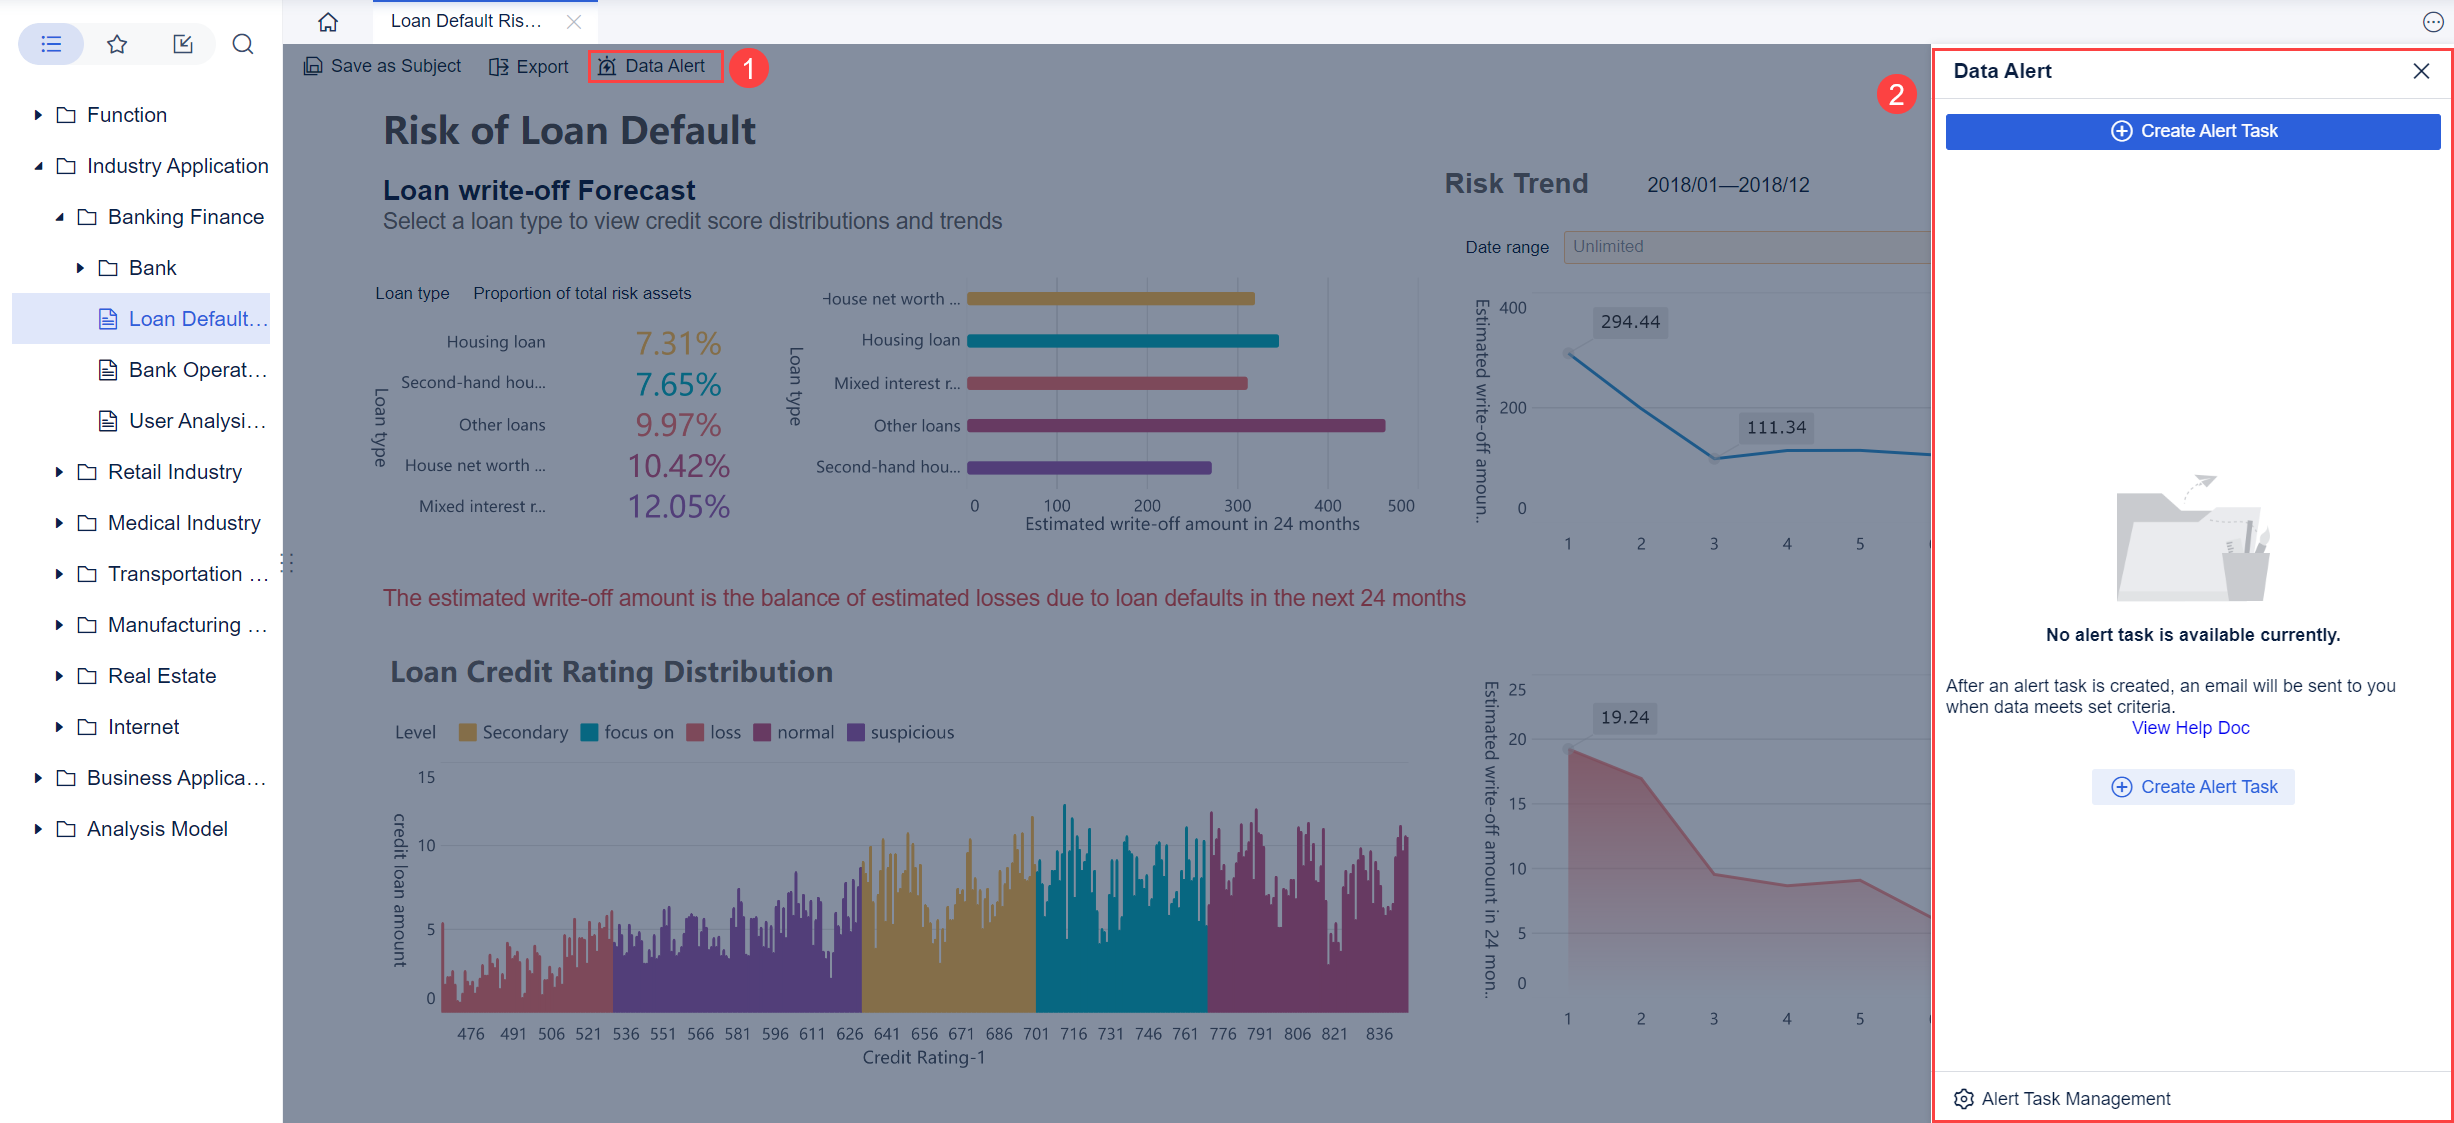
Alerts & Monitoring
Alerts and monitoring are essential for effective risk management. Automated alerts notify you when risk thresholds are crossed or when new threats appear. Continuous monitoring ensures you detect and respond to risks quickly. The table below shows how these features support your dashboard:
| Feature | Description |
|---|---|
| Automated compliance tracking | Continuously monitors regulatory changes and identifies compliance gaps. |
| Real-time dashboards | Displays current risk status to executives, aiding in understanding root causes of problems. |
| Risk prioritization | Prioritizes risks based on impact and likelihood, aiding informed decision-making. |
| Continuous monitoring | Ensures timely detection and response to new threats. |
FineBI’s risk monitoring and alerts features help you stay ahead of issues and improve your reporting.
Documentation
Documentation keeps your risk dashboard reliable and actionable. You should use a standardized template, align with your risk framework, and define clear ownership. Include both quantitative and qualitative data. Keep your documentation up to date, ensure version control, and integrate with your risk management tools. Make your documentation accessible and secure.
KPIs
KPIs measure the performance of your risk management efforts. Track how many risks you identify, mitigate, and realize. Monitor risk frequency, costs, and time to mitigation. Strategic integration metrics show how well risk insights inform your business decisions. These KPIs help you evaluate the effectiveness of your dashboard and improve your reporting.
A well-designed risk dashboard combines these components to give you a complete view of risk. You can use FineBI to create interactive visualizations, automate alerts, and support collaboration for third-party risk management and compliance reporting.
Build Your Risk Management Dashboard

What is a risk management dashboard? A risk management dashboard is a centralized digital tool that allows you to track, analyze, and respond to risks across your organization. It brings together real-time data visualization, risk tracking, and automated alerts to help you monitor threats, measure performance, and support decision-making for third-party risk management, compliance, and operational safety.
You use a risk management dashboard to consolidate risk data from multiple sources. This dashboard gives you a clear view of your risk landscape, so you can identify trends, spot emerging threats, and share insights with stakeholders. It supports reporting, accountability, and fast action when risks arise.
Select Metrics
You need to choose the right metrics for your risk dashboard. Start by understanding which risks matter most to your business. Focus on metrics that reveal trends over time, not just single data points. This approach helps you see if your risk exposure is improving or getting worse. Identify both strengths and weaknesses in your risk management process. Highlight high-risk areas so you can act quickly and communicate these findings to your team.
- Track metrics that show changes and patterns, not just current values.
- Use metrics to identify what works well and what needs improvement.
- Make sure your dashboard highlights areas with the highest risk.
- Choose metrics that support third-party risk management, such as vendor compliance or supply chain disruptions.
- Include data that supports reporting and regulatory requirements.
Selecting the right metrics ensures your risk dashboard provides meaningful insights for risk tracking and decision-making.
Design for Clarity
Design plays a key role in making your risk dashboard effective. You want users to find information quickly and understand it at a glance. Follow these principles for clarity and usability:
- Establish a clear visual hierarchy. Place the most important data at the top or left side of the dashboard.
- Select visualizations that match your data. Use bar charts for comparisons and line charts for trends.
- Limit the number of visual elements. Too many charts or colors can overwhelm users.
- Round numbers to make metrics easier to read.
- Keep colors and design elements consistent across the dashboard.
- Use color to group related data and show relationships.
- Apply larger fonts for titles and main metrics. Use smaller fonts for details.
- Clearly label all KPIs, pages, and sections to help users navigate.
- Organize information logically, so users can move from summary to detail easily.
- Add summaries or tooltips for quick insights.
Avoid common pitfalls such as clutter, illegible fonts, and poor navigation. Make sure your dashboard works well on both desktop and mobile devices. This approach improves reporting and ensures everyone can use the dashboard effectively.
Use FineBI Workflow
After you define your metrics and design, you can build your risk dashboard using FineBI. FineBI is a self-service business intelligence tool that streamlines the process of creating dashboards for risk management. You can connect to over 60 types of data sources, including databases, cloud warehouses, and APIs. FineBI lets you schedule data updates, so your dashboard always shows real-time data visualization.
FineBI’s workflow includes four main steps:
- Data Integration: Connect all your risk data sources. FineBI supports databases, files, and APIs, making it easy to bring together information for third-party risk management and compliance.
- Data Processing: Prepare your data by cleaning, joining, and filtering it. You can create custom datasets for risk tracking and reporting.
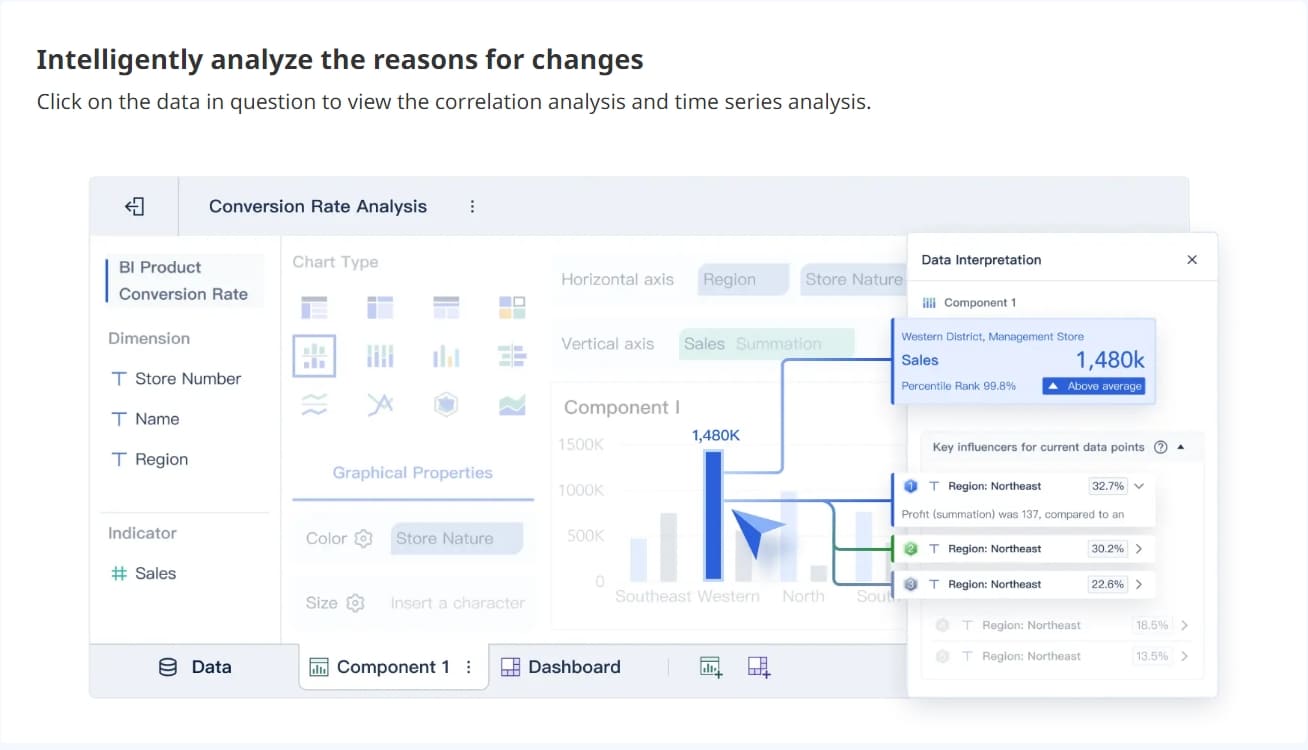
- Visual Exploration: Use drag-and-drop tools to build charts, tables, and maps. FineBI offers real-time data visualization, so you can see risk trends as they happen.
- Publishing & Governance: Share your dashboard securely with different teams. Set permissions for executives, managers, and front-line staff. FineBI supports automated alerts and audit trails for compliance.
FineBI’s design makes it easy for you to create dashboards without coding. You can customize layouts, add summaries, and set up automated alerts for key risk thresholds. This workflow supports ongoing monitoring and reporting, helping you respond to risks quickly.

Test & Iterate
Testing and iteration are essential for a successful risk dashboard. After you build your dashboard, review it with your team. Gather feedback from different users, such as executives, managers, and staff involved in third-party risk management. Check if the dashboard provides clear, actionable insights. Make sure automated alerts work as expected and that reporting meets your business needs.
- Test the dashboard on different devices to ensure mobile compatibility.
- Review the clarity of labels, tooltips, and summaries.
- Update metrics and visualizations based on user feedback.
- Monitor how users interact with the dashboard and adjust navigation if needed.
- Schedule regular reviews to keep your dashboard aligned with changing risks.
You can learn valuable lessons from real-world examples. For instance, Founder Securities used FineBI to transform their risk reporting and monitoring. Their dashboard provided consistent reporting, proactive data management, and clear accountability. The table below summarizes key lessons from their experience:
| Lesson | Description |
|---|---|
| Consistent Reporting | The dashboard delivered reliable, automated exception reporting for all users. |
| Proactive Data Management | Teams acted on data exceptions quickly, reducing impact on operations. |
| Clear Accountability | Roles and actions were clearly defined, improving data governance. |
By following these steps, you can build a risk management dashboard that supports real-time data visualization, risk tracking, and effective reporting. FineBI gives you the tools to integrate data, design clear dashboards, and automate alerts for third-party risk management. Regular testing and updates ensure your dashboard stays relevant and valuable for your organization.
Improve Your Risk Management Dashboard
What is a risk management dashboard? A risk management dashboard is a digital tool that gives you real-time visibility into your organization’s risk landscape. You use it to track, analyze, and respond to risk by consolidating data, automating alerts, and supporting decision-making for security, compliance, and operational safety.
A risk management dashboard helps you monitor risk across departments and processes. You can see trends, identify threats, and take action quickly. This dashboard supports continuous security monitoring, improves reporting, and ensures that your risk management efforts stay effective as your business evolves.
Review Regularly
You need to review your dashboard often to keep it accurate and relevant. Regular reviews help you make sure the dashboard supports strategic decision-making. Do not wait for audits or annual planning. Continuous monitoring is essential for spotting new risk factors. Use technology and automation to keep your dashboard updated in real time. This approach ensures you always have the latest information for risk assessment and response.
- Regular reviews keep dashboards relevant for decision-making.
- Continuous monitoring means you do not miss emerging risks.
- Automation helps maintain real-time updates.
Gather Feedback
Gathering feedback from users is key to improving your dashboard. Collect evaluation data during implementation to find out if the dashboard meets user needs. This process helps you spot problems with functionality or engagement. Use different methods to gather feedback and improve usability.
| Feedback Method | Purpose | When to Use | Key Metrics |
|---|---|---|---|
| NPS Surveys | Measure overall satisfaction | Monthly | User satisfaction score |
| In-app Widgets | Capture immediate reactions | Continuously | Feature-specific feedback |
| User Interviews | Uncover detailed insights | Quarterly | Identify pain points |
| Usage Analytics | Track behavior patterns | Daily | Engagement rates |
Iterative design and evaluation let you refine the dashboard based on real user input. This process increases the value and effectiveness of your risk management dashboard.
Update Data Sources
To keep your dashboard reliable, start with trusted and current data sources. Automate data integration to reduce errors and improve efficiency. Schedule regular audits of your data sources and integration processes. Assign ownership and set quality standards to address inaccuracies. Strong data governance ensures your dashboard provides accurate risk information.
Ensure Security
You must protect sensitive data in your risk management dashboard. Start by classifying data based on sensitivity. Define security levels and create classification tiers. Use strong identity and access management controls. Apply the principle of least privilege so users only access what they need. Build multiple layers of defense around critical data. Remove implicit trust and always verify access. Proactively identify and fix risks to create a compliant, resilient environment. Continuous security monitoring and real-time monitoring help you detect threats early and tighten user access.
| Feature | Description |
|---|---|
| Row and Column Level Control | Refine access so users only see permitted data. |
| Data Security | Prevent data leakage and protect sensitive information. |
| Personalized Display | Show tailored content based on user roles. |
| Efficient Permission Management | Simplify permission allocation and reduce administrative work. |
FineBI supports governance and access control for your dashboard. You can manage permissions, track user activity, and ensure compliance with audit trails. These features help you maintain strong security and continuous security monitoring for your risk management dashboard.
What is a risk management dashboard? This tool gives you a real-time view of security threats, compliance gaps, and operational risks. You use it to track, analyze, and respond to risk across your organization, supporting security and decision-making at every level.
To build an effective risk management dashboard, follow these principles:
| Key Principle | Description |
|---|---|
| Tailoring to specific needs | Customize dashboards for your audience, such as boards or executives. |
| Utilizing visuals for clarity | Use visual elements to make complex security data easy to understand. |
| Ensuring regular updates | Update dashboards often to keep security information accurate. |
| Focusing on trends | Highlight trends to see how risk changes over time. |
| Connecting risks to controls | Show how you manage risk through security controls. |
| Aligning with risk appetite | Reflect your organization's risk tolerance. |
| Maintaining an executive-level perspective | Present information suitable for high-level decision-makers. |
FineBI helps you scale and customize your risk management dashboard. You can use features like Q&A data retrieval, intelligent reporting, and AI agent decision support to improve security and collaboration.
Next steps for your risk management dashboard:
- Create a risk register with essential fields like risk ID, description, and impact.
- Update your risk register and review it regularly.
- Use a risk assessment matrix to visualize security priorities.
- Develop mitigation plans with clear ownership.
- Implement dashboard templates for real-time monitoring.
By following these steps, you ensure your risk management dashboard supports security, data-driven decisions, and continuous improvement.

Continue Reading About Risk Management Dashboard
Best Dashboard Apps for Business Insights
What is a Call Center Dashboard and Why Does It Matter
What is a Reporting Dashboard and How Does it Work
What is An Interactive Dashboard and How Does It Work
What is a Call Center Metrics Dashboard and How Does It Work


FAQ

The Author
Lewis
Senior Data Analyst at FanRuan
Related Articles

Portfolio Reporting for PMOs: 9 Executive Metrics Every Weekly Portfolio Dashboard Should Include
Weekly portfolio reporting should help executives answer three questions fast: Are we delivering the right initiatives, are we putting outcomes at risk, and what decisions need leadership this week? For PMOs, that means
Yida Yin
Jul 01, 2026

How to Build an Investment Portfolio Reporting Dashboard for Executives: KPIs, Benchmarks, and Drill-Down Views
Investment portfolio reporting for executives is not about showing every holding, transaction, and chart your investment team can produce. It is about giving CEOs, CFOs, CIOs, boards, and investment committees a fast, re
Yida YIn
Jun 25, 2026

12 KPI Reporting Examples for Executive Dashboards: What to Show in Weekly, Monthly, and Quarterly Reviews
Executive leaders do not need more data. They need decision ready $1 examples that match how often they review the business and what actions they are expected to take. A weekly $1 should surface fast moving risks and per
Yida YIn
Jun 25, 2026