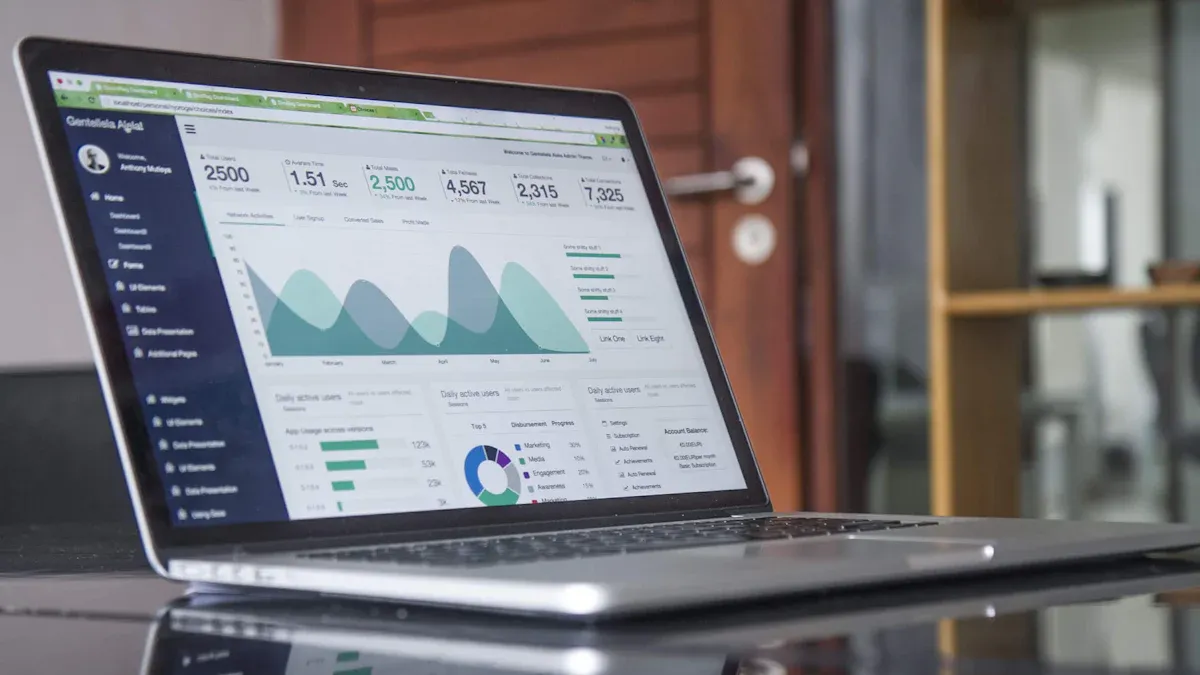
A call center metrics dashboard gives you a clear view of your team’s performance and customer interactions. You can track important numbers like response times and resolution rates. When you visualize key metrics, you spot trends and areas for improvement quickly. Recent studies show that data visualizations help you set meaningful performance goals, leading to better operational efficiency. FineBI helps you build dashboards that make it easier to analyze customer feedback and measure results.
Call Center Metrics Dashboard Overview
What Is a Call Center Metrics Dashboard
A call center metrics dashboard acts as your digital command center. You use it to monitor and analyze the most important metrics in your call center. This dashboard gives you a comprehensive overview of operations, helping you improve agent performance and customer satisfaction. You see real-time data and historical trends, which allow you to make informed decisions quickly.
The core purpose of a call center metrics dashboard is to drive significant change in your customer service operations. You set meaningful performance targets, establish alert thresholds, and maintain momentum through regular reviews. The dashboard helps you cultivate a data-driven culture, empowering agents with performance data and encouraging ownership. You also measure the return on investment by evaluating improvements in service metrics.
Tip: A call center metrics dashboard helps you translate raw data into actionable insights. You can enhance operations and customer experience by focusing on the right metrics.
Here are some of the most common types of data visualized in a call center metrics dashboard:
| Metric | Description |
|---|---|
| First Call Resolution (FCR) | Indicator of customer satisfaction and agent efficiency, trackable when visualized. |
| Average Handle Time (AHT) | Exposes inefficiencies in call handling processes when visualized. |
| Call Abandonment Rate | Percentage of callers who hang up before connecting, indicating long wait times or inadequate staffing. |
| Calls per Hour | Helps anticipate peak call times for optimized staff scheduling. |
| Average Call Duration | Highlights complex customer issues or agent performance differences. |
| Customer Satisfaction (CSAT) | Pinpoints issues in the customer journey through visual representation. |
| Cost per Call | Reveals financial efficiency of call center operations. |
You also track metrics such as average time to answer, call volume, missed calls, and abandoned calls. These metrics provide insight into staffing needs, operational efficiency, and customer experience.
How It Works
A call center metrics dashboard operates by collecting data from multiple sources and transforming it into visual insights. You connect your dashboard to databases, phone systems, and customer service platforms. The dashboard processes this data and displays it in charts, tables, and graphs.
The workflow typically involves these steps:
- Data Integration: You connect to various data sources, such as call logs, CRM systems, and customer feedback platforms. The dashboard pulls in real-time and historical data.
- Data Processing: You clean and organize the data. The dashboard applies formulas, joins tables, and creates calculated fields to ensure accuracy.
- Visualization: You use drag-and-drop tools to build charts and tables. The dashboard displays key performance metrics in a clear and interactive format.
- Monitoring and Analysis: You monitor real-time activity and analyze historical trends. Drill-down functionality lets you investigate specific metrics for targeted improvements.
| Evidence Type | Description |
|---|---|
| Real-time data | Provides immediate insights into current call center activity, enabling quick issue resolution. |
| Historical trends | Offers context for performance analysis, helping identify patterns for long-term strategic decisions. |
| Drill-down functionality | Allows deeper investigation into specific metrics, facilitating targeted improvements and coaching. |
You use the dashboard to set alert thresholds. When a metric crosses a critical value, the dashboard notifies you immediately. Regular reviews of dashboard data foster collaborative problem-solving and continuous improvement. You cultivate a data-driven culture by sharing performance data with your team.
FineBI for Call Center Dashboards
FineBI gives you powerful tools to build and manage your call center metrics dashboard. You benefit from self-service features that let you access and analyze data independently. FineBI reduces your reliance on IT and enables you to create dashboards without technical expertise.
| Feature | FineBI | Tableau/Power BI |
|---|---|---|
| Self-Service BI | Yes | Yes |
| Built-in ETL Functions | Yes | Limited |
| Integration with Big Data | Yes | Yes |
| Drag-and-Drop Functionality | Yes | Yes |
| Free for Personal Use | Yes | No |
| Focus on Enterprise Use | Yes | Yes |
FineBI supports component-based reports, multi-dimensional analysis, and a wide range of data visualization options. You can include tables, charts, and controls for visual data analysis. OLAP operations such as drilling, linkage, rotation, dicing, slicing, and jumping help you explore performance metrics from different angles.
| Feature | Description |
|---|---|
| Component-based reports | Dashboards can include various components like tables, charts, and controls for visual data analysis. |
| Multi-dimensional analysis | Supports OLAP operations such as drilling, linkage, rotation, dicing, slicing, and jumping. |
| Data visualization options | Offers various options for visual representation of data, enhancing the dashboard's effectiveness. |
You collaborate with your team using FineBI. All departments work from the same data source, which improves transparency and decision-making. Marketing teams and call center managers create real-time dashboards for campaign and performance tracking. You can monitor agent performance, customer satisfaction, and operational efficiency in one place.
Note: FineBI’s self-service approach allows non-technical users to independently access and analyze data. You save time and improve productivity by reducing your reliance on IT support.
FineBI stands out for its built-in ETL functions, enterprise-grade features, and free personal use option. You can process and visualize large volumes of call center data efficiently. FineBI helps you unlock actionable insights and drive continuous improvement in your contact center dashboard.
Key Metrics in Call Center Metrics Dashboard
Performance Metrics in Call Center Metrics Dashboard
You need to track performance metrics to understand how your call center operates. These metrics show you how well your team handles calls and manages customer interactions. The most critical performance metrics include call volumes, connect rates, conversion rates, average handle time, and lead response time. You also monitor agent-level statistics, transfer rates, and revenue generated per call. These metrics help you identify strengths and weaknesses in your operations.
| Metric | Description |
|---|---|
| Call volumes and connect rates | Gauges outreach effectiveness |
| Conversion rates | Analyzes sales pipeline at various stages |
| Average handle time | Assesses call center agent efficiency |
| Lead response time | Measures the time taken to respond to leads |
| Revenue generated per call | Assesses financial performance per call |
FineBI makes it easy for you to visualize these performance metrics. You can use drag-and-drop tools to create interactive dashboards. This helps you spot trends and make quick decisions to improve your call center metrics.
Tip: Tracking performance metrics in your contact center dashboards helps you set realistic goals and measure progress over time.
Quality and Customer Metrics in Call Center Metrics Dashboard
Quality and customer satisfaction metrics give you insight into the customer experience. You track customer satisfaction scores, net promoter scores, and real-time feedback mechanisms. These metrics show you how customers feel about your service and where you can improve.
| Metric Type | Impact on Customer Satisfaction |
|---|---|
| Customer Satisfaction Score | Provides direct feedback on customer experiences |
| Net Promoter Score | Indicates likelihood of customers recommending the service |
| Real-time Feedback Mechanisms | Allows for immediate response to customer concerns |
Tracking customer metrics helps you identify trends and areas for improvement. You can adapt your strategies based on real-time data. FineBI enables you to correlate customer satisfaction metrics with financial outcomes, showing how improvements lead to better business performance.
Agent and Team Metrics in Call Center Metrics Dashboard
Agent and team metrics focus on individual and group performance. You monitor average handling times, first call resolution rates, agent utilization rates, and schedule adherence. These metrics help you evaluate agent performance and team efficiency.
| Metric | Description |
|---|---|
| Average Handle Time (AHT) | Measures the total duration of customer interactions, including talk time, hold time, and after-call work. |
| First Contact Resolution Rate (FCR) | Indicates the effectiveness of agents in resolving issues on the first contact. |
| Agent Utilization Rate | Evaluates how effectively agents are using their time during shifts. |
| Schedule Adherence | Looks at how well agents stick to their scheduled work times. |
FineBI offers a user-friendly platform for visualizing agent and team metrics. You can create reports and dashboards without technical skills. Interactive dashboards make it easier for you to manage agent performance and improve first call resolution rates.
Using a Call Center Metrics Dashboard in Practice

Real-Time Monitoring
You use a call center metrics dashboard to monitor your operations as they happen. Real-time dashboards give you second-by-second visibility into key metrics. You see how many calls are in progress, how long customers wait, and how agents perform. Immediate access to data lets you respond quickly to changes in call volume or customer needs.
Managers rely on real-time dashboards to spot issues as they occur. You can adjust staffing, change call routing, or address customer complaints before they escalate. This proactive approach improves customer satisfaction and keeps your team focused on performance goals.
| Benefit | Description |
|---|---|
| Immediate Visibility | Provides agents and managers with instant access to performance metrics, enhancing customer interactions. |
| Proactive Management | Enables quick adjustments to strategies based on real-time data, improving performance targets. |
| Enhanced Decision-Making | Empowers decision-makers to respond swiftly to changing conditions, ensuring optimal resource allocation. |
- Real-time dashboards provide instant visibility into your call center dashboard metrics.
- You identify trends and spot issues as they happen.
- Immediate data access allows you to respond swiftly to operational changes.
Tip: Real-time monitoring in your call center dashboard helps you maintain high customer satisfaction and operational responsiveness.
Historical Analysis
You use your call center metrics dashboard to analyze historical data and uncover long-term trends. Reviewing past performance helps you understand how changes in training, staffing, or protocols affect customer satisfaction and call resolution rates. You track metrics like first call resolution rates and customer satisfaction scores over weeks or months.
Historical analysis in your contact center dashboard lets you tailor training programs and improve efficiency. You see which strategies work best and where you need to make adjustments. This approach supports continuous improvement and helps you set realistic performance targets.
| Metric | Description |
|---|---|
| Customer Satisfaction Scores | Monitoring these scores over time helps identify the impact of changes in training or protocols. |
| First Call Resolution Rates | Understanding this metric's influence on customer satisfaction guides targeted improvements. |
| Performance Data Analysis | Systematic review of metrics allows for tailored training programs and enhanced efficiency. |
Note: Historical analysis in your call center dashboard reveals patterns that drive better decision-making and long-term success.
Actionable Insights
Your call center metrics dashboard transforms raw data into actionable insights. You use these insights to improve customer satisfaction, boost agent performance, and optimize call resolution rates. Real-time monitoring enhances your responsiveness to customer needs. Improved data visualization makes complex data easy to interpret.
You foster a culture of accountability by sharing dashboard results with your team. Tracking changes over time helps you measure the impact of new strategies. Enhanced decision-making capabilities lead to better customer experiences and higher performance.
- Real-time monitoring improves responsiveness to customer needs.
- Data visualization simplifies complex data interpretation.
- Enhanced decision-making leads to better customer experiences.
- Tracking changes over time supports continuous improvement.
- Accountability increases within your team.
Tip: Use actionable insights from your contact center dashboard to drive continuous improvement and maintain high customer satisfaction.
FineBI Workflow Example
FineBI makes it easy for you to build and use a call center metrics dashboard. You follow a clear workflow that guides you from data integration to dashboard sharing.
Step-by-Step Example: Building a Call Center Dashboard with FineBI
- Connect to Data Sources
You start by connecting FineBI to your call logs, CRM, and customer feedback systems. FineBI supports over 60 connectors, including databases, cloud platforms, and APIs.
- Prepare and Process Data
You create self-service datasets by selecting relevant fields, joining tables, and adding calculated metrics like call resolution rates and customer satisfaction scores. FineBI lets you clean and refine your data with built-in tools. - Visualize Metrics
You use drag-and-drop functionality to build interactive charts and tables. You display key metrics such as first call resolution rates, average handle time, and customer satisfaction. FineBI supports OLAP operations, so you can drill down into specific agent or team performance.
- Publish and Share Dashboards
You preview your dashboard, customize the layout, and publish it for your team. FineBI provides secure sharing options and role-based access control. You set up alerts for critical metrics, such as low call resolution rates or declining customer satisfaction. - Monitor and Improve
You monitor real-time dashboards and review historical trends. You use actionable insights to adjust training, staffing, and workflows. FineBI’s collaborative features help your team stay aligned and focused on performance goals.
Note: FineBI’s self-service approach empowers you to build and manage your call center metrics dashboard without technical expertise. You gain full control over your contact center dashboard and drive continuous improvement.
Essential Features and Best Practices in Call Center Metrics Dashboard
Dashboard Design Tips
You want your call center dashboard to deliver clear insights and drive better performance. Focus on the metrics that matter most. Highlight key performance indicators such as average handle time, first call resolution, and customer satisfaction scores. Use visual hierarchies to guide attention to critical data. Organize charts and tables so users can find information quickly. Enhance data visibility with clear graphs and color coding. Simplify navigation by grouping related metrics and using intuitive menus.
Tip: Present information in a way that helps users act fast. Use visual cues to make important trends stand out.
Here are best practices for designing user-friendly dashboards:
- Highlight key performance indicators to inform strategy adjustments.
- Enhance data visibility with effective visualizations.
- Simplify navigation for quick access to insights.
- Utilize visual hierarchies to guide attention to critical metrics.
Integration and Security
Effective call center dashboards rely on seamless integration and robust security. Connect your dashboard to multiple data sources for a complete view of operations. Automated data flow boosts productivity and reduces manual reporting time. Centralized API management ensures consistency and compliance. Secure data access protects sensitive customer information. Authentication and security layers help you manage users and comply with regulations.
| Aspect | Description |
|---|---|
| System Integration Efficiency | Automated data flow enhances productivity and operational efficiency. |
| Enterprise Data Governance | Centralized API management safeguards sensitive customer information. |
| API Gateway and Management | Secures and manages data access across call center systems. |
| Authentication and Security Layer | Ensures secure data distribution and user management in compliance with regulations. |
Note: Strong integration and security measures keep your call center dashboard reliable and trustworthy.
FineBI Advantages
FineBI gives you unique strengths for building and managing call center dashboards. You get a user-friendly interface that simplifies analysis. Self-service capabilities let you process and visualize data without coding. FineBI offers tailored analysis models for call center metrics dashboard needs, such as pyramid and RFM models. Real-time query capabilities allow you to monitor live data and respond quickly. You can display both real-time and extracted data on the same dashboard for comprehensive analysis. Flexible data analysis tools help you switch views and debug metrics easily. Departmental collaboration features enable teams to share findings and improve performance together.
| Feature | Advantage |
|---|---|
| User-friendly interface | Simplifies analysis for business users. |
| Self-service capabilities | Empowers users to process and visualize data independently. |
| Tailored analysis scenarios | Provides specific models for call center analytics. |
| Real-time query capabilities | Enhances responsiveness in call center operations. |
| Departmental collaboration | Fosters teamwork and shared performance improvement. |
Tip: FineBI supports real-time data analysis and collaboration, helping you drive continuous improvement in your call center dashboard.
A call center metrics dashboard helps you improve performance and make better decisions. You monitor key metrics, boost customer satisfaction, and increase accountability across your team. FineBI supports efficient dashboard creation, real-time insights, and secure data management. You can start by identifying important metrics and integrating your data sources. Try FineBI's free trial to explore features and share dashboards with your team. Focus on continuous improvement by reviewing results and adapting your strategies.
| Benefit | Description |
|---|---|
| Improved Operational Efficiency | You monitor key metrics and align your call center with business goals. |
| Increased Customer Satisfaction | You use best practices to deliver better customer experiences. |
| Enhanced Accountability | You share performance data to foster transparency and learning. |
Begin with stakeholder consultation, connect your data, and train your team. Use predictive analytics and custom dashboards to coach agents and optimize customer interactions.
Continue Reading About Call Center Metrics Dashboard
What is a Dashboard and How Does It Work
Store Performance Dashboard: Your Retail Command Center
How to Craft an Effective Analytics Dashboard
What is a Digital Dashboard and How Does It Work
What is a KPI Dashboard and Why Your Business Needs One


FAQ

The Author
Lewis
Senior Data Analyst at FanRuan
Related Articles

What Recruiters Look for in a Data Analysis Portfolio: 10 Criteria to Score Yours Fast
A $1 is not judged like a school assignment. It is judged like a hiring shortcut. Recruiters, hiring managers, and analytics leads use it to answer one question fast: Can this person solve business problems with data in
Lewis Chou
May 29, 2026

What Is Data Analytics Consulting? Beginner’s Guide to Services, Deliverables, and Business Value
$1 helps organizations turn raw data into decisions they can trust. For many business leaders, the challenge is not a lack of data. It is a lack of clarity. Reports conflict, teams track different KPIs, dashboards are un
Lewis Chou
Jun 03, 2026

Data Analyst Job Description [+2026 Guide]: Compare Responsibilities, Skills, and Salary by Industry
A strong $1 does more than list tasks. It defines how a company turns raw data into business decisions, which teams the analyst supports, and what measurable outcomes the role is expected to influence. For employers, tha
Lewis Chou
Jun 02, 2026