A benchmark dashboard is a decision-making tool that helps operations leaders compare performance across teams, locations, and time periods in one place. Its business value is simple: it turns scattered KPIs into a fair, structured view of who is performing well, where gaps exist, and what to improve next.
If you manage multiple teams, sites, shifts, or business units, you already know the pain points. Raw reports make every group look different for reasons that may have nothing to do with actual performance. One site handles more volume. One team supports harder cases. One region has staffing shortages. Without benchmarking, leaders end up debating the numbers instead of acting on them.
A well-built benchmark dashboard solves that. It normalizes data, adds context, and highlights meaningful differences so leaders can make faster, better decisions.
Click To Try The Dashboard
What a benchmark dashboard is and why it matters
In practical terms, a benchmark dashboard is a visual analytics layer that compares performance against a reference point. That reference point could be:
Another team
Another site
A historical baseline
A target threshold
A peer-group average
A top-performer benchmark
For operations directors, plant managers, service leaders, and BI teams, this matters because comparison is what makes metrics useful. Seeing a team hit 92% SLA compliance is not enough. You need to know whether 92% is above average, below target, improving over time, or lagging behind similar teams.
A benchmark dashboard differs from a standard reporting dashboard in a few important ways:
Core metrics and comparisons to include in a benchmark dashboard
The most effective benchmark dashboard balances breadth and focus. It should cover the few metrics that truly drive business outcomes while allowing fair comparisons across entities and time.
Key Metrics (KPIs)
Below are the core KPI categories most benchmark dashboards should include:
Productivity: Output relative to time or labor input, such as units per hour, tickets closed per rep, or calls handled per shift.
Quality: Accuracy or defect-related measures, such as error rate, rework rate, audit score, or customer complaint rate.
Compliance: Adherence to required procedures, policies, or standards, such as checklist completion, policy conformance, or regulatory pass rate.
Cost Efficiency: Financial performance metrics such as cost per transaction, labor cost per unit, or overtime percentage.
Service Level: Customer-facing performance measures such as SLA attainment, response time, resolution time, or on-time delivery.
Utilization: The degree to which staff, assets, or capacity are being used productively.
Throughput: The volume processed within a given period, useful for contextualizing productivity and scale.
Variance to Target: The difference between actual performance and predefined goals or thresholds.
Trend Performance: Direction and speed of change across time, including week-over-week or year-over-year movement.
Benchmark Rank or Quartile: Relative standing versus peers, such as top quartile, median, or bottom decile.
These metrics help leaders answer the most important benchmarking question: Who is performing better, under what conditions, and by how much?
Team-to-team comparisons
Team-level benchmarking is often the fastest path to performance improvement because managers can directly influence coaching, staffing, workflows, and execution.
Useful team-to-team metrics include:
Productivity per employee or per labor hour
Quality score or defect rate
Compliance adherence rate
Cost per completed task or service interaction
SLA attainment or turnaround performance
The key is normalization. If one team handles twice the volume or more complex work, raw totals will distort the picture. A benchmark dashboard should support normalized views such as:
Output per FTE
Defects per 1,000 transactions
Cost per case
Time per standardized work unit
SLA results by case complexity tier
This lets leaders compare execution quality, not just workload size.
Site-to-site comparisons
Site benchmarking is more complex because location differences can be structural, not just operational. A high-performing urban facility may not be directly comparable to a rural site with different labor availability, customer mix, or logistics constraints.
That is why a benchmark dashboard should account for factors such as:
Regional demand patterns
Staffing mix and experience levels
Process variation across sites
Product or case complexity
Local regulatory or infrastructure constraints
Fair comparison methods include:
Comparing only similar sites within peer groups
Using indexed scores instead of raw totals
Adjusting performance by volume, labor availability, or complexity
Showing variance against site-specific baselines
Ranking within operational cohorts rather than enterprise-wide only
This prevents misleading rankings and helps leaders identify truly replicable best practices.
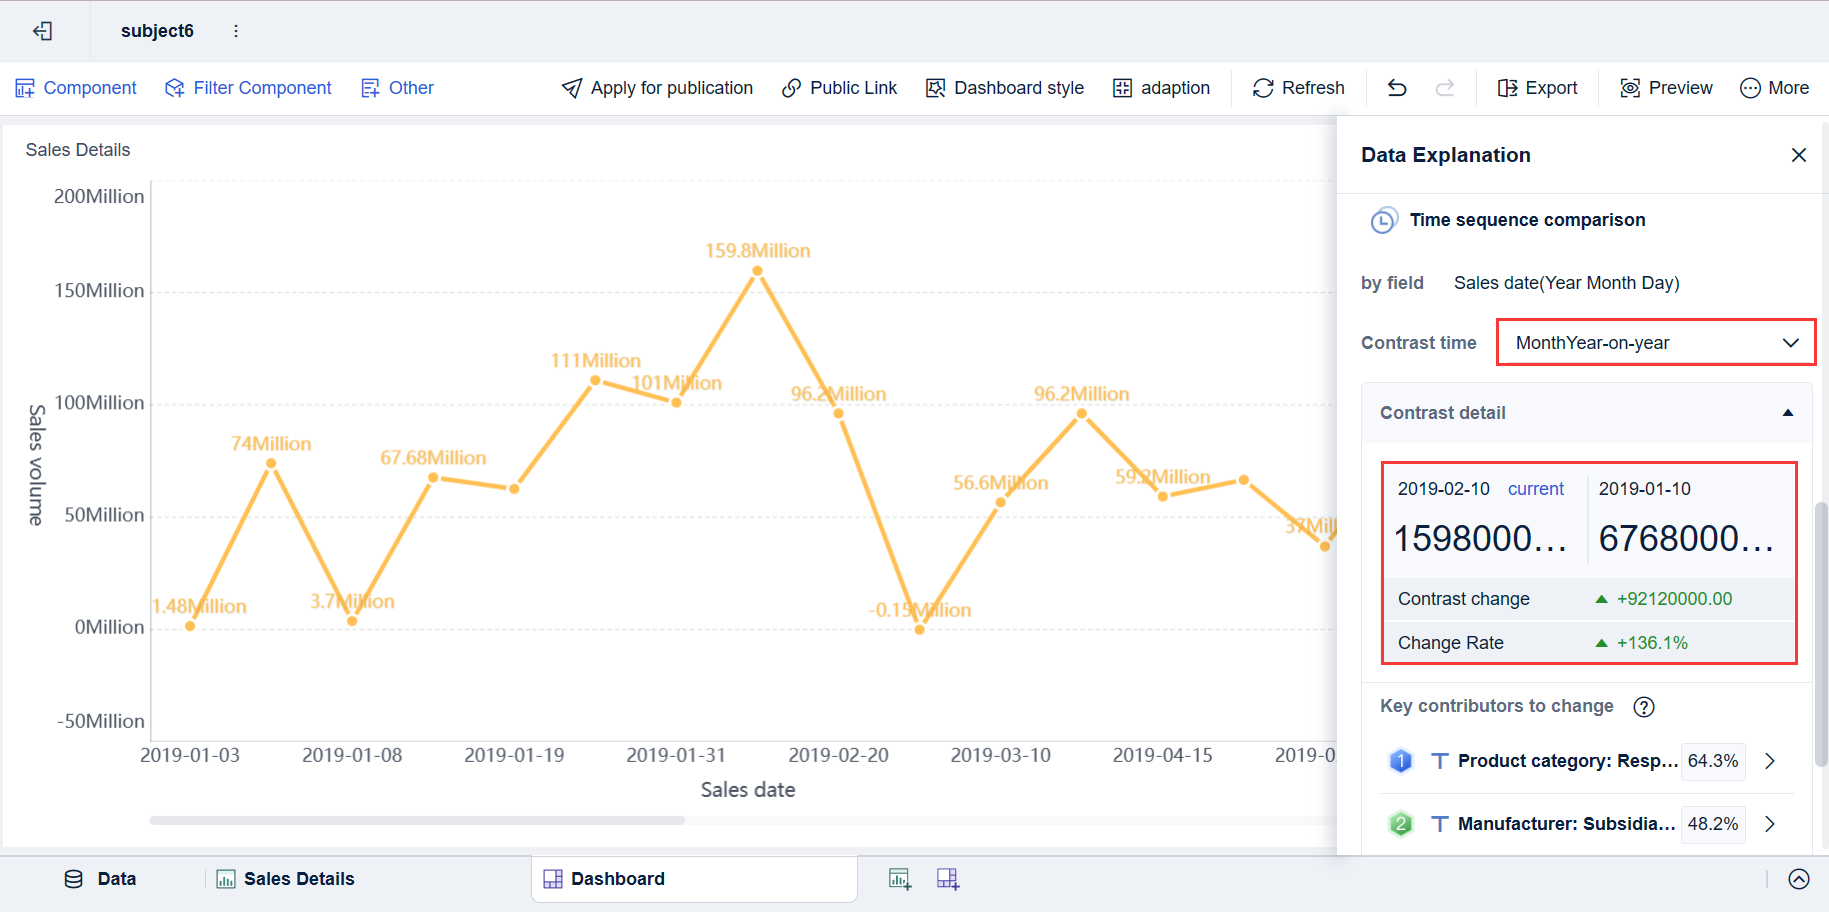
Time-period comparisons
Time-based benchmarking helps leaders distinguish one-off variance from sustained change. It adds the context needed to avoid overreacting to short-term noise.
A practical benchmark dashboard should support:
Week-over-week comparisons
Month-over-month comparisons
Quarter-over-quarter comparisons
Year-over-year comparisons
To make those views useful, include:
Trend lines to show direction over time
Seasonality indicators to explain expected fluctuation
Baseline ranges to show normal performance bands
Rolling averages to reduce volatility
Variance markers to highlight meaningful movement
For example, if customer wait time rises in December, the dashboard should help leaders see whether that is an unusual operational issue or a predictable seasonal spike.
How to design a benchmarking dashboard that leaders can actually use
A benchmark dashboard only creates value if leaders trust it and can act on it quickly. The biggest design mistake is trying to show everything at once. The goal is not maximum data density. The goal is faster, fairer decisions.
Choose the right benchmarks
Not all benchmarks are equally useful. The right benchmark depends on the decision you want to support.
Common benchmark types include:
Internal benchmarks: Compare teams, sites, or regions within your own organization.
Peer-group benchmarks: Compare similar units with comparable workloads or operating conditions.
Historical baselines: Compare current performance against prior periods.
Target thresholds: Compare actuals against strategic or operational goals.
You should also decide when to benchmark against top performers versus the median.
Use top-performer benchmarks when you want to identify best practices and stretch capability.
Use median benchmarks when you want realistic comparisons for broad operational improvement.
Use target thresholds when governance, service, or compliance standards must be met regardless of peer performance.
A seasoned consultant’s rule: if the benchmark does not support a decision, it should not be on the dashboard.
Make comparisons fair and actionable
Leaders reject dashboards when comparisons feel unfair. To make benchmarking credible, segment the data before ranking it.
Key segmentation dimensions include:
Role
Shift
Region
Volume band
Customer type
Product line
Complexity level
Channel
This matters because two teams with the same KPI score may be operating in very different conditions.
To make outliers explainable, use:
Filters to narrow the context
Cohorts to group comparable entities
Drill-downs to inspect contributing drivers
Metric definitions that are visible and standardized
Sample-size indicators to avoid overreading small populations
When leaders can click from a red scorecard into workload mix, staffing levels, or process adherence, the benchmark dashboard becomes operationally useful instead of politically risky.
Visual elements that improve decision-making
The best benchmark dashboard designs are visually simple but analytically rich. Each visual should answer a specific business question.
Recommended visual elements include:
Scorecards: Show current KPI values, target variance, and benchmark status at a glance.
Ranked tables: Help identify top and bottom performers quickly.
Variance charts: Show how far actual performance is from benchmark or target.
Quartile views: Reveal distribution and relative standing, not just averages.
Heat maps: Highlight hotspots across teams, sites, periods, or metric categories.
Trend lines: Show direction and consistency over time.
Annotations: Add context for major changes such as policy shifts, outages, or staffing events.
Alerts: Flag material performance gaps that need intervention.
A practical design principle is to combine summary and explanation in the same experience. Start with high-level comparisons, then allow drill-down to root causes.
Common use cases for comparing teams, sites, and time periods
A benchmark dashboard becomes especially valuable when it is tied to recurring management workflows.
Team performance reviews
Team reviews often suffer from anecdotal management. One supervisor says a team is overloaded. Another says a different team is underperforming. Without benchmarking, these discussions become subjective.
A benchmark dashboard improves team reviews by helping leaders:
Identify top performers based on normalized output and quality
Spot lagging teams that need coaching or process support
Separate workload-driven variance from execution-driven variance
Track the impact of training or staffing changes over time
This creates a more disciplined review process and reduces reliance on opinion.
Multi-site operations management
In multi-site environments, leaders need a fast way to spot process drift and performance inconsistency. A benchmark dashboard helps compare locations side by side while accounting for differences in scale and context.
Common outcomes include:
Detecting process breakdowns at a single site
Identifying staffing model imbalances
Finding locations with repeatable best practices
Prioritizing site visits or audits based on benchmark gaps
This is especially valuable in manufacturing, retail, logistics, healthcare operations, and shared service environments where local execution varies widely.
Continuous improvement planning
Continuous improvement efforts fail when prioritization is weak. Teams generate too many ideas and act on the wrong ones.
A benchmark dashboard helps leaders prioritize actions based on:
Gap size
Business impact
Speed to improvement
Cross-site replicability
Trend direction
This makes improvement planning more rigorous. Instead of asking, "What should we work on?" leaders can ask, "Which benchmark gap is largest, most material, and most fixable?"
Common mistakes to avoid when building benchmark views
Even experienced teams make avoidable errors when building a benchmark dashboard. These mistakes usually damage trust more than they damage analytics.
The most common issues are:
Comparing raw numbers without normalization or context: Large teams and high-volume sites will dominate rankings unfairly.
Using too many metrics: When every KPI is visible, the few that truly drive outcomes get buried.
Ranking teams without caveats: Data quality, sample size, workload mix, and local constraints must be visible.
Ignoring benchmark governance: If metric definitions vary by team or site, the comparison loses credibility.
Treating benchmarks as fixed goals: Benchmarks should evolve as operations improve, markets shift, and strategic priorities change.
A good rule is to treat every ranking as the beginning of an investigation, not the end of one.
How to evaluate tools and next steps for implementation
Choosing the right platform matters because benchmarking requires more than charts. It requires governed definitions, flexible slicing, reliable refreshes, and enough interactivity for leaders to explain outliers without leaving the dashboard.
What to look for in a dashboard platform
If you are evaluating technology for a benchmark dashboard, prioritize these capabilities:
Flexible filters across team, site, region, period, and cohort
Role-based access for executives, regional leaders, site managers, and analysts
Export and sharing options for review meetings and board reporting
Reliable data refresh workflows with minimal manual effort
Historical comparison support across weekly, monthly, quarterly, and annual periods
Benchmark analytics such as ranking, quartiles, variance to target, and peer grouping
Drill-down paths from summary KPIs to root-cause detail
Clear audit trails for metric definitions and data changes
Without these capabilities, teams often fall back to spreadsheet-based benchmarking, which is slow, inconsistent, and difficult to govern.
Questions to ask before rollout
Before launching a benchmark dashboard, leadership should align on a few operational questions:
Which decisions should the dashboard improve first?
Who owns metric definitions and calculation rules?
What benchmark logic will be used: peer group, median, top quartile, target, or historical baseline?
How will local constraints be reflected in comparisons?
How often will the data refresh?
Who is responsible for maintenance and data quality review?
How will teams review results and convert insights into action?
To make rollout successful, follow these implementation best practices:
Start with a narrow decision scope. Focus first on one business workflow, such as monthly site reviews or weekly team performance checks.
Standardize metric definitions early. Resolve KPI logic before building visuals, not after stakeholders see conflicting numbers.
Normalize before you rank. Build fair comparison rules into the model from day one.
Design for drill-down. Every red metric should have an explanation path.
Embed the dashboard into management routines. If leaders do not use it in review meetings, it will become another passive report.
Building benchmark dashboards at scale with FineBI
Building this manually is complex; use FineBI to utilize ready-made templates and automate this entire workflow.
A modern benchmark dashboard is not just a collection of charts. It requires integrated data, benchmark logic, segmentation, historical analysis, permissions, and repeatable refresh processes. Trying to manage all of that through spreadsheets or one-off BI builds usually creates bottlenecks for both analysts and business users.
Consolidate data from multiple systems into a governed analytics layer
Build benchmark dashboard views with reusable templates
Compare teams, sites, and time periods with flexible filters and drill-downs
Standardize KPI logic across departments
Automate refresh workflows so leaders always work from current data
Deliver self-service analysis without losing control over definitions and access
For enterprise decision-makers, the value is straightforward: less manual reporting, faster insight generation, and more consistent performance reviews across the business.
If your current reporting setup tells you what happened but not how one group compares to another, it is time to move beyond static dashboards. A well-designed benchmark dashboard gives leaders the context to prioritize action, replicate best practices, and improve performance with confidence. FineBI is the practical way to get there faster.
FAQs
A benchmark dashboard is used to compare performance across teams, sites, or time periods against a reference point such as a target, peer average, or top performer. It helps leaders see where results are strong, where gaps exist, and where action is needed.
A regular KPI dashboard mainly shows current results, while a benchmark dashboard shows how those results compare to something meaningful. That extra context makes it easier to judge whether performance is actually good, poor, or improving.
Most benchmark dashboards include productivity, quality, compliance, cost efficiency, service level, utilization, throughput, and trend metrics. The right mix depends on the business process being compared and the decisions leaders need to make.
Fair comparisons require normalization for factors like workload, labor hours, case complexity, and local operating conditions. Using peer groups, indexed scores, and per-unit metrics helps prevent misleading rankings.
Operations leaders, plant managers, service managers, and BI teams benefit most because they need to compare performance across multiple groups and periods. It is especially useful in organizations managing several teams, locations, shifts, or business units.
Product Trial
FineReport
Pixel-perfect reports · Interactive dashboards · Easy data entry · Digital twins