A data architecture diagram gives you a visual map of how information moves and connects within your organization. You use it to track data flow, storage, and transformation, making complex systems easier to understand and manage. Many organizations rely on these diagrams to improve data integration and strengthen governance. With platforms like FineDataLink, you can quickly build diagrams using a drag-and-drop interface and connect diverse data sources. Recent industry studies show that these diagrams support business intelligence, encourage collaboration, and provide a clear vision for future growth.
| Impact Area | Description |
|---|---|
| Supporting Business Intelligence and Data-Driven Decisions | Facilitates easier access and analysis of data for quicker, informed decision-making. |
| Encouraging Collaboration Within and Between Departments | Serves as a common reference point to align goals and dismantle silos. |
| Providing a Clear Vision for Future Growth and Scalability | Aids in planning system upgrades and expansions with a comprehensive view of current data flows. |

A data architecture diagram gives you a clear picture of how information moves, transforms, and connects within your organization. You use this architecture diagram to visualize the flow of data between systems, databases, and applications. Many experts define a data architecture diagram as a high-level blueprint that shows where data is stored, how it is accessed, and how it travels across your business.
| Source | Definition |
|---|---|
| OWOX | A data architecture diagram visually represents how data is moved, stored, and accessed within an organization, providing a high-level blueprint of the data environment. |
| TechTarget | It includes components like data models, data definitions, and data flow diagrams that illustrate how data flows through systems and applications. |
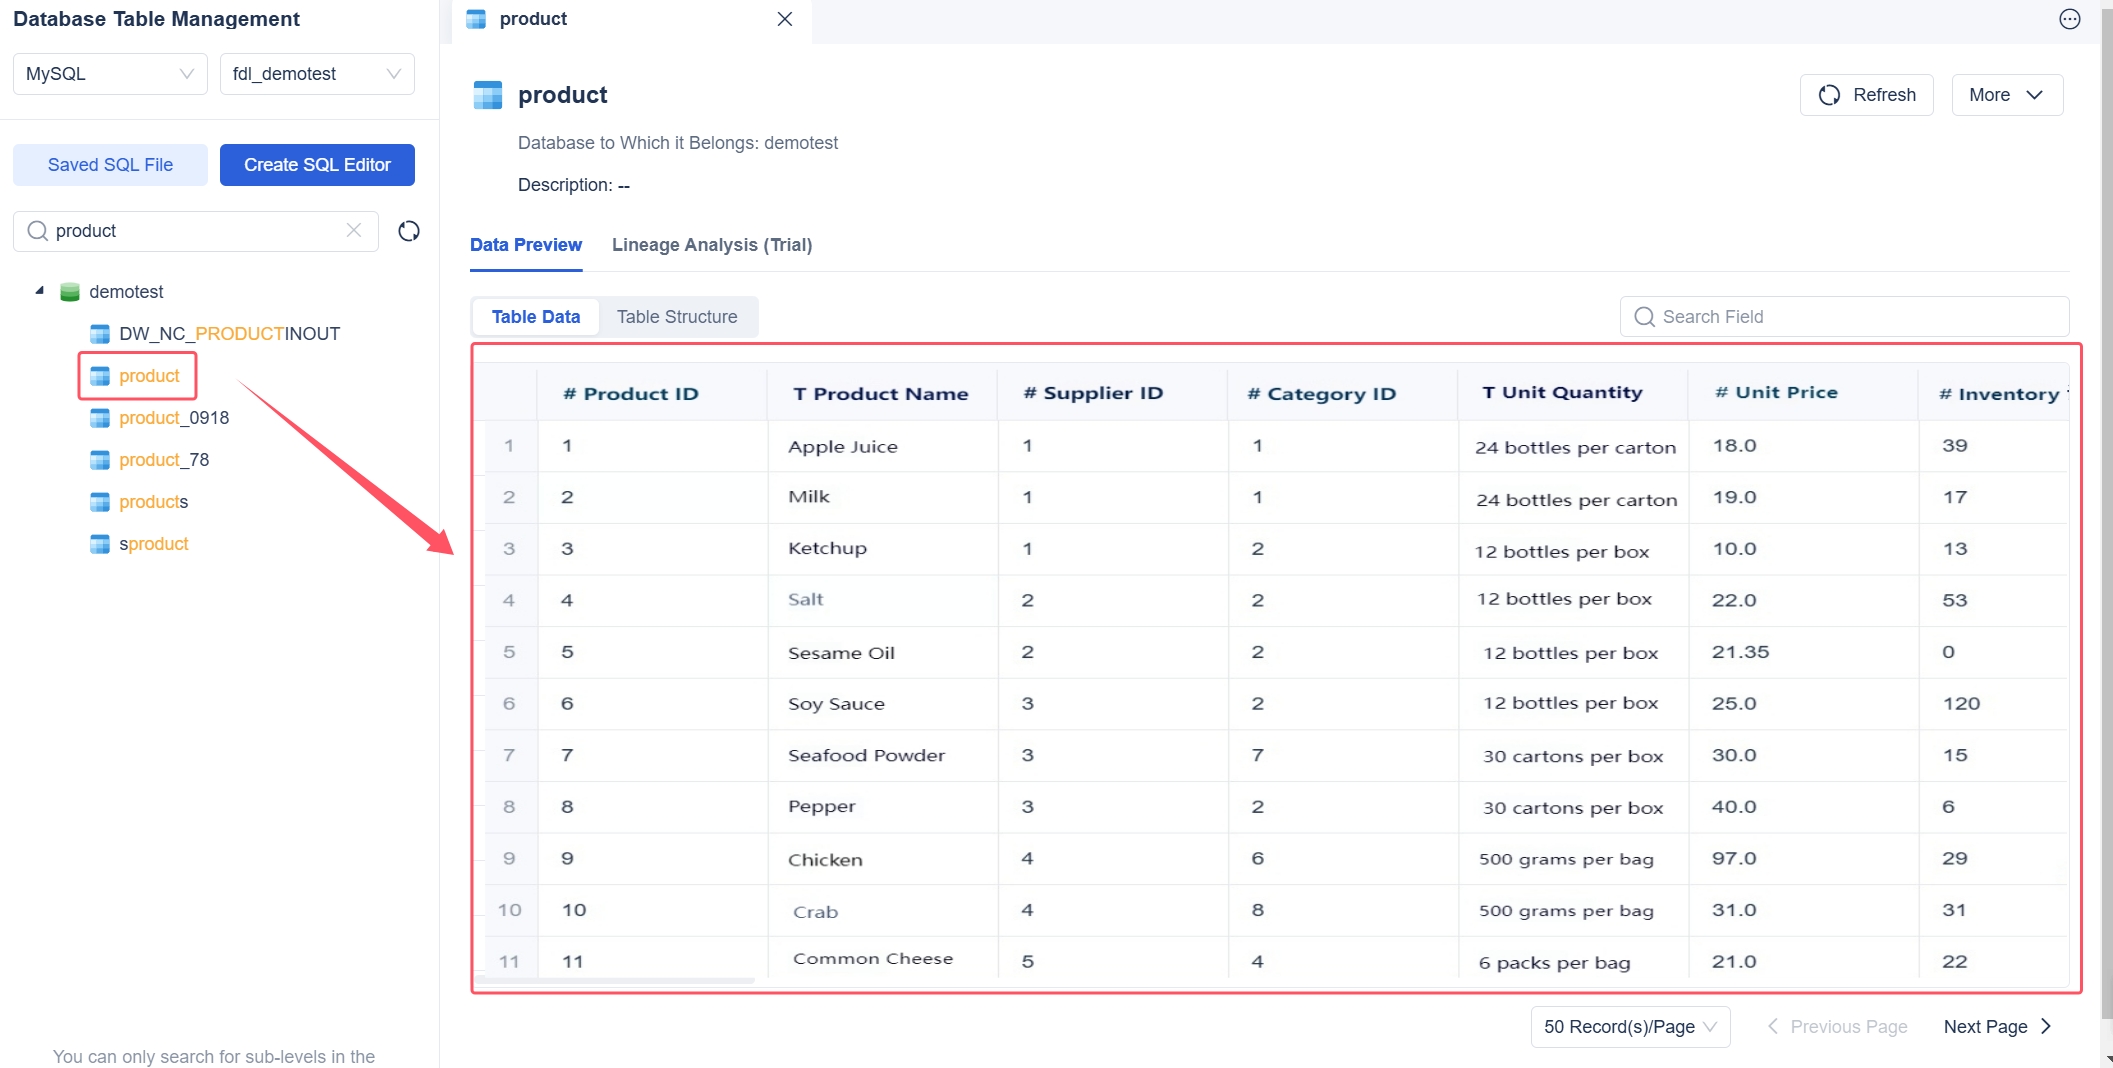
You often see architecture diagrams used to outline the main entities in a system, such as customers, orders, and products. This helps both technical and non-technical stakeholders understand the structure and flow of data. Technology diagrams for business stakeholders bridge the gap between IT and business teams, making sure everyone can engage with the data environment.
You rely on data architecture to manage information efficiently and support your business goals. A well-designed architecture diagram helps you organize data, maintain quality, and ensure compliance with regulations.
A strong data architecture diagram improves decision-making. You get accurate insights for informed actions and uncover hidden patterns through advanced analytics. For example, a retail company increased sales by using data architecture to target marketing strategies. A healthcare provider improved patient outcomes with better data-driven decisions.
| Risk Type | Description |
|---|---|
| Complexity and Cost | Designing and implementing a comprehensive data architecture is often complex and expensive, requiring significant investment. |
| Data Quality Issues | Poor data quality can undermine the effectiveness of your architecture diagram. |
| Scalability Challenges | Rapid data growth can overwhelm systems, causing performance bottlenecks. |
| Security and Privacy Concerns | Handling sensitive data introduces security and privacy risks, requiring robust protection. |
| Technological Obsolescence | Fast-changing technology can make your architecture outdated, requiring ongoing upgrades. |
Effective data architecture integrates information from many sources and presents it clearly. You gain actionable insights, identify market trends, and predict future scenarios. This reduces guesswork and supports strategic planning.

When you build a data architecture diagram, you need to include several core elements to ensure clarity and usefulness. Each element helps you communicate the structure and flow of your data architecture. The table below outlines the universally recognized core elements:
| Core Element | Description |
|---|---|
| Accuracy | Represent the architecture diagram truthfully without oversimplification. |
| Metadata Inclusion | Add metadata such as title, description, and version for context. |
| Use of Official Icons | Use the latest official icons and naming conventions for all technologies shown. |
| Provide a Legend | Include a legend to explain unique symbols or line types. |
| Design for Accessibility | Ensure diagrams are accessible, using clear color contrast and patterns. |
| Layering | Present information in layers to avoid overcrowding and improve understanding. |
| Version Control | Store diagram source files with other versioned assets for consistency and tracking. |
Different industries may focus on specific elements. For example, user-friendly interfaces help non-technical users interact with the architecture diagram. Scalability and performance matter when your data architecture must handle rapid data growth. Automated data anonymization supports privacy regulations. You should also include data validation mechanisms to ensure quality, define governance policies for ownership and access, and comply with industry standards.
Business architecture diagrams help your teams align quickly. They make sure business priorities match IT solutions, which improves decision-making and resource allocation.
You will encounter several types of architecture diagram in enterprise data management. Each type serves a unique purpose and audience. The table below summarizes the main types:
| Diagram Type | Description |
|---|---|
| Information Architecture Diagrams | Show information assets, data flows, and data stores. Example: Entity Relationship Diagrams. |
| Enterprise Architecture Data Flow Diagrams | Illustrate how data moves through processes and systems, revealing dependencies and bottlenecks. |
| Business Process Models & Flowcharts | Guide teams through processes, highlighting key decision points and streamlining operations. |
| Business Architecture Diagrams | Capture business vision and goals, tracking transformative projects. |
| Organization Charts | Display roles and hierarchy, showing costs for business units. |
| Gantt Charts and Roadmaps | Show lifecycle dependencies of applications and assist in planning roadmaps. |
You will also see conceptual, logical, and physical data architecture diagrams. A conceptual model focuses on high-level business requirements and relationships. A logical model defines data elements and their relationships without tying them to a specific database. A physical model provides the actual implementation details for a database system. You can use these models together to move from business needs to technical solutions.
An application architecture diagram often appears alongside a data architecture diagram. It shows how software applications interact with your data architecture. You may use an application architecture diagram to map out system dependencies and integration points, which helps you plan upgrades and troubleshoot issues.
You need a clear process when creating a data architecture diagram. Experts recommend a step-by-step approach to ensure accuracy and clarity. Follow these steps to build your architecture diagram:
Tip: Use standardized symbols and notations. Focus on clarity and simplicity. Select the right diagram type and tool for your needs. Make your diagrams visually appealing to engage stakeholders.
When you create your architecture diagram, avoid common mistakes. The table below highlights errors organizations often make:
| Mistake | Description |
|---|---|
| Theoretical Diagrams | Abstract diagrams that do not represent your specific organizational architecture. |
| Mixing Levels of Abstraction | Combining high-level and low-level resources in one diagram, which leads to confusion. |
| Unlabeled Arrows | Arrows without labels create ambiguity about relationships between resources. |
| Missing Context | Lack of context makes it hard for viewers to understand your architecture diagram. |
You should always label lines and arrows. Include a key or legend for colors and shapes. Explain line styles and arrowheads to clarify connections.
You have many options when choosing tools for creating a data architecture diagram. The table below summarizes popular platforms and their features:
| Platform | Description |
|---|---|
| Microsoft Visio | Comprehensive diagramming tools integrated into Microsoft 365. |
| Lucidchart | Cloud-based platform with strong collaboration features. |
| SmartDraw | Extensive template libraries for various industries. |
| Gliffy | Integration capabilities for a wide range of use cases. |
| Creately | User-friendly interface and affordability for individuals and enterprises. |
| Edraw (Wondershare) | Versatile and easy-to-use design for diagramming. |
| Software AG (ARIS) | Advanced features for enterprise architecture management. |
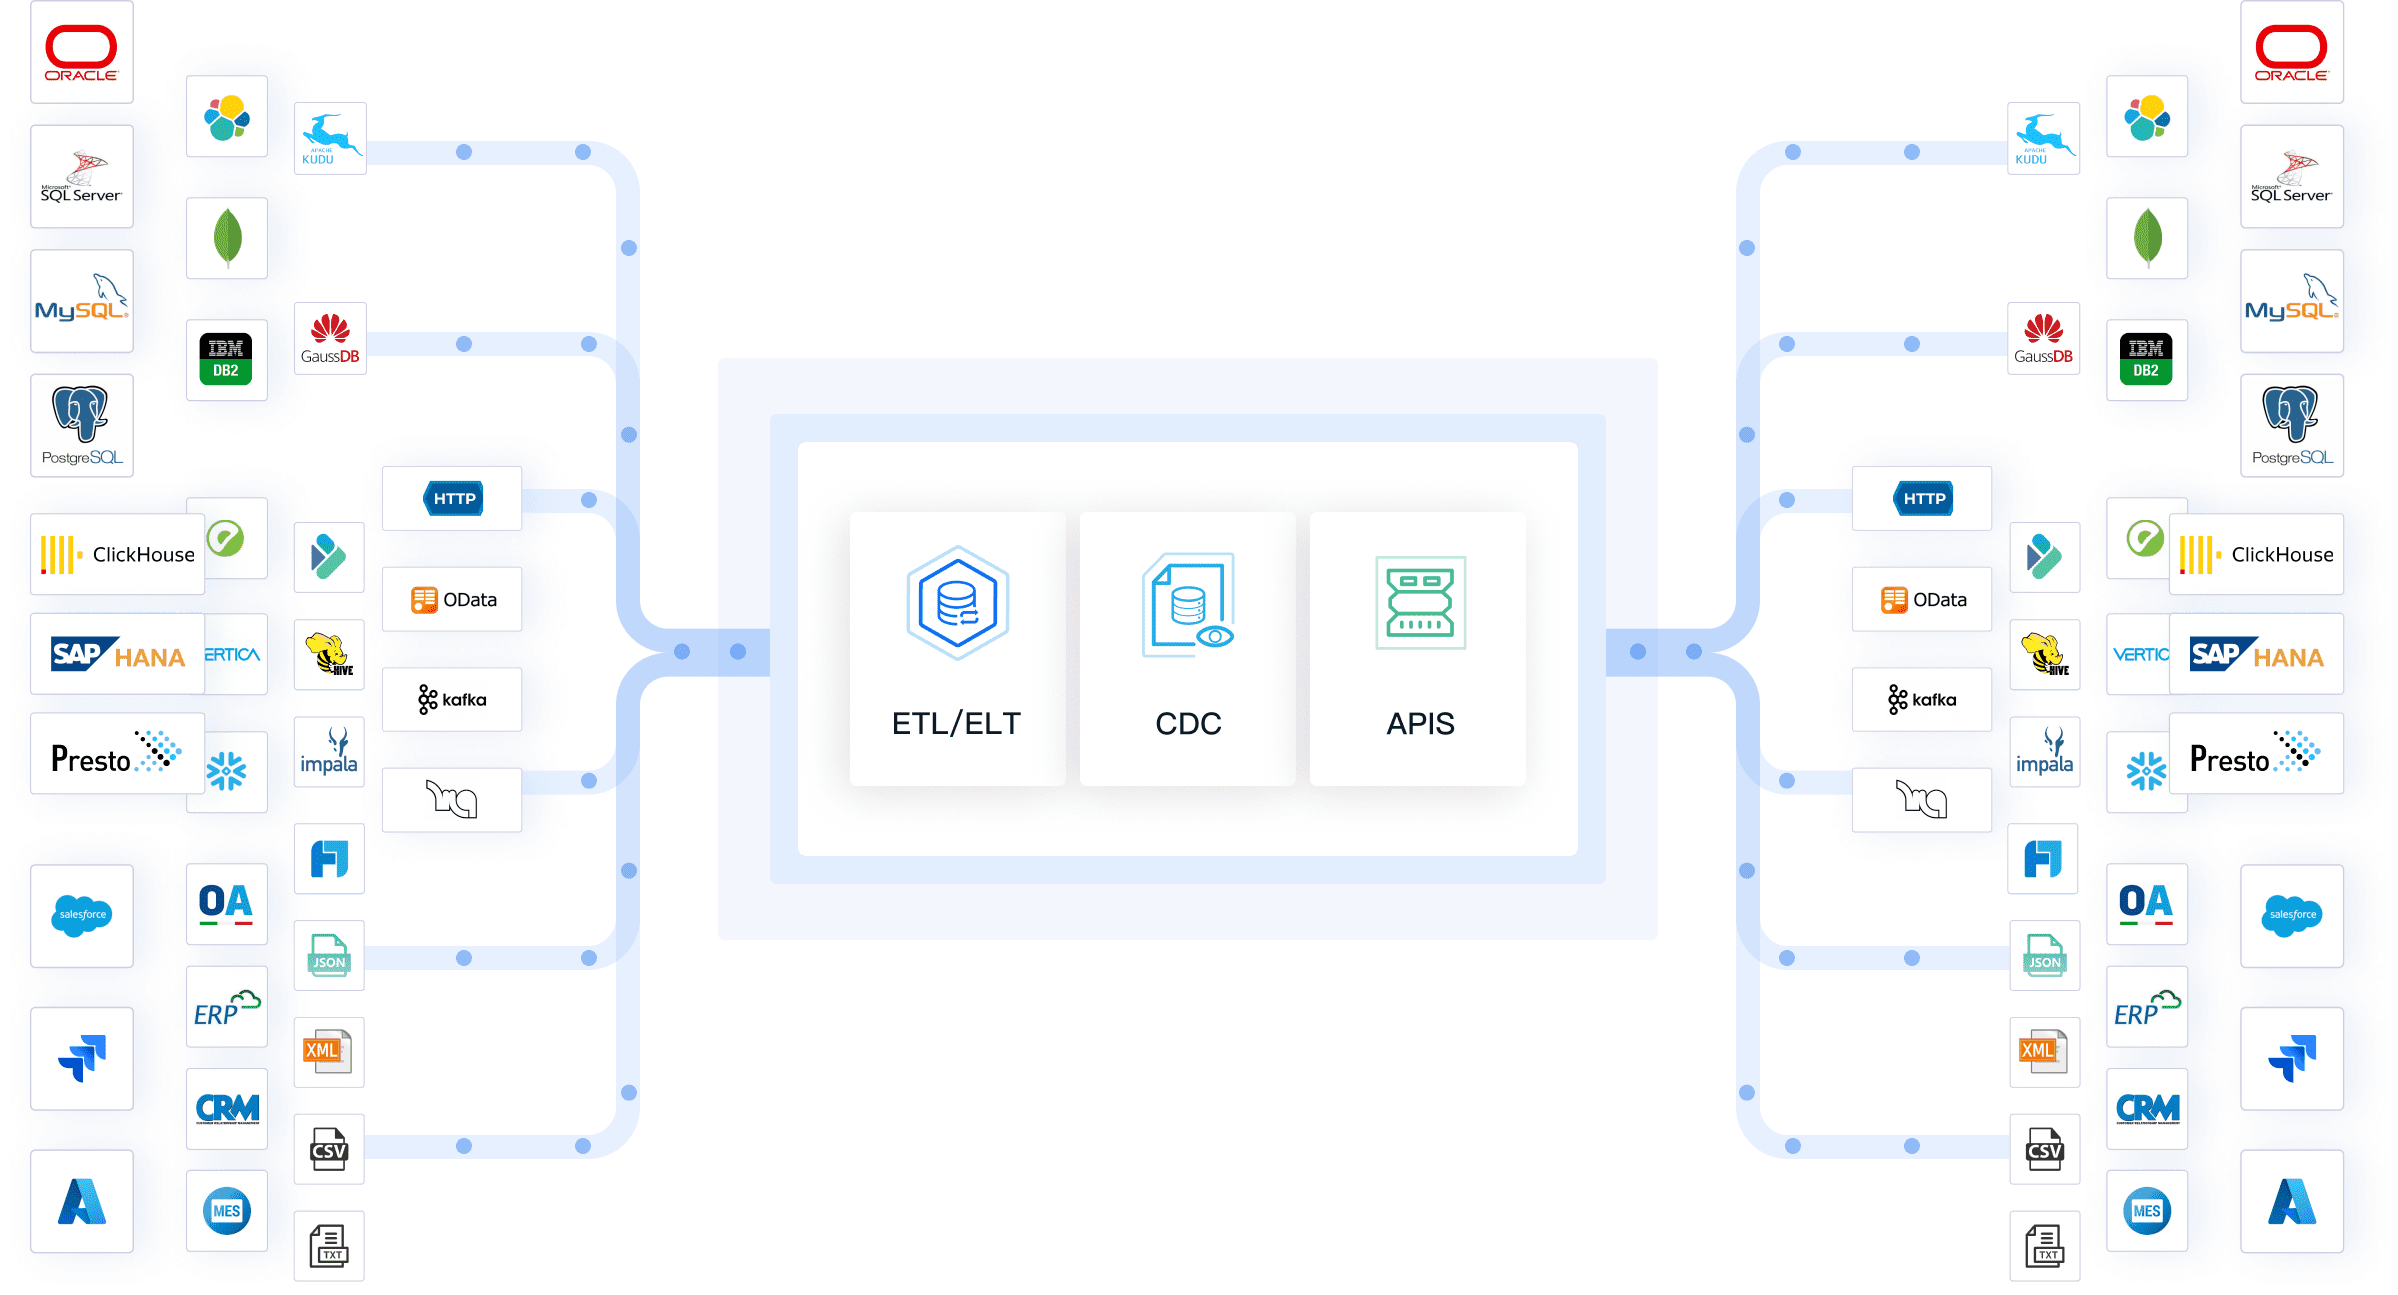
FineDataLink stands out as a recommended platform for real-time data integration, ETL/ELT, and API development. You can use FineDataLink’s drag-and-drop interface to build your architecture diagram quickly. The platform supports over 100 data sources, including databases, SaaS applications, and cloud environments. You do not need to write code to develop and launch API interfaces. FineDataLink helps you overcome common data integration challenges such as data silos, complex data formats, and scalability. You can synchronize data across multiple tables in real time, build data warehouses, and manage data governance efficiently.
Note: FineDataLink’s visual interface and detailed documentation make deployment and operation much easier than traditional tools. You can request a free trial or demo to explore its features.
You need to interpret your data architecture diagram effectively to gain insights and make informed decisions. Follow these best practices for large-scale projects:
Clarity in your architecture diagram simplifies complex systems. You can communicate your data architecture to diverse audiences, which supports better decision-making and discussions. When you interpret your diagram, pay attention to data access points, data flow, and relationships between components. This helps you identify bottlenecks, optimize data access, and plan for future growth.
You should use your data architecture diagram to monitor data access, track changes, and ensure compliance. Regular reviews and updates keep your architecture diagram relevant and useful. FineDataLink's documentation and visual tools support ongoing interpretation and maintenance, making your data architecture robust and scalable.
You need to follow best practices when designing effective data architecture diagrams. Start by focusing on clarity. Use standardized symbols and clear labels for every component. Consistency helps you avoid confusion and makes your diagrams easier to read. You should document your diagrams and keep them updated. Architecture diagrams act as living entities that reflect your current system behavior. This dynamic nature helps you understand and troubleshoot complex systems.
FineDataLink's visual interface supports you in creating diagrams with drag-and-drop tools. You can access detailed documentation and step-by-step guides, which make the process straightforward. When you design your data architecture, include metadata such as titles and version numbers. Add a legend to explain symbols and line types. Store your diagrams with other versioned assets for long-term use.
| Type of Diagram/Document | Description |
|---|---|
| Data flow diagrams | Illustrate data flows through systems and applications |
| Data models | Define the structure of data and its relationships |
| Data usage mapping | Connects data usage to organizational processes |
| Standards and policies | Guidelines for data operations |
| High-level architectural blueprints | Overview of the data architecture framework |
Tip: Regularly review and update your diagrams to ensure they match your evolving data architecture.
You must design your data architecture for scalability and flexibility. Decouple components so each part operates independently. This approach prevents system disruptions. Use asynchronous communication, such as message queues, to allow components to send and receive data without waiting. Partition and shard large datasets to distribute them across servers for faster access. Caching helps you store frequently accessed data closer to users, reducing load and improving speed.
Follow these strategies to build scalable and flexible data architecture:
FineDataLink enables you to synchronize data in real time and supports over 100 data sources. You can build both offline and real-time data warehouses with minimal effort. The platform’s documentation helps you plan for future expansion and maintain high performance.
| Industry | Impact of Data Architecture Diagrams |
|---|---|
| Retail | Visualization of consumer behavior data optimizes inventory management and enhances personalized shopping experiences. |
| Financial Services | Monitoring sensitive financial data flow ensures compliance and makes processes auditable and secure. |
You see real-world examples of data architecture diagrams in industries like retail and financial services. These diagrams help you visualize data flows, optimize operations, and ensure compliance. When you use FineDataLink, you gain tools that support business intelligence and data warehouse construction.
You rely on data architecture to organize, manage, and integrate information across your organization. Data architecture improves communication and decision-making, as shown in the table below:
| Purpose | Description |
|---|---|
| Communication | Provides a clear way to share data structure and flow with all stakeholders. |
| Supporting Business Intelligence | Streamlines analysis for better decisions. |
| Encouraging Collaboration | Creates a common reference for teams. |
You measure the value of data architecture by tracking IT cost reduction and business productivity. Common challenges include outdated diagrams and lack of business context. FineDataLink helps you overcome these issues by simplifying integration and automating tasks. Industry leaders recommend using data architecture to clarify data flows and relationships. Apply best practices and choose solutions like FineDataLink to drive operational success.

Enterprise Data Integration: A Comprehensive Guide
What is enterprise data and why does it matter for organizations
Understanding Enterprise Data Centers in 2025
Enterprise Data Analytics Explained for Modern Businesses

The Author
Howard
Data Management Engineer & Data Research Expert at FanRuan
Related Articles

11 Best Data Management Tool Options Compared in 2026: Features, Pros, Cons & Use Cases
Compare the best data management tools for 2026. Review features, pros, cons, and ideal use cases for platforms like FineBI, Microsoft Purview, and Talend.
Lewis Chou
Apr 26, 2026

7 Best Data Governance Platforms Compared: Pros, Cons, and Which Teams They Fit Best
A data governance platform is software that helps organizations define, manage, monitor, and enforce how data is cataloged, accessed, trusted, and used across the business. 7 best data governance platforms compared at a
Howard Chu
Apr 20, 2026

What is a data management platform in 2025
A data management platform in 2025 centralizes, organizes, and activates business data, enabling smarter decisions and real-time insights across industries.
Howard
Dec 22, 2025


