You can now use self service business intelligence to take control of your data. This approach lets business users access, analyze, and visualize data without waiting for IT. Organizations see real results, with 73% reporting successful adoption:
| Organization Size | Very Successful (%) | Moderately Successful (%) | Total Successful (%) |
|---|---|---|---|
| Very Large (10,000+ employees) | 88 | N/A | 88 |
| All Organizations | 32 | 41 | 73 |
With self service business intelligence, you gain faster data access. You can use analytics to support decision-making and create a culture where data drives every choice.
You may wonder what self-service BI means in the world of business intelligence. Self-service business intelligence is an approach to data analytics that empowers you and other nontechnical business users to access and explore data sets on your own. You can filter, sort, analyze, and visualize data without needing help from IT or BI teams. This approach puts the power of analytics directly in your hands, making it easier to answer questions and solve problems as they arise.
Many organizations choose self-service BI because it removes barriers to data access. You no longer need to wait for technical experts to build reports or dashboards. Instead, you can use intuitive tools to perform your own data analysis and data visualization. This shift helps you make faster, more informed decisions and encourages a culture where everyone uses data to guide their actions.
However, some common misconceptions exist about self-service BI. Many business leaders believe that simply providing a tool will guarantee success, but users often need training to use these platforms effectively. Others think self-service BI eliminates the need for IT, but IT still plays a crucial role in managing data quality and security. You should remember that a successful self-service BI project depends on good data, clear processes, and ongoing support.
When you use a self-service BI platform, you gain access to several important features that make data analytics easier and more accessible. The most commonly cited features in industry reports include:
Self-service BI platforms also focus on data security and governance. You benefit from features like access control, data quality control, and auditing. These controls ensure that only authorized users can view sensitive data, that the data remains accurate, and that all access is tracked for accountability.
| Control Type | Description |
|---|---|
| Access Control | Limits who has access to data through authorization mechanisms and authentication software. |
| Data Quality Control | Ensures data is of high quality through validation, data cleaning, and transformation processes. |
| Auditing and Logging | Tracks who accessed which data and when, helping to identify misuse or unauthorized access. |
In addition, many platforms use encryption and firewalls to protect your data from unauthorized access or tampering.
Self-service BI brings value to a wide range of users in your organization. You can see how different roles use these tools in the table below:
| User Role | Purpose of BI Tool Usage |
|---|---|
| IT Specialists | Process large data sets and generate reports |
| Data Scientists | Find insights and build predictive models |
| Executives | Get an overview of performance and operations |
| Analysts | Understand consumer behaviors and market trends |
| Sales Professionals | Gain insights into trends to build better sales strategies |
| Marketing Teams | Analyze the effectiveness of campaigns to optimize them |
You may work in sales, marketing, finance, or operations. Self-service BI helps you analyze trends, measure performance, and make data-driven decisions. Even if you do not have a technical background, you can use these tools to explore data and create your own reports.
Industries such as healthcare, retail, manufacturing, and finance have seen significant benefits from adopting self-service BI. Organizations in education and government also use these platforms to streamline operations and make faster decisions. Cloud-native deployments and mobile-friendly dashboards have made self-service analytics more accessible, even in sectors that were slow to adopt business intelligence in the past.
Note: Success with self-service BI depends on more than just the tool. You need high-quality data, clear processes, and ongoing support to get the most value from your investment.

When you compare self-service business intelligence to traditional BI, you notice clear differences in how you access and control data. Self-service BI gives you direct access to data through user-friendly interfaces. You do not need technical skills to explore or analyze information. Traditional BI tools, on the other hand, often require IT specialists to manage data requests and build reports. This process can slow you down and limit your ability to make quick decisions.
Self-service BI changes how you interact with data. You gain the flexibility to analyze information in real time and respond quickly to business needs. This approach empowers you and your colleagues to participate in decision-making at every level.
Self-service BI reduces the workload for IT departments. You no longer need to rely on IT for every data request. This shift lets IT teams focus on improving data infrastructure and governance.
By adopting self-service BI, you unlock the full value of your data. You gain control, speed, and the ability to make informed decisions without unnecessary delays.
You need to make decisions quickly in today’s business world. Self-service BI gives you the power to access and analyze data in real time. This means you do not have to wait for IT teams to deliver reports. You can explore information, spot trends, and act on business insights as soon as you see them. When you use self-service business intelligence, you help your organization respond faster to market changes and internal challenges.
Self-service BI supports a data-driven culture. You and your colleagues can use data to guide every choice. This approach leads to better decision-making and stronger business outcomes. The table below shows how self-service BI improves the way you work:
| Key Findings | Description |
|---|---|
| Democratization of Data | You and other business users can access and use data directly, speeding up business insights. |
| Enhanced Decision-Making | Direct data access lets you explore information deeply, leading to smarter choices. |
| Data-Driven Culture | Decentralized data access helps everyone make informed decisions quickly. |
You reduce your reliance on IT and gain the ability to answer questions on your own. This independence leads to faster insights and more effective strategies. Research shows that when you can manipulate data yourself, you improve efficiency and get answers more quickly.
Self-service BI tools are designed for everyone, not just data experts. You do not need to know how to code or use complex software. With intuitive interfaces and drag-and-drop features, you can create reports and dashboards on your own. This means you can turn raw data into clear data visualization without extra help.
You can:
These features help you and your team make data-driven decisions. You do not have to wait for IT or data analysts to provide answers. Instead, you can explore data, test ideas, and share findings with others. This approach makes data analytics accessible to everyone in your organization.
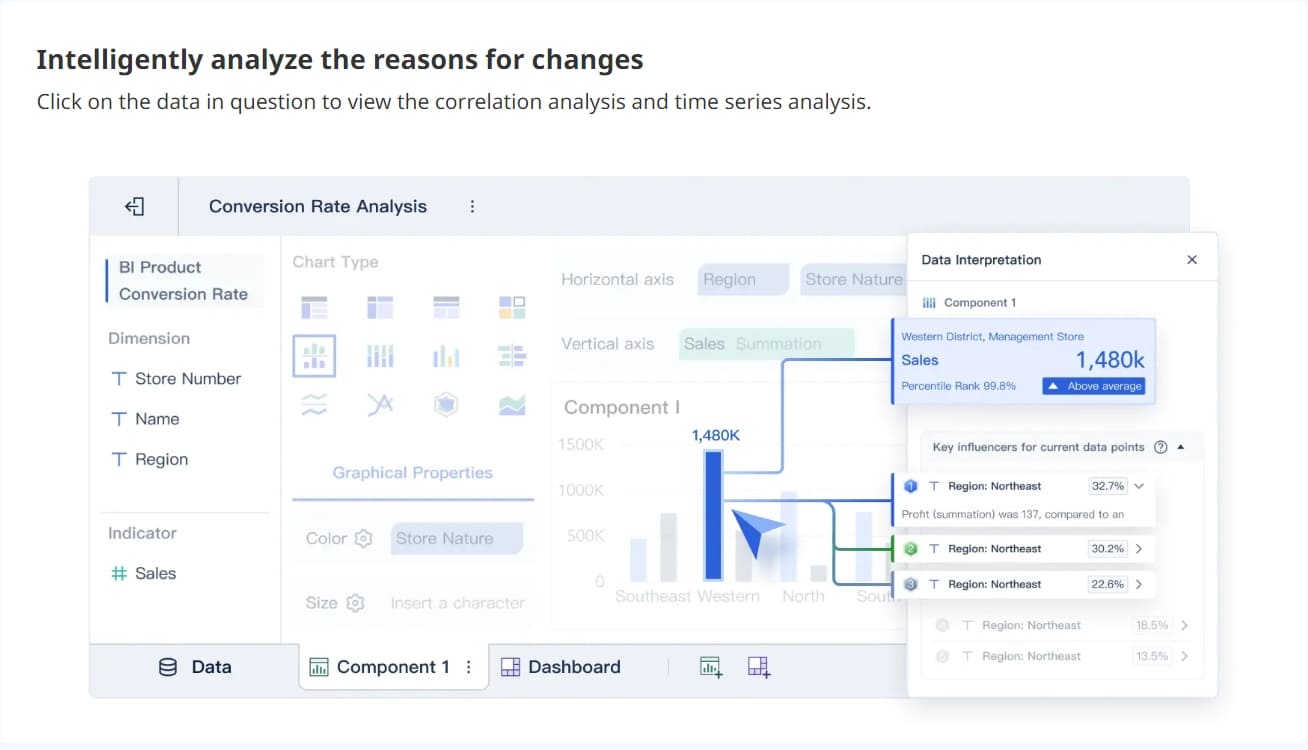
FineBI is a great example of a self-service BI platform that empowers non-technical users. You can connect to many data sources, prepare your data, and build dashboards with simple drag-and-drop actions. FineBI’s user-friendly design helps you focus on business intelligence, not technical details.
Self-service BI helps you save money and use resources more wisely. When you use these tools, you reduce your dependence on IT teams for routine reporting. This leads to lower labor costs and frees up IT staff for more important projects. You also gain quick access to data, which helps you make decisions faster and avoid costly delays.
You can:
Self-service business intelligence lets you optimize your operations. You can spot inefficiencies, adjust your strategy, and make better use of your team’s time. FineBI supports this by offering real-time analytics, high-performance data engines, and flexible data integration. You can handle large data sets, share dashboards securely, and ensure that everyone has the right level of access.
Note: Self-service BI not only improves efficiency but also helps you build a culture where everyone values data and uses it to drive business success.
When you adopt self-service BI, you transform how your organization uses data. You move from waiting for reports to exploring information on your own. This shift speeds up insight generation and helps you adapt quickly to market changes. You become an active participant in data analytics, which leads to more relevant and actionable results.
| Advantage | Description |
|---|---|
| Accelerated time-to-market | You deliver analytics products faster, reducing delays. |
| User empowerment | You engage with data directly, not just as a consumer but as a creator of insights. |
| Enhanced data culture and skills | You help build a culture where everyone values data literacy and exploration. |
| Efficiency and agility | You respond to business needs with greater speed and flexibility. |
| Resource optimization | You free up IT resources, letting business users handle their own reporting. |
| Data democratization | You expand access to data, allowing more voices in decision-making. |
| Improved decision-making | You make better choices by using timely and relevant insights. |
Self-service BI reduces the time it takes to get answers from weeks to hours or minutes. You can perform ad hoc analysis, answer your own questions, and encourage a culture of curiosity. This approach also helps your organization optimize resources and improve overall decision-making.
You may face several challenges when implementing self-service BI. Many organizations struggle with aligning on a company-wide data strategy. Sometimes, resistance from data owners slows progress. Implementation can be difficult, especially when integrating multiple data sources or lacking committed leadership. Poor data quality can lead to costly mistakes, and sluggish database performance can affect the reliability of your reports.
| Barrier | Description |
|---|---|
| User reluctance | Some business users resist new technology or find tools complex. |
| Neglected data governance | Poor data quality and accessibility can limit effectiveness. |
| Hidden overhead | Unforeseen costs may arise during implementation. |
| Need for proper training | Without training, users may not use new tools effectively. |
| Lack of data culture | Organizations that do not support data-driven decisions may struggle with adoption. |
You need to address these issues early to ensure your self-service BI project succeeds.
You can overcome these challenges by treating self-service BI as an organizational change, not just a technology upgrade. Strong leadership and ongoing investment in both technology and people are essential. Secure data governance ensures compliance and protects sensitive information. Align your BI initiatives with business goals and monitor key performance indicators.
| Best Practice | Description |
|---|---|
| Secure Data Governance | Use robust procedures to keep data secure and comply with regulations. |
| Align BI with Business Goals | Make sure your BI projects support your organization’s objectives. |
| Improve Interdepartmental Cooperation | Encourage departments to work together and share insights. |
You should also invest in continuous training. Regular sessions help business users become comfortable with new tools and reinforce a data-driven mindset. Providing reminders and refresher courses ensures that everyone stays up to date. When you combine the right self-service BI tools with strong training and governance, you maximize the value of your data analytics.
FineBI supports these best practices by offering user-friendly interfaces, secure data management, and flexible training resources. You can empower your team to explore data independently while maintaining control and compliance.
When you select self-service tools, you need to focus on features that support your business intelligence goals. Analysts recommend a clear process:
You should also check integration capabilities. Look for a library of integrations that connects to your CRM, databases, and other systems. Direct connections help you avoid extra IT work. A semantic modeling layer ensures you define metrics once and use them across departments. A user-friendly interface makes it easy for everyone to explore data.
Many self-service tools exist, but not all offer the same value. FineBI stands out because it combines a user-friendly interface with strong data integration. You can connect to over 60 data sources, including cloud and on-premises databases. FineBI lets you prepare, analyze, and visualize data without coding. You can build dashboards with drag-and-drop actions and share insights securely.
Other leading tools may focus on visualization or require more IT support. FineBI supports real-time analytics, high performance, and enterprise-level governance. You can scale from small teams to thousands of users. This flexibility makes FineBI a strong choice for organizations that want to empower business users and analysts.
A structured approach helps you succeed with self-service BI. The table below outlines key steps:
| Step | Description |
|---|---|
| 1 | Define your BI strategy. Align with business goals and set KPIs. |
| 2 | Build your BI team. Include a project manager, data engineers, and business analysts. |
| 3 | Assess data readiness. Audit your data for quality and governance. |
| 4 | Select the right BI tools. Focus on scalability, ease of use, and integration. |
| 5 | Ensure user adoption. Provide training and support for all users. |
You should avoid common pitfalls like poor data quality, lack of governance, and choosing tools that do not fit your needs. Training and support encourage adoption and help you build a data-driven culture.
You see rapid changes in self-service business intelligence as organizations seek more value from their data. Recent market research highlights several important trends shaping the future of analytics. The table below summarizes these trends and their impact on how you use data:
| Trend/Driver | Description |
|---|---|
| Data Democratization | You gain direct access to analytics tools, making data-driven decisions easier. |
| Advanced Analytics Capabilities | Predictive analytics and machine learning help you uncover deeper insights from your data. |
| Cloud Adoption | Cloud solutions give you scalability and flexibility for your data projects. |
| Increased Focus on Data-Driven Culture | Real-time data access and analysis become standard at all levels. |
| Augmented Analytics | AI automates data analysis, so you get insights without technical skills. |
| Natural Language Processing (NLP) | You interact with data using everyday language for quick answers. |
| Data Storytelling | You turn complex data into clear stories for better communication. |
| Self-Service Analytics | You create reports and dashboards without IT support. |
| Cloud-Based BI Solutions | Cloud-hosted data and tools offer more flexibility and scalability. |
| Predictive Analytics | You use historical data to forecast trends and outcomes. |
You notice that artificial intelligence and machine learning now play a larger role in self-service BI. Features like natural language processing let you ask questions in plain language. Automated insights help you spot patterns in your data quickly. Conversational interfaces make it easier for you to interact with data and make decisions.
You experience a shift in how organizations use data for decision-making. Self-service BI tools let you access and analyze data independently, which leads to faster insights. You no longer depend on IT for every report. This change makes your organization more agile and responsive.
The integration of AI and machine learning in self-service BI platforms gives you advanced analytical capabilities. You can uncover deeper insights from your data without needing technical expertise. This democratization of data encourages collaboration across departments and builds a more data-savvy workforce.
FineBI supports these trends by offering AI-driven analytics, natural language processing, and real-time data access. You can connect to multiple data sources, explore data visually, and share insights with your team. FineBI helps you stay ahead as the role of data continues to evolve in business.
Self service business intelligence changes how you use data in your organization. You gain the ability to access and analyze data independently, which leads to faster decision-making and improved collaboration. These tools help you work with data from different sources, giving you a complete view for better resource allocation. As you use real-time analytics and AI-powered features, you discover new insights and respond quickly to market changes. FineBI supports your journey by making data accessible and helping you build a culture focused on data-driven decision-making.
MicroStrategy Business Intelligence Essentials for Today’s Enterprises
Top Emerging Business Intelligence Trends Shaping 2025
What Does a Business Intelligence Engineer Do in 2025
Top Business Intelligence Services Providers to Watch in 2025
What Are the Top Predictive Analytics Tools for 2025?
What Are the Top Digital Marketing Analytics Tools for 2025?


The Author
Lewis
Senior Data Analyst at FanRuan
Related Articles

How to Build a UAT Dashboard for BI Projects: KPIs, Workflow, and Sign-Off Criteria
Learn how to build a UAT dashboard for BI projects. Track KPIs, manage workflow, and define sign-off criteria to ensure successful releases.
Lewis Chou
May 05, 2026
How to Build a UAT Dashboard for BI Projects: KPIs, Workflow, and Sign-Off Criteria
A uat dashboard gives BI teams one place to control testing progress, $1, defect risk, and stakeholder sign off before release. For IT managers, BI product owners, analytics leads, and operations directors, this is not a
Eric
Jan 01, 1970

Customer Insights Dashboard: What Enterprise Teams Should Track and Why It Matters
Learn what enterprise teams should track in a customer insights dashboard to centralize data, improve decisions, and drive revenue and retention.
Lewis Chou
May 01, 2026


