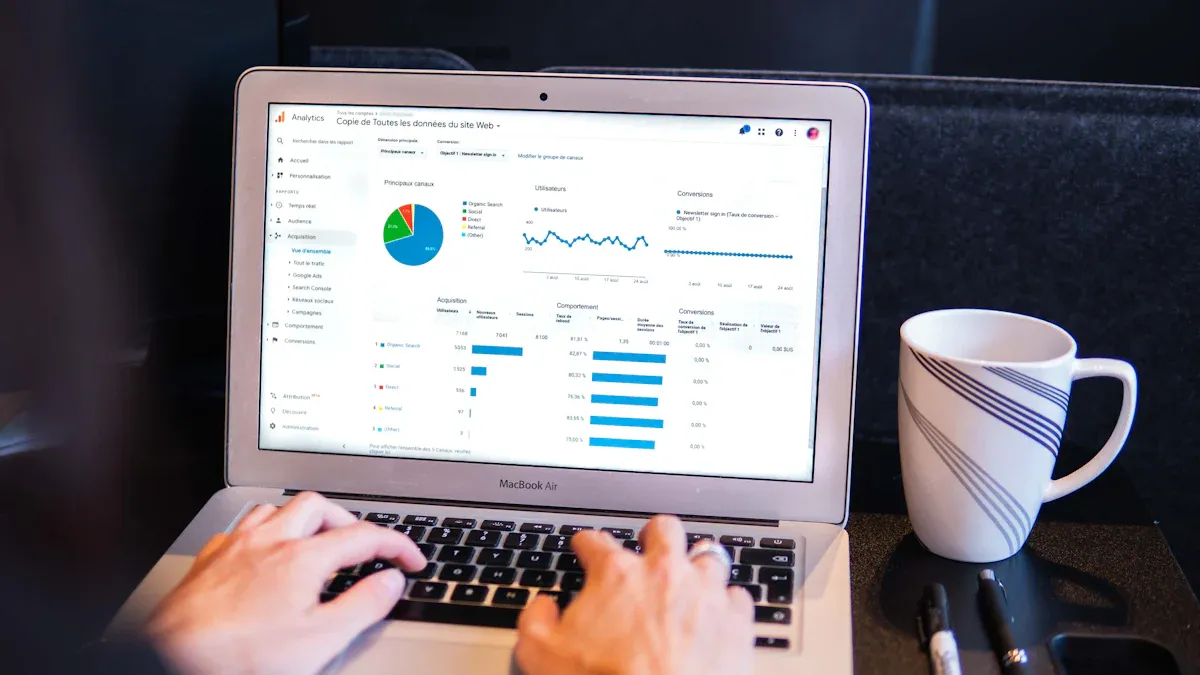
A business intelligence dashboard gives you a clear view of your most important business metrics in one place. You can track performance, spot trends, and respond quickly to changes. Over 46% of businesses now treat BI as a core strategy, and the adoption rate of BI dashboards continues to grow. With tools like FineBI, you gain real-time insights into your data, automate analysis tasks, and empower your team to make smarter decisions. AI-powered dashboards help you uncover deeper insights, strengthen decision-making, and maintain focus on key goals.
What is a Business Intelligence Dashboard
BI Dashboard Definition
A business intelligence dashboard is a tool that helps you see your most important business information at a glance. You can use it to track key performance indicators, spot trends, and make better decisions. Industry experts define a business intelligence dashboard as a data visualization and analysis tool that presents KPIs and other essential business metrics on a single screen. This tool serves people at all levels of your organization. You get insights for both daily operations and long-term planning.
You do not need to be a data expert to use a BI dashboard. The design focuses on making data easy to understand and act on. You can view charts, graphs, and tables that show how your business is performing. This helps you respond quickly to changes and find new opportunities. With a BI dashboard, you can turn raw data into real-time insights that drive your business forward.
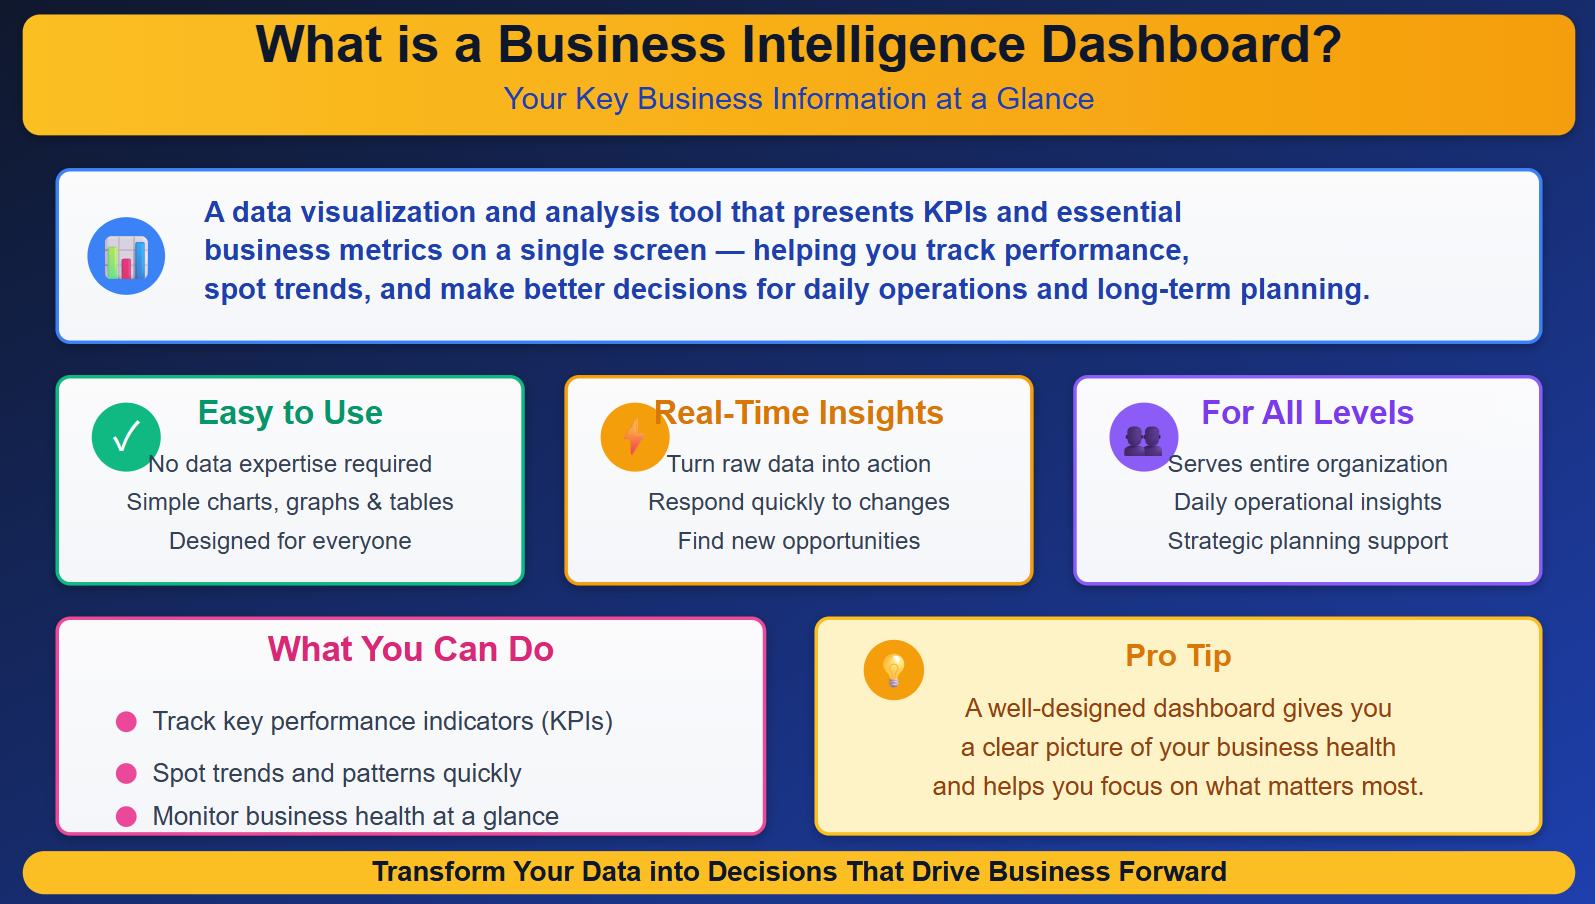
Tip: A well-designed dashboard gives you a clear picture of your business health and helps you focus on what matters most.
Here is a table that shows the core functions of BI dashboards:
| Core Function | Description |
|---|---|
| KPIs and charts | Provide a high-level view of key metrics like revenue and conversion rates. |
| Filters and drill-downs | Allow users to slice data for specific insights and explore metrics in detail without technical skills. |
| Text boxes or note tiles | Offer context and commentary on metrics, enhancing understanding and guiding decision-making. |
| Interactive elements | Enable exploration of data through features like clickable data points and adjustable date ranges. |
| Centralized insights | Integrate data from multiple sources into a unified view for comprehensive analysis. |
| Timely insights | Keep users updated with the latest data for informed decision-making. |
| Improved decision-making | Help teams make data-driven decisions by clearly displaying key metrics. |
| Enhanced collaboration | Facilitate sharing of insights among team members for unified understanding. |
| User engagement | Designed to be intuitive and accessible for all users, not just data experts. |
How BI Dashboards Work
You might wonder how BI dashboards turn raw data into useful information. The process starts with connecting to different data sources. These sources can include databases, spreadsheets, cloud services, or even APIs. The BI dashboard pulls data from these places and brings it together in one view. This makes it easy for you to compare numbers and spot patterns.
Once the data is collected, the dashboard uses analytics tools to process and visualize the information. You can see charts, graphs, and tables that update in real time. For example, tools like Klipfolio focus on live data display, making it simple to track changes as they happen. FineBI lets you explore data and create interactive dashboards without needing advanced technical skills. You can filter results, drill down into details, and adjust what you see with just a few clicks.

- Klipfolio is known for its easy dashboard creation.
- FineBI helps you visualize results and explore data, even if you do not have a technical background.
A BI dashboard also supports collaboration. You can share dashboards with your team, add comments, and work together to make better business decisions. The dashboard keeps everyone on the same page by showing the latest data insights. This helps your team act quickly and stay ahead of the competition.
With BI dashboards, you gain the power to make data-driven decisions. You can monitor business performance, find trends, and react to new opportunities. The dashboard becomes your central hub for business intelligence, helping you turn data into action.

Why Your Business Needs a BI Dashboard
Key Benefits for Decision-Making
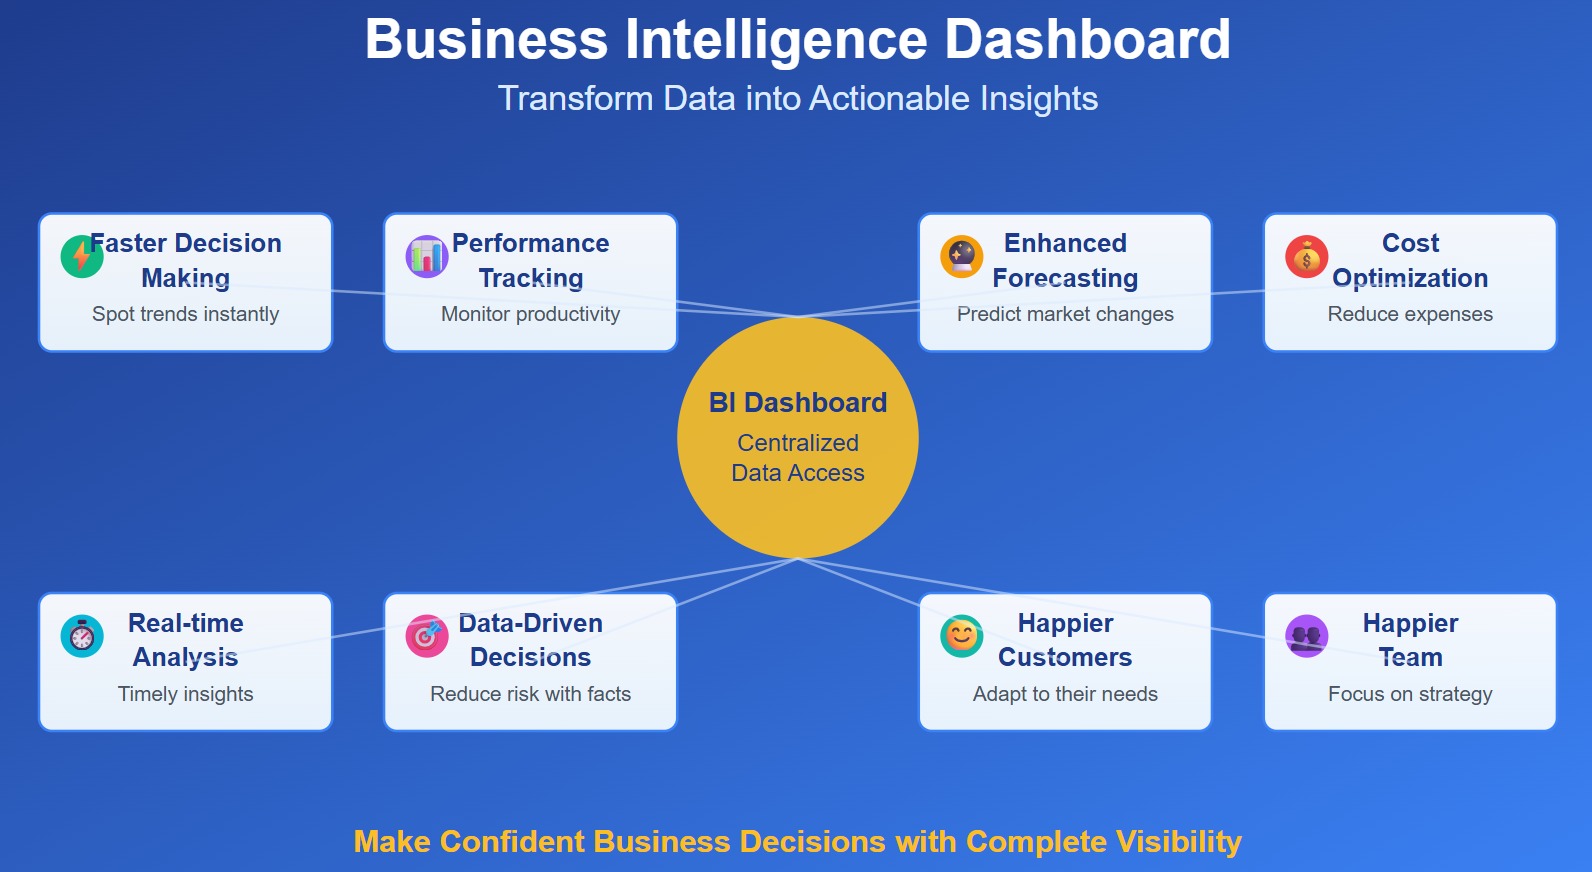
A business intelligence dashboard gives you a powerful way to see your business in action. You can bring together data from many sources and turn it into actionable insights. This helps you make impactful business decisions quickly and with confidence. When you use a bi dashboard, you gain several important advantages:
- Centralized data access lets you see all your information in one place. You do not need to switch between systems.
- Faster decision-making becomes possible because you can view interactive visuals and spot trends right away.
- Improved performance tracking helps you monitor productivity and link employee actions to business outcomes.
- Enhanced forecasting and planning allow you to use analytics to predict market changes and manage resources.
- Cost and resource optimization helps you find inefficiencies and reduce expenses.
- Real-time analysis of business health gives you timely insights into how your company responds to the market.
- You discover valuable insights by viewing your operations as a whole, which reveals areas that need support.
- Data-driven decision making reduces risk because you rely on facts, not guesses.
- Happier customers result from adapting to their needs using data insights.
- Happier team members can focus on strategic work instead of manual data tasks.
Note: The benefits of bi dashboards go beyond just numbers. They help you create a culture where everyone can use data to find new opportunities and solve problems.
You can see these benefits in the table below:
| Benefit | Explanation |
|---|---|
| Centralized Data Access | Consolidates all project-related data into one platform, providing actionable insights and saving time. |
| Predictive Analytics | Uses AI to predict outcomes, allowing proactive adjustments to prevent issues. |
| Enhanced Team Collaboration | Provides a unified data source accessible to all, improving alignment and reducing miscommunication. |
| Real-Time Decision Making | Offers continuous updates for quick, informed decision-making, keeping projects on track. |
| Improved Communication | Presents data clearly, ensuring teams stay connected and focused on goals. |
| Increased Efficiency | Automates data collection, freeing teams to focus on critical tasks and accelerating timelines. |
| Risk Mitigation | Identifies potential risks early, allowing for proactive adjustments to keep projects within scope. |
| Strategic Alignment | Tracks KPIs to ensure projects support organizational goals, enabling necessary adjustments. |
| Accurate Data Analysis | Maintains data quality for reliable decision-making that drives project success. |
When you use bi dashboards, you can respond to changes faster than your competitors. You can track key metrics, spot problems early, and make adjustments before they become bigger issues. This gives your business a real edge in the market.
FineBI Value for Businesses
FineBI help you overcome common business challenges with advanced bi dashboards. Many companies struggle with data silos, outdated systems, and slow reporting. FineBI solves these problems by giving you a self-service platform for data analysis and real-time insights.
| Challenge | Solution Provided by BI Tools |
|---|---|
| Self-service analytics | FineBI allows users to independently explore data and create real-time dashboards. |
| Structured reporting for compliance | FineReport offers pixel-perfect reporting capabilities for compliance and financial analysis. |
| Operational efficiency | Both FineBI and FineReport provide tools that enhance operational efficiency through data insights. |
| Adaptability to changing conditions | FineBI supports seamless integration with various data sources, ensuring flexibility as business needs evolve. |
You can use FineBI to connect to multiple data sources, prepare your data, and build dashboards without needing IT support. The drag-and-drop interface makes it easy for anyone to create reports and explore analytics. This self-service approach empowers your team to make data-driven decisions and unlock new opportunities.

FanRuan has helped thousands of businesses succeed. For example, UnionPay Data Services used FineBI to unify its data and improve system efficiency by 5%. The company increased customer value identification accuracy to 90%. Employees could analyze credit card revenue, identify key areas for improvement, and boost engagement. TXC Corporation also transformed its operations with FineBI. Employees gained access to real-time dashboards, improved reporting, and became more skilled in data analysis. These stories show how a successful bi dashboard can drive business growth and efficiency.

FanRuan serves over 46,000 enterprises, including many top global companies. FineBI’s self-service features let you analyze data independently, prepare flexible reports, and integrate information from different sources. You can track KPIs, monitor trends, and make timely decisions that support your business goals.
When you choose a business intelligence dashboard like FineBI, you give your team the tools to turn data into actionable insights. You can improve operational efficiency, gain real-time insights, and make impactful business decisions. The benefits of bi dashboards help you stay ahead in a fast-changing world and ensure your business thrives.

BI Dashboard Features and Components
Data Integration and Visualization
When you use a business intelligence dashboard, you bring together information from many sources. You might connect to CRM systems, Google Analytics, financial reports, or cloud platforms. This integration is one of the key features of bi dashboards. You can combine data from different places and see it all in one view. FineBI stands out as a data analytics tool because it lets you connect to many databases and files without needing IT support. You get a drag-and-drop interface, so you can create your own reports and dashboards easily.

A good data visualization tool helps you turn numbers into clear charts and graphs. FineBI gives you many options for visualizing your data. You can build interactive dashboards that let you explore trends and patterns. This makes designing effective bi dashboards much easier. You can customize your view and focus on the data insights that matter most to your business.
Tip: Interactive visualizations help you understand your data faster and make better decisions.
Real-Time Analytics with FineBI
Real-time analytics are essential for staying ahead in business. FineBI supports real-time data updates, so you always see the latest information. You can spot problems early and react quickly. This agility helps you keep your business competitive. FineBI works with many types of databases and supports high-speed storage, so your dashboards load fast even with lots of users.

| Component | Recommendation |
|---|---|
| Software Environment | Linux preferred; Tomcat recommended; supports Windows, Mac, Unix, and more. |
| Database | Works with MySQL, Oracle, MongoDB, and others. |
| Disk Requirements | SSD recommended; at least 100 MB/s read/write speed. |
With real-time analytics, you can adapt your strategy as soon as market conditions change. You also improve customer service by solving issues right away.
Security and Collaboration
Security is a top priority for any data analytics tool. FineBI gives you control over who can see or edit each part of your dashboard. You can set permissions down to the row and column level. Each user sees only the data they are allowed to access. This keeps your business information safe.

Collaboration is another important feature. You can share dashboards online, publish them to a directory, or give public links to external users. Teams can work together on the same analysis, making it easy to build a data-driven culture. When you use FineBI, you empower everyone to contribute to business success.
BI Dashboards vs. Reports
Key Differences
You may wonder how a bi dashboard differs from a traditional report. Both tools help you understand your data, but they serve different purposes. A bi dashboard gives you real-time insights and lets you interact with your data. You can filter, drill down, and see live updates. Traditional reports, on the other hand, focus on static, scheduled data. They often present information in tables or narratives and are best for reviewing historical trends.
Here is a table that highlights the main differences:
| Feature | Dashboards | Traditional Reports |
|---|---|---|
| Data Refresh | Real-time or near real-time | Static / Scheduled |
| Format | Visual, Interactive | Tabular, Narrative |
| Use Case | Monitoring, Alerts | Documentation, Auditing |
| Accessibility | Web-based, Cloud-enabled | PDF, Excel, Printed |
| User Interaction | High | Low |
Dashboards let you customize your view and respond quickly to changes. Reports provide detailed analysis and are useful for compliance or auditing. You can think of dashboards as your control center for daily operations, while reports act as your official record for business reporting.
Tip: Use dashboards when you need to monitor key metrics and spot trends as they happen. Use reports when you need a detailed, historical record.
When to Use Each
Choosing between a bi dashboard and a report depends on your goals. If you want to track performance in real time or work in a fast-changing environment, dashboards are the best choice. They help you monitor key performance indicators and react quickly to new data. For example, marketing and finance teams often use dashboards to keep up with rapid changes.
Here is a quick guide:
| Scenario | Reason for Dashboard Use |
|---|---|
| Real-time data monitoring | Dashboards provide immediate insights for timely decision-making. |
| Dynamic environments | Useful in fields where trends change rapidly, like marketing. |
| Performance tracking | Dashboards allow continuous monitoring of KPIs. |
You should use reports when you need a detailed analysis or must meet compliance requirements. Reports are ideal for documenting results and sharing official records. They work well when you want to review past performance or provide a summary for audits.
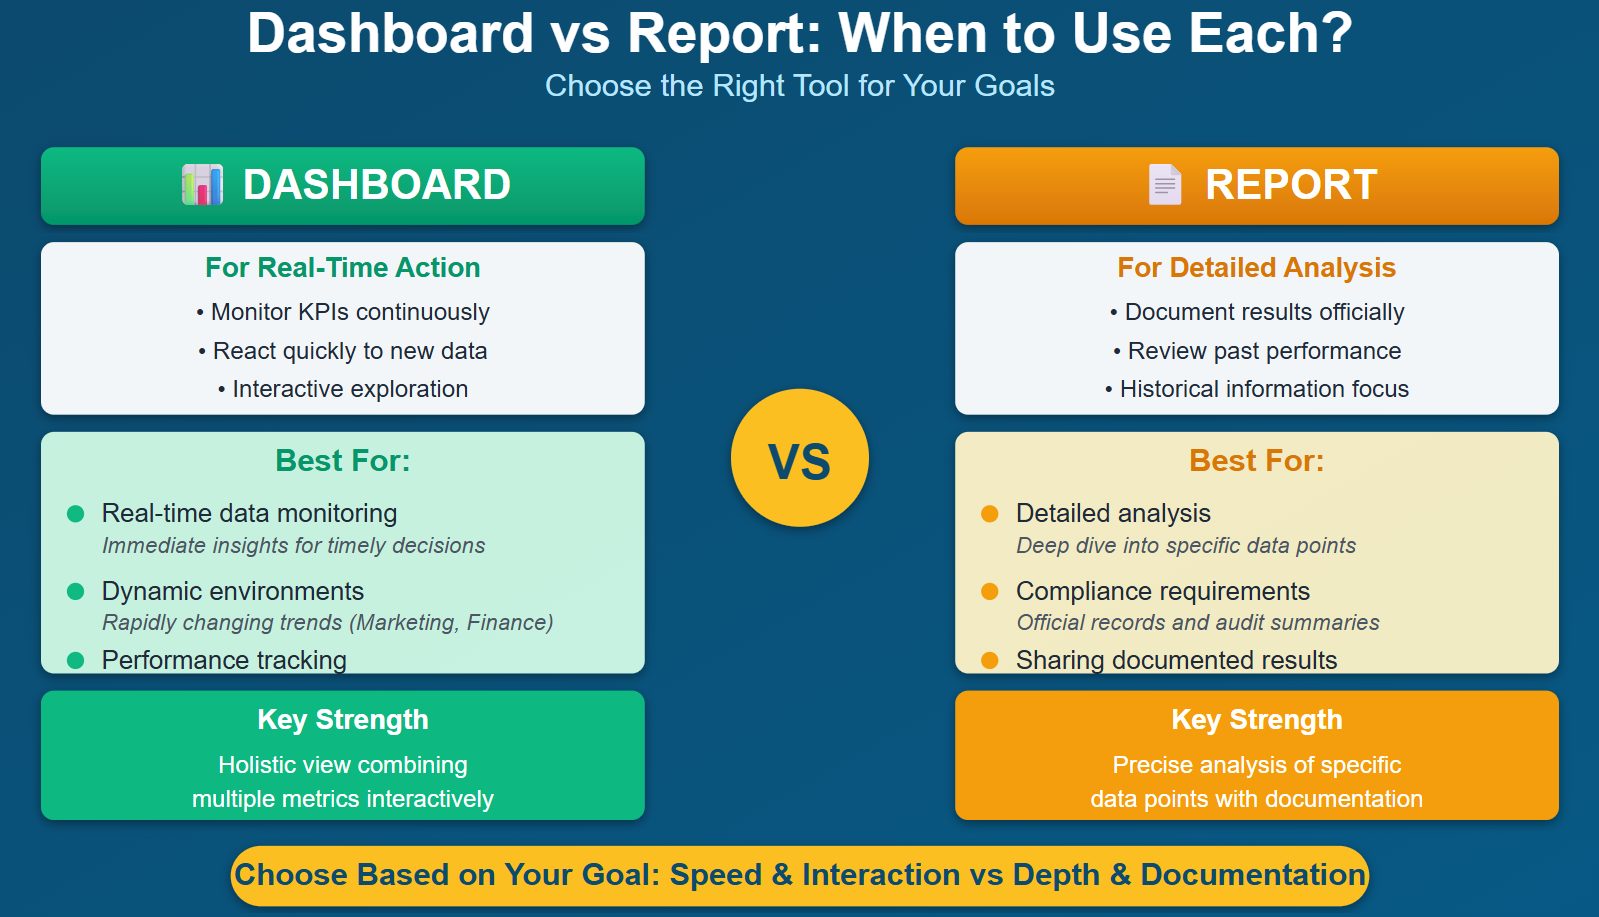
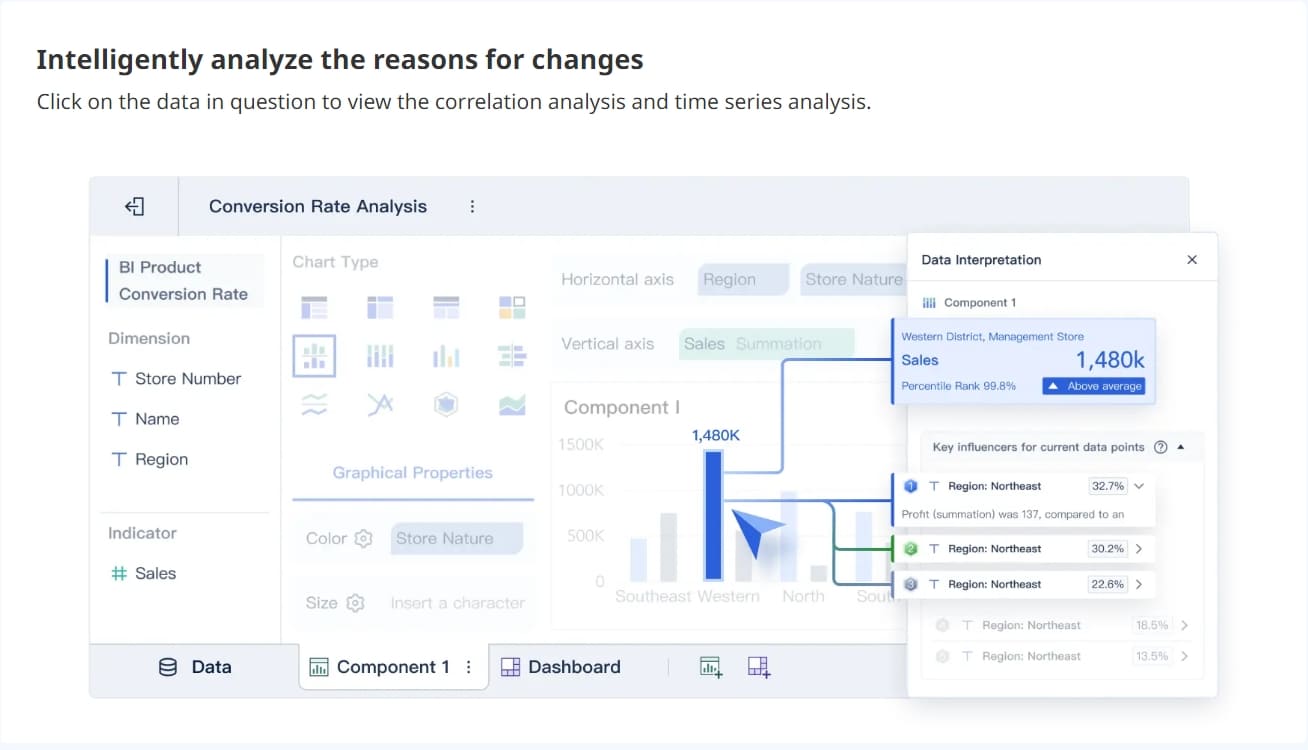
Dashboards give you a holistic view by combining multiple metrics. Reports excel at providing precise analysis of specific data points. When you need to dig deeper into the reasons behind trends, dashboards offer interactive features that help you explore the data. Reports, however, may lack this flexibility and rely more on historical information.
Note: Consider user-friendliness, integration, and real-time access when choosing between dashboards and reports. The right tool helps you make better decisions and keeps your business moving forward.
Successful BI Dashboard Use Cases

Industry Examples with FanRuan
You can see how bi dashboards help different industries solve real problems. Many companies use dashboards to analyze sales, understand customers, and improve supply chains. You can track financial performance and boost operational efficiency. The table below shows common ways businesses use bi dashboards:
| Use Case | Description |
|---|---|
| Sales Analysis | You can analyze sales data, spot trends, and measure revenue. |
| Customer Analytics and Segmentation | You can target customers by grouping them based on behavior and demographics. |
| Supply Chain Optimization | You can make sure deliveries arrive on time and routes are efficient. |
| Financial Performance Analysis | You can combine financial data for real-time insights into your company’s health. |
| Operational Efficiency | You can improve processes and see where your team can work better. |
FanRuan dashboards help you shift from guessing to making decisions based on data. You can improve inventory allocation and manage risks. You also make your supply chain work better. In retail, you can learn about consumer behavior and adjust marketing or inventory to match what customers want.
Tip: When you use self-service bi dashboards, you can explore data on your own and find answers quickly.
Customer Success Stories
Many organizations have seen big changes after using FanRuan bi dashboards. UnionPay Data Services unified its data and improved system efficiency by 5%. The company increased customer value identification accuracy to 90%. Employees used dashboards to analyze credit card revenue and find new ways to engage customers.
TXC Corporation also transformed its business with FanRuan. Employees gained access to real-time dashboards and improved reporting. They became more skilled at analyzing data and making decisions. TXC’s teams now use dashboards for thematic analysis and AI-driven insights. This shift helps everyone become a data expert.
You can see future trends in bi dashboard adoption. Natural language processing lets you ask questions in plain English and get answers. Real-time data processing helps you catch problems before they grow. Predictive analytics moves you from reacting to planning ahead.
Note: The global market for embedded analytics and predictive analytics is growing fast. More companies will use bi dashboards to make smarter decisions and stay ahead.
You need a bi dashboard to turn data into clear insights. With bi, you see your data in real time and make better choices. FanRuan and FineBI help you connect data from many sources and automate your bi tasks. You save time and focus on what matters. Before you start, look at these key takeaways:
| Key Takeaway | Description |
|---|---|
| Prioritize Strategy Before Tools | Align your bi goals with your data and outcomes. |
| Embrace Automation | Use bi to automate reporting and build momentum. |
| Invest in Advanced Analytics | Go beyond basic data and use bi for deeper insights and planning. |
A bi dashboard gives your business a strong advantage. You can lead with data and stay ahead in your industry.
Continue Reading About bi dashboard
Discover Top Open Source BI Tools in 2025
Business Intelligence vs Business Analytics for Modern Enterprises
Open Source Business Intelligence Tools You Should Know


FAQ

The Author
Lewis
Senior Data Analyst at FanRuan
Related Articles

ERP Reporting Explained: What It Is, How It Works, and Why Enterprise Teams Rely on It
ERP reporting is the process of turning data inside your enterprise resource planning system into usable business insight. For finance leaders, operations directors, supply chain managers, and IT teams, that matters beca
Yida Yin
Jun 25, 2026
8 Best Restaurant Reporting Software Tools for 2026: Compare FineReport, Toast, SpotOn & More
$1 is a highly customizable business intelligence and reporting platform that helps restaurants turn POS, labor, inventory, finance, and multi location data into real time dashboards and decision ready reports. 8 Best Re
Yida Yin
Jun 24, 2026

Database Reporting Architecture: When to Use a Reporting Database vs Your Operational System
$1 is not just about pulling data into a dashboard. It is an architecture decision that affects application performance, reporting speed, data trust, and how confidently your teams can make decisions. If you are an IT ma
Yida Yin
Jun 24, 2026