Enterprise marketing teams do not need more data—they need reporting that supports better decisions. If you are a CMO, marketing operations leader, demand generation manager, or revenue operations stakeholder, the real challenge is not collecting metrics. It is turning fragmented channel, campaign, CRM, and attribution data into reports that clearly show what is working, what is underperforming, and what to do next. The best examples of marketing report are built to answer specific business questions, reduce reporting ambiguity, and help teams allocate budget, headcount, and strategy with confidence.
Click To Try The Dashboard
All reports in this article are built with FineReport
Examples of Marketing Report: What Enterprise Teams Need to Compare
A useful enterprise marketing report does more than summarize activity. It connects marketing performance to business outcomes such as pipeline growth, revenue contribution, customer retention, and cost efficiency. That means every report should be designed around a decision: whether to scale a campaign, defend a budget, reallocate spend, improve funnel conversion, or refine audience targeting.
In enterprise environments, reporting must also handle complexity. Different regions, product lines, business units, sales motions, and attribution models can all distort the story if the report is not structured correctly. A good report filters noise, standardizes definitions, and surfaces the few indicators that matter most to decision-makers.
Reporting vs. Dashboards vs. Analysis Documents
These three formats often get mixed together, but they serve different purposes.
Reporting: A structured summary of performance over a defined period, usually tied to KPIs, targets, and actions.
Dashboards: Real-time or near-real-time monitoring views designed for quick visibility into operational metrics.
Analysis documents: Deeper interpretive reviews that explain why performance changed and what strategic response is needed.
For enterprise teams, the strongest reporting model combines all three. A dashboard helps teams monitor execution, a report captures progress against goals, and an analysis document supports decision-making when performance diverges from plan.
Criteria to Evaluate Each Marketing Report Example
Use these four criteria to assess whether a report is fit for enterprise use:
Audience: Who uses the report—executives, channel managers, finance, sales leadership, or operations teams?
Metrics: Which KPIs matter most, and are they clearly defined?
Cadence: Is the report best reviewed weekly, monthly, quarterly, or annually?
Business impact: What decision or action should the report enable?
Key Metrics (KPIs)
Below are the core KPIs that commonly appear across the best examples of marketing report in enterprise settings:
Pipeline Contribution: The amount of sales pipeline influenced or sourced by marketing activities.
Revenue Influence: Revenue associated with marketing touchpoints across the customer journey.
Customer Acquisition Cost (CAC): Total acquisition spend divided by the number of new customers acquired.
Return on Ad Spend (ROAS): Revenue generated for every unit of paid media spend.
Conversion Rate: Percentage of users or leads moving from one stage to the next.
MQL to SQL Rate: The share of marketing-qualified leads that progress to sales-qualified status.
Cost per Lead (CPL): Total campaign or channel spend divided by the number of leads generated.
Engagement Rate: A measure of interactions such as clicks, views, downloads, or time on page.
Organic Traffic Growth: Increase in visits from unpaid search over time.
Retention or Renewal Influence: Marketing’s measurable role in customer renewal, expansion, or lifecycle progression.
Budget Pacing: Comparison of actual spend against planned budget over a reporting period.
Forecast Accuracy: The degree to which projected outcomes align with actual results.
10 Enterprise-Ready Marketing Report Examples and When to Use Each
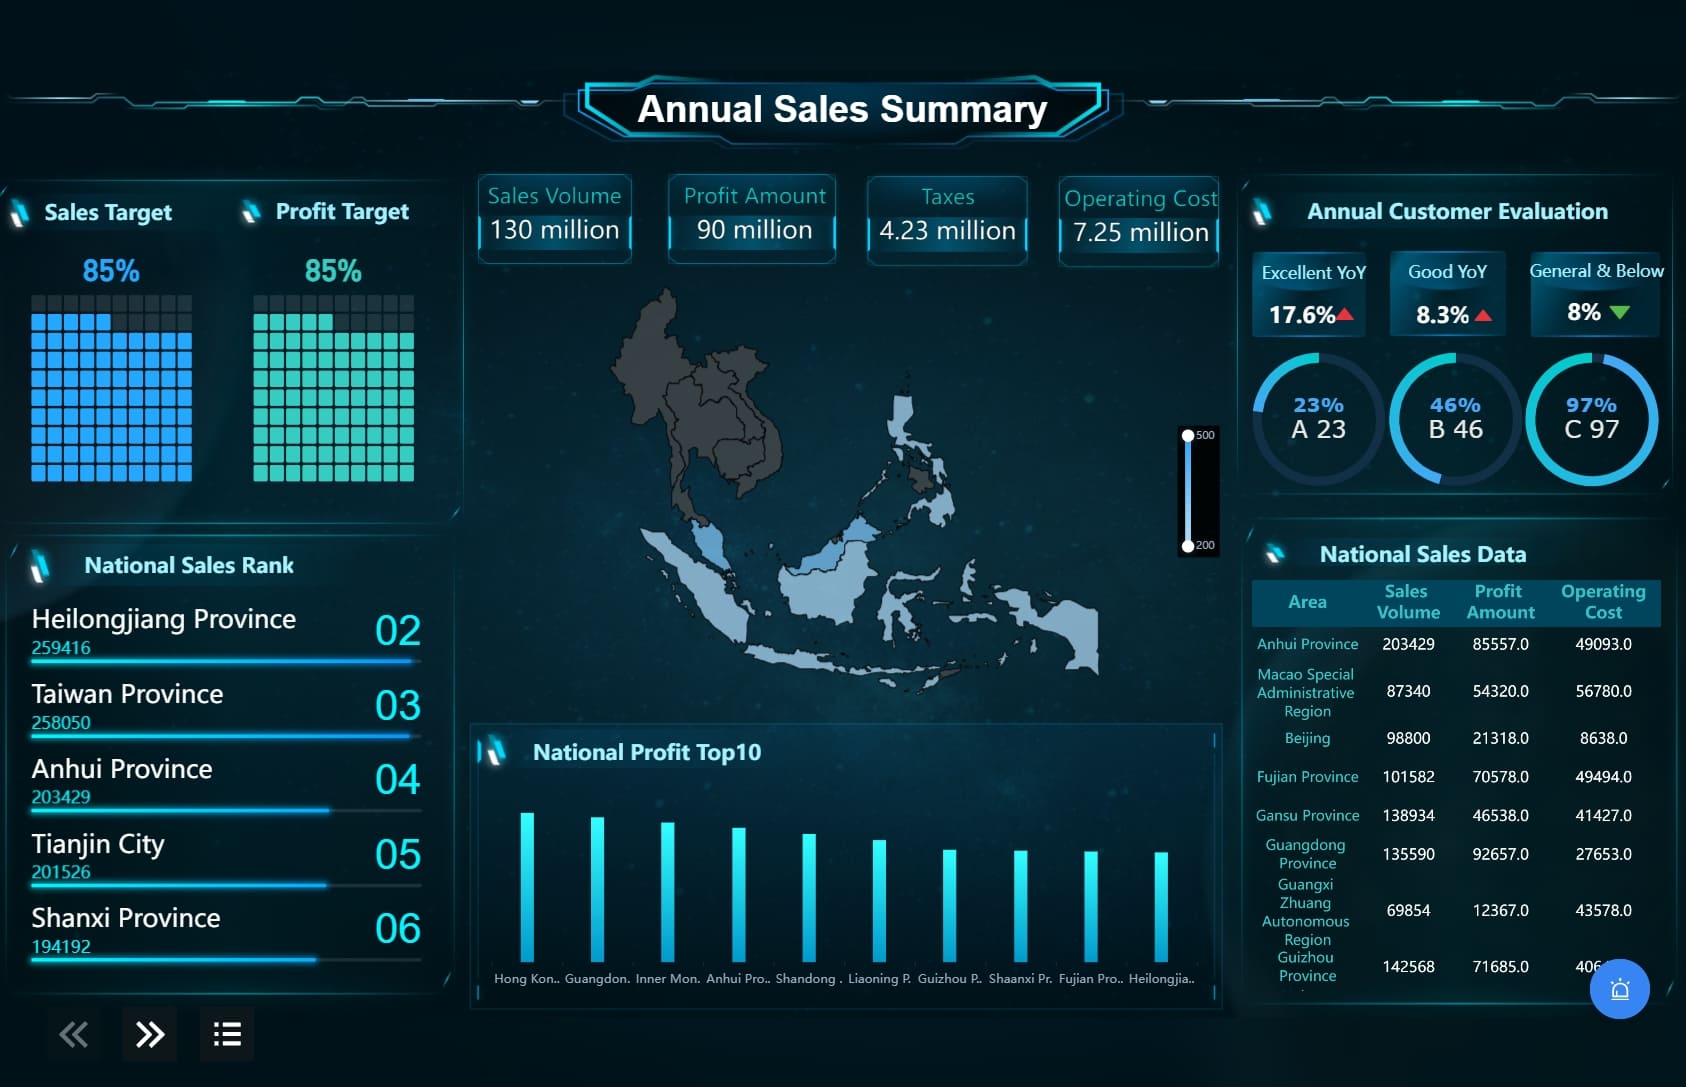
1. Executive summary report
The executive summary report is built for speed and clarity. Leaders want one view that answers three questions: Are we on target, what changed, and what action is required? This report typically includes top-line performance across pipeline, revenue influence, spend, efficiency, and strategic risks.
It is best used for quarterly business reviews, board updates, and cross-functional leadership meetings where marketing must communicate impact in business language rather than channel-specific details.
A campaign performance report isolates the effectiveness of a specific launch, promotion, webinar series, product push, or integrated marketing initiative. It helps teams understand whether campaign investment translated into reach, engagement, leads, pipeline, and revenue.
This report is most useful after a campaign closes or reaches a meaningful midpoint. It supports budget reallocation, creative optimization, and future campaign planning.
A channel performance report compares major acquisition and engagement channels such as organic search, paid search, social media, email, display, affiliate, and partner marketing. The goal is to identify where qualified pipeline and revenue actually come from—not just where traffic is highest.
This is one of the most important examples of marketing report for enterprise teams because channel mix decisions affect budget allocation, headcount planning, and strategic growth bets.
Best use cases:
Monthly or quarterly performance reviews
Channel investment decisions
Regional or business-unit comparison
Attribution analysis across online and offline influence
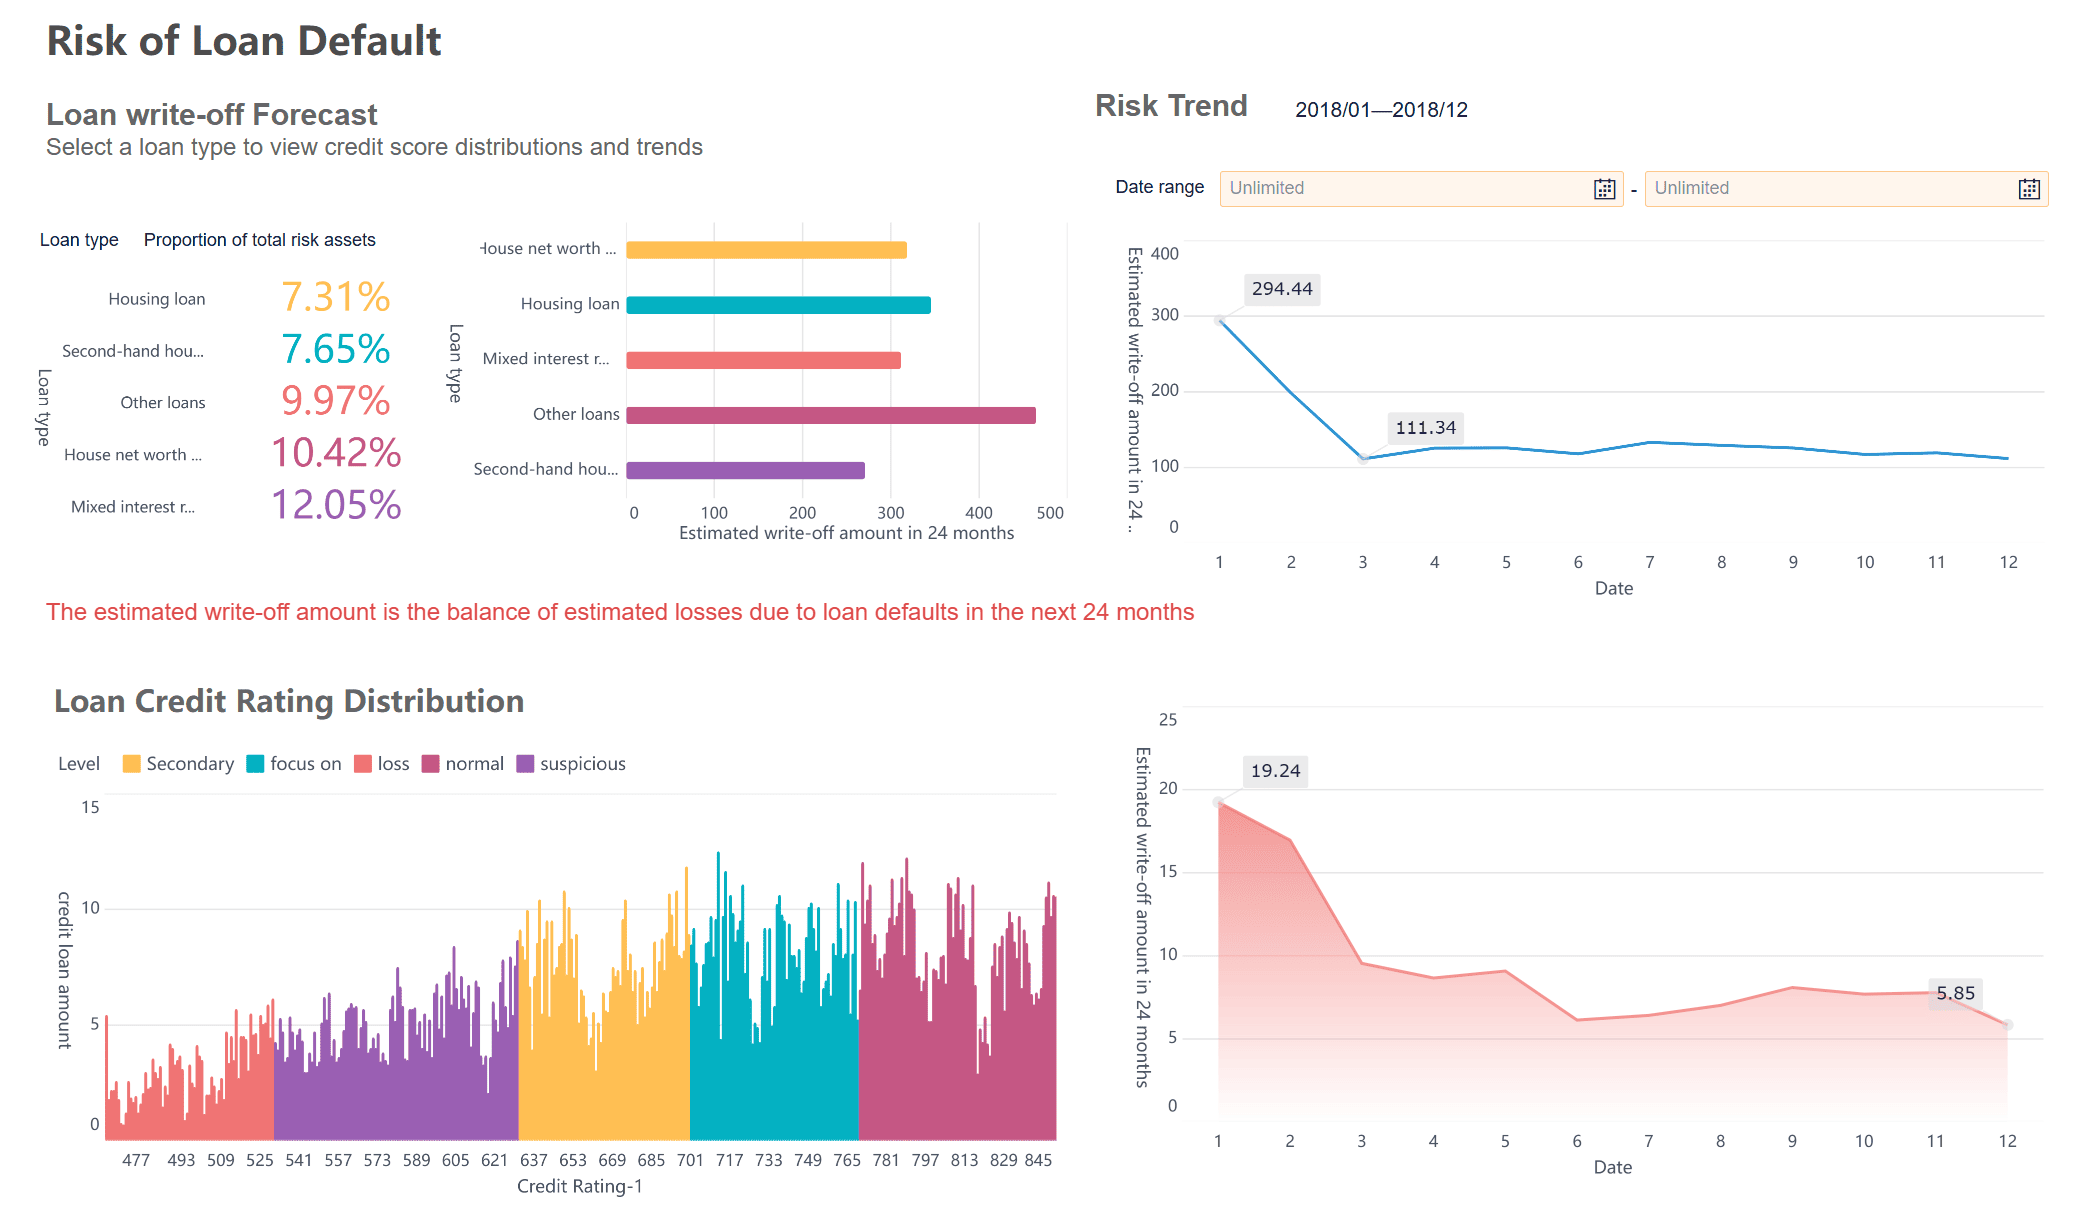
4. Lead generation and funnel report
This report tracks demand creation through the full lead lifecycle, from inquiry to MQL, SQL, opportunity, and customer. It highlights where volume is growing, where quality is deteriorating, and where the funnel is leaking.
It is especially valuable for marketing and sales alignment because it exposes handoff quality, response timing issues, stage bottlenecks, and conversion gaps between teams.
For companies selling into large organizations, the account-based marketing report is essential. Instead of focusing on individual lead volume, it measures coverage, engagement, buying committee activity, account progression, and sales collaboration across target accounts.
This report works best in enterprise sales cycles with multiple stakeholders and long buying journeys where traditional lead metrics fail to reflect true buying intent.
What it should include:
Target account coverage
Stakeholder engagement depth
Intent signals
Sales and marketing touchpoint activity
Account progression by tier
6. Content marketing report
A content marketing report evaluates the performance of blogs, white papers, webinars, landing pages, videos, case studies, and resource hubs. It goes beyond pageviews to show content’s contribution to lead generation, assisted conversions, and content ROI.
This report is ideal for editorial planning, SEO-content alignment, campaign support analysis, and proving the value of long-term content investment.
An SEO performance report measures visibility, discoverability, and demand capture through organic search. Enterprise SEO reporting must distinguish brand from non-brand growth, track ranking distribution, and connect landing page performance to pipeline impact.
This report is best for organizations investing in compounding demand generation and sustainable acquisition efficiency over time.
Core SEO elements:
Keyword ranking trends
Organic traffic growth
Non-brand traffic share
Landing page conversions
Technical and content opportunity indicators
8. Paid media report
The paid media report is designed for optimization speed. It monitors impressions, clicks, conversions, CAC, ROAS, frequency, and audience-level performance across platforms. Because spend changes quickly, this report is usually reviewed weekly or even daily by channel owners.
For enterprise teams, it should also account for creative fatigue, audience overlap, market-level differences, and post-click quality—not just front-end conversion rates.
Many enterprise teams underreport marketing’s role after acquisition. A customer retention and lifecycle report fixes that by measuring how marketing influences onboarding, product adoption, expansion interest, renewals, and customer engagement.
This report is especially important for SaaS, subscription, and account-growth businesses where marketing is expected to support lifetime value, not just top-of-funnel acquisition.
The forecast and budget report connects historical performance to future planning. It shows planned spend, expected output, scenario assumptions, and projected outcomes across channels, regions, or business units.
This report is critical for annual planning, quarterly budget revisions, and executive discussions about growth targets, efficiency constraints, and risk-adjusted scenarios.
High-value sections:
Historical trend baselines
Budget allocation by initiative
Forecasted leads, pipeline, and revenue
Best-case and worst-case scenarios
Variance assumptions and confidence levels
How to Read a Marketing Report Without Missing the Signal
A report is only valuable if stakeholders interpret it correctly. Enterprise teams often misread performance by focusing on isolated numbers, short-term fluctuations, or incomplete attribution. The better approach is to read reports through business context, metric type, trend direction, and data reliability.
Start with business context
Before reading the numbers, identify the report’s goal. Is it measuring awareness, pipeline generation, revenue contribution, retention, or efficiency? A traffic report should not be judged by the same standards as a pipeline report, and a lifecycle report should not be interpreted using acquisition-only metrics.
Strong marketing operators know the difference between what predicts performance and what confirms it.
Leading indicators suggest future performance, such as traffic growth, engagement rate, demo requests, content downloads, and account activity.
Outcome metrics confirm business results, such as pipeline, revenue, renewals, and ROAS.
The mistake is reacting too aggressively to early signal metrics without checking whether they lead to downstream value. High clicks with low opportunity creation is not success. Low engagement on a niche ABM asset may still be positive if target account progression improves.
Look for trends, not isolated numbers
One month of underperformance may reflect seasonality, delayed sales follow-up, market shifts, or tracking changes. That is why enterprise reporting should always compare current performance against:
Historical baselines
Target plans
Segment-level performance
Region or business-unit mix
Funnel-stage movement over time
Trends reveal whether a problem is structural or temporary. Is conversion down across all channels, or only in one market? Is pipeline stable because paid media improved while organic weakened? Those are the questions that matter.
Question data quality and attribution limits
No enterprise report should be consumed without some skepticism. Before making a budget or strategy decision, review the integrity of the underlying data.
Check for:
Inconsistent metric definitions across teams
CRM sync issues
Missing offline activity
Tracking changes from privacy or platform updates
Attribution model limitations
Delayed opportunity updates from sales systems
The best reports do not hide uncertainty. They label confidence levels and note where data gaps may affect interpretation.
What to Include in an Enterprise Marketing Report
Enterprise marketing reports need structure. Without a consistent framework, stakeholders spend too much time debating definitions and not enough time making decisions.
Core sections every report should have
At minimum, every report should include:
Objective and reporting scope: What question is the report answering, and which period, market, or segment does it cover?
KPIs, definitions, and benchmarks: Clear metric definitions and target comparisons.
Key insights, risks, and recommended actions: Interpretation that guides decisions, not just raw numbers.
Enterprise-specific elements that improve decision-making
To be genuinely useful in a complex organization, a report should also include:
Segment views by region, product line, account tier, or business unit
Attribution commentary and confidence level
Data limitation notes
Action owners and deadlines
Follow-up questions for stakeholders
Drill-down capability for teams that need more detail
These elements help senior decision-makers trust the report while allowing operational teams to investigate root causes.
Common Reporting Mistakes and How to Avoid Them
Even well-funded teams often produce weak reports. The issue is rarely a lack of tools. It is usually a lack of reporting discipline.
1. Reporting too many metrics without a clear decision framework
When every metric is shown, nothing stands out. Reports should be designed around a specific decision or business question.
Best practice: Limit the headline view to a small set of business-critical KPIs, then provide drill-down details only where needed.
2. Using inconsistent definitions across teams and platforms
If marketing, sales, finance, and operations define leads, opportunities, influenced revenue, or CAC differently, reporting becomes political instead of practical.
Best practice: Establish a shared metric dictionary and embed those definitions directly into the report.
3. Presenting data without interpretation, recommendations, or next steps
A table of numbers is not a management tool. Decision-makers need context and recommended actions.
Best practice: Require every report to include insights, risks, and a proposed action plan.
4. Choosing the wrong report cadence for the speed of the business
Some metrics should be monitored daily. Others only make sense monthly or quarterly. If cadence is wrong, teams either overreact or respond too slowly.
Best practice: Match cadence to operational volatility and decision timing. Paid media needs frequent review. Content ROI and SEO trends need a longer window.
How to Choose the Right Report for the Right Audience
The best examples of marketing report are tailored to the person making the decision. A CMO does not need the same view as a paid media manager, and finance does not need the same detail as demand generation.
What executives need versus what channel managers need
How reporting changes by weekly, monthly, quarterly, and annual cadence
Weekly: Best for paid media, campaign pacing, and operational adjustments
Monthly: Best for channel performance, lead funnel health, and cross-team reviews
Quarterly: Best for executive summaries, strategic trends, and budget decisions
Annual: Best for forecasting, planning, and investment modeling
A simple checklist for selecting the best report format, scope, and level of detail
Use this checklist before building any report:
What decision should this report support?
Who is the audience?
Which KPIs matter most to that audience?
What level of segmentation is required?
How often should this be reviewed?
What actions should follow from the report?
What are the data limitations?
How to Build These Reports Effectively in Practice
Building enterprise reporting manually across spreadsheets, BI exports, ad platforms, web analytics, and CRM systems is slow and error-prone. The smarter approach is to standardize the reporting model, automate refresh cycles, and create reusable templates that align with stakeholder needs.
Here are proven best practices from an implementation standpoint.
1. Standardize KPI definitions before building the report
Start with governance, not visuals. Align marketing, sales, finance, and operations on exactly how each KPI is calculated. Document lead stages, attribution logic, cost allocation rules, and segment definitions before you design the dashboard or report.
Consultant tip: If teams disagree on definitions after launch, adoption drops fast. Set the rules first.
2. Build role-based views from a shared data model
Use one trusted data foundation, then present different views for executives, managers, and analysts. This avoids duplicated reporting logic while keeping each report relevant to its audience.
Consultant tip: One source of truth with multiple presentation layers is the most scalable model for enterprise reporting.
3. Use benchmarks, targets, and variance logic in every report
Raw numbers alone are weak. Every enterprise report should show performance against target, historical baseline, or forecast. Add variance indicators so users can instantly spot whether the metric is improving, stable, or off plan.
Consultant tip: If a stakeholder cannot tell within seconds whether action is needed, the report is not finished.
4. Add commentary and actions, not just charts
The report should tell users what changed, why it matters, and what to do next. Build in space for narrative insight, risk flags, owner assignment, and follow-up deadlines.
Consultant tip: Decision-ready reporting always combines data, interpretation, and accountability.
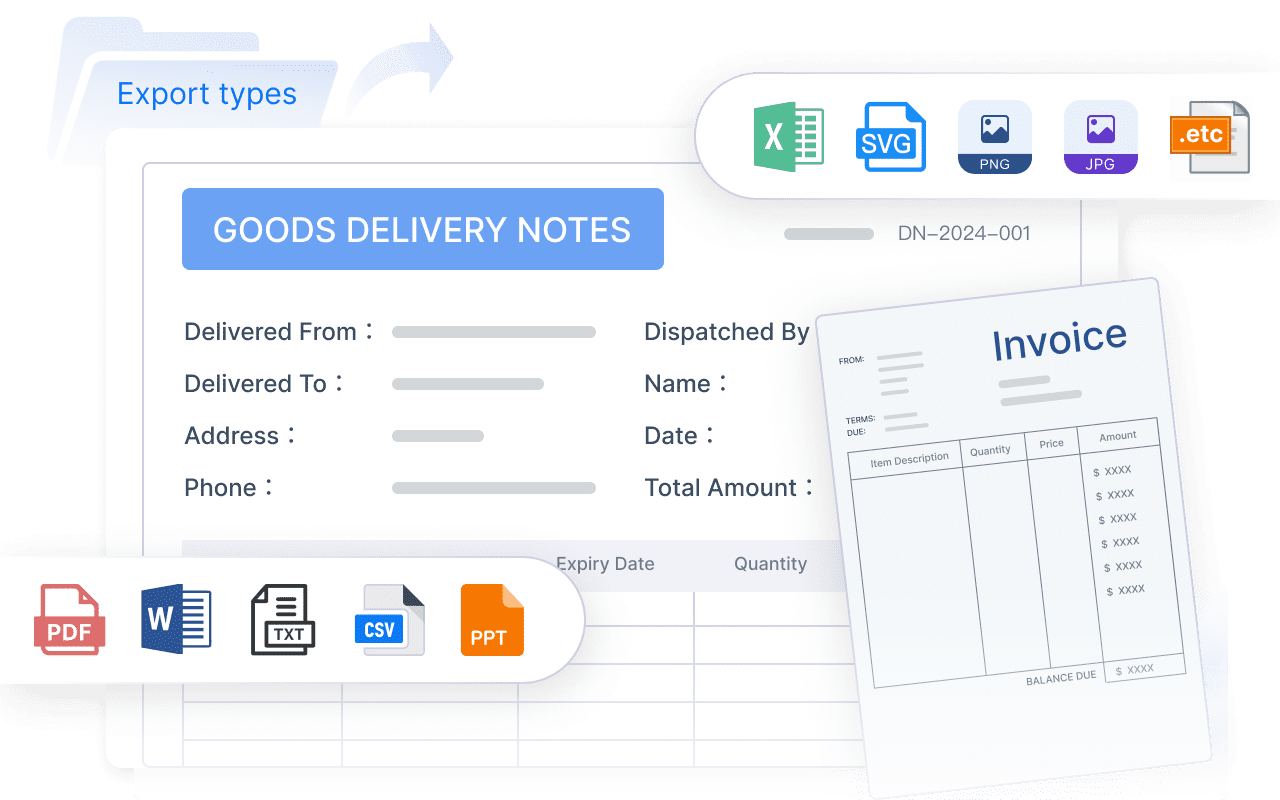
5. Automate recurring workflows wherever possible
Manual report assembly wastes analyst time and introduces avoidable errors. Automate data refreshes, scheduled distribution, alerts, and recurring templates so teams can focus on analysis instead of formatting.
Consultant tip: Automation is not only a productivity gain. It is also a trust gain, because stakeholders receive consistent reporting on time.
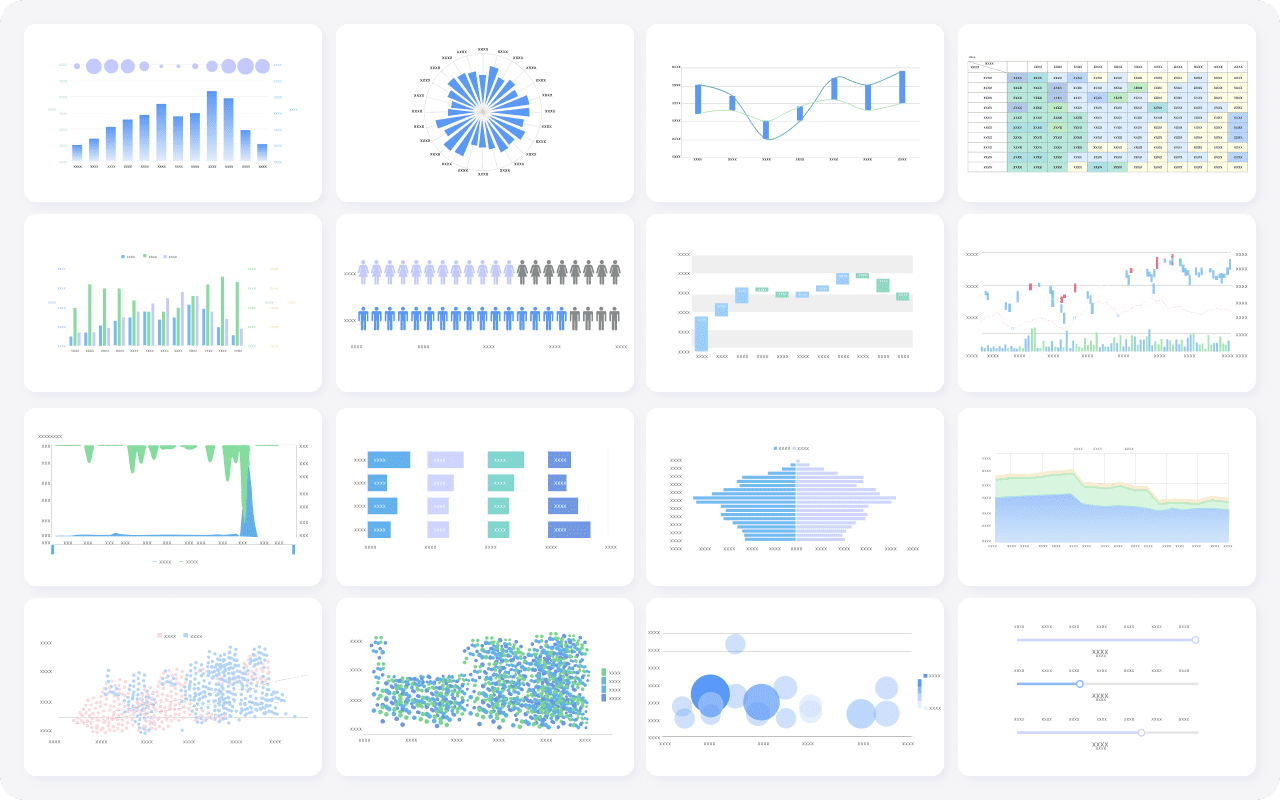
Build Enterprise Marketing Reports Faster with FineReport
At this point, the pattern is clear: each report serves a different business decision, but all enterprise-ready reports require standardized metrics, trustworthy data, flexible segmentation, and clear executive presentation. Building this manually is complex; use FineReport to utilize ready-made templates and automate this entire workflow.
FineReport helps enterprise teams create executive summary reports, campaign dashboards, channel comparisons, funnel tracking, ABM views, SEO performance reporting, paid media analysis, retention reporting, and budget forecasting in one scalable environment. Instead of stitching together spreadsheets and disconnected tools, teams can centralize reporting logic, visualize KPIs clearly, and deliver the right report to the right audience at the right cadence.
Create executive dashboards and detailed drill-down views
Improve trust in reporting with governed, consistent logic
If your team is still building marketing reports manually, that is usually the bottleneck. Modern enterprise reporting should be automated, scalable, and decision-focused from the start.
It should connect marketing activity to business outcomes like pipeline, revenue influence, cost efficiency, and budget pacing. The most useful reports also show goal versus actual performance and make the next action clear.
A marketing report summarizes performance over a set period and is usually tied to KPIs, targets, and decisions. A dashboard is more for ongoing monitoring of real-time or near-real-time metrics.
Common enterprise KPIs include pipeline contribution, revenue influence, CAC, ROAS, conversion rate, CPL, MQL to SQL rate, and budget pacing. The right mix depends on the audience and the decision the report needs to support.
That depends on the report type and its purpose. Operational and campaign views may be reviewed weekly or monthly, while executive summary reports are often used in quarterly business reviews.
A useful report is built around a specific business question and helps stakeholders decide what to scale, fix, or stop. It should standardize definitions, reduce noise, and present metrics in a way decision-makers can trust.
Product Trial
FineReport
Pixel-perfect reports · Interactive dashboards · Easy data entry · Digital twins