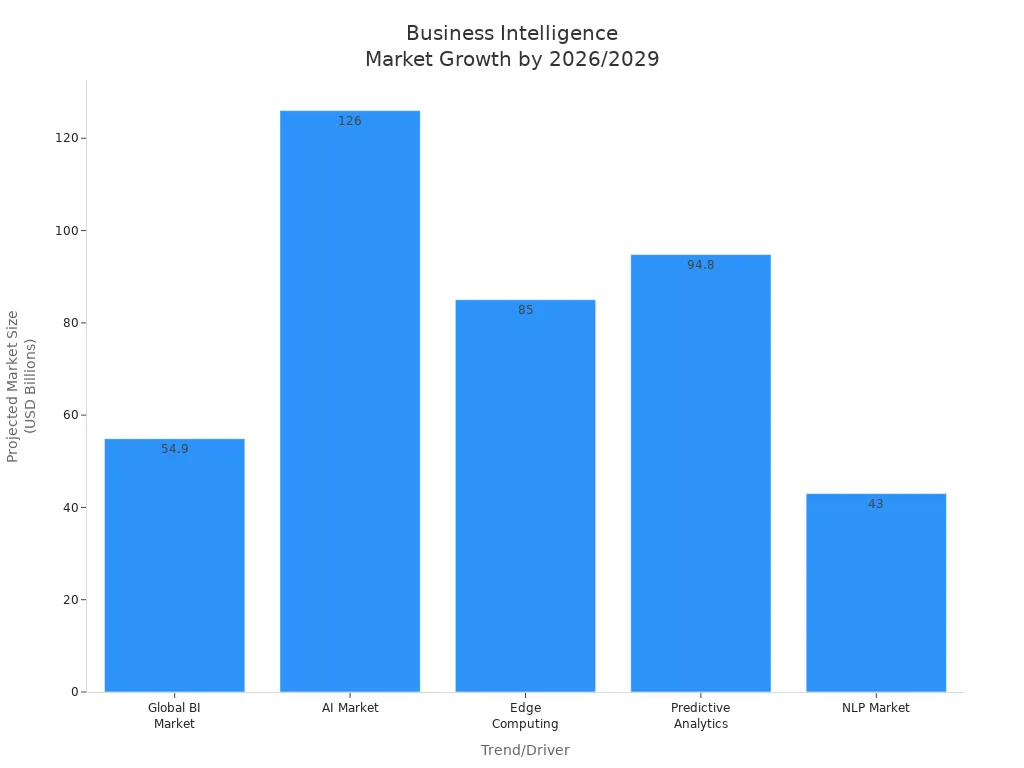
The business intelligence marketplace in 2026 will experience robust expansion, driven by rapid advancements in analytics, AI, and real-time data integration. Companies will prioritize data-driven decision making, with over 70% investing in capabilities to enhance operational efficiency. The business intelligence market is projected to grow at a CAGR of 11.2%, reaching new heights by 2033.
| Year | Market Size (USD Billion) | CAGR (%) | Expected Size by 2033 (USD Billion) |
|---|---|---|---|
| 2024 | 30.5 | N/A | N/A |
| 2026 | N/A | 11.2 | N/A |
| 2033 | N/A | N/A | 79.29 |
Business intelligence trends such as AI-powered analytics, edge computing, and predictive modeling will reshape industries. Brands like FanRuan and products like FineBI will empower organizations with self-service analytics, advanced visualization, and seamless data integration, strengthening decision-making and collaboration.
Business Intelligence Marketplace Overview
Market Size and Growth Forecasts
The business intelligence market continues to show impressive growth across global and regional sectors. Analysts expect the global market to reach $32.4 billion by 2025, with projections doubling to $64.3 billion by 2035. The Chinese business intelligence marketplace is forecasted to hit $3.8 million by 2035, while the UK market will grow to $32.4 million in the same period. The compound annual growth rate (CAGR) for the business intelligence market is estimated at 27% from 2026 to 2032, reflecting strong momentum in adoption and investment.
| Year | Global Market Size (USD) | CAGR (%) |
|---|---|---|
| 2025 | 32.4 billion | 7.1 |
| 2035 | 64.3 billion |
Market trends indicate that technological advancements and increased data volumes are fueling this expansion. The integration of big data and cloud computing has improved business intelligence software capabilities, making analytics more accessible and effective for organizations in healthcare, IT, and manufacturing.
Key Drivers of Expansion
Several factors drive the rapid growth of the business intelligence market. Companies increasingly rely on data for strategic decision-making, and the need for real-time analytics has become essential. The adoption of AI and machine learning technologies automates data analysis, revealing deeper insights and supporting business analytics initiatives. Cloud-based solutions facilitate easier access to business intelligence tools, promoting wider usage and scalability.
| Driver of Expansion | Description |
|---|---|
| Increasing demand for data-driven decision-making | Organizations are increasingly relying on data to inform their strategic choices. |
| Integration of AI and ML technologies | These technologies enhance BI solutions by automating data analysis and revealing insights. |
| Adoption of cloud-based solutions | Cloud solutions facilitate easier access to BI tools and data, promoting wider usage. |
| Focus on digital transformation | Companies are prioritizing digital initiatives to improve efficiency and competitiveness. |
| Need for real-time data analysis | The ability to analyze data in real-time is crucial for timely decision-making in businesses. |

- Technological advancements and increased data volumes enhance data processing and real-time analytics.
- The healthcare sector expands its use of business intelligence for improved patient care, especially during global events like the COVID-19 pandemic.
- IBM’s launch of the IBM Cloud Multizone Region demonstrates how cloud computing supports business intelligence market growth.
Data visualization and mobile analytics also play a significant role, enabling decision-makers to access insights on the go. As organizations foster a data culture, business intelligence software becomes a cornerstone for digital transformation and operational excellence.
Business Intelligence Trends Shaping 2026

AI-Powered Analytics and Automation
Artificial intelligence continues to transform the business intelligence marketplace. Companies now rely on AI-powered analytics to automate complex tasks and deliver actionable insights faster than ever. AI systems analyze large volumes of data, identify patterns, and generate predictive models that support data-driven decisions. Natural language processing allows non-technical users to interact with business intelligence software, making advanced analytics accessible to everyone.
| Benefit | Description |
|---|---|
| Enhanced Data Analysis | AI automates insights and improves predictive accuracy, leading to smarter decision-making. |
| Real-time Data Processing | AI enables the creation of predictive models and automates reports for timely insights. |
| Improved Usability | Natural language processing allows non-technical users to access complex data easily. |
| Reduction of Human Error | AI systems operate with high precision, minimizing mistakes in data analysis. |
| Competitive Advantage | Insights from AI analytics help businesses make better investments and enhance customer experiences. |
Organizations across sectors report measurable improvements in efficiency and accuracy. For example, AI-driven quality control identifies defects quickly, ensuring compliance and reducing waste. Human resources departments automate tasks and improve talent acquisition. Finance teams speed up forecasting and risk management. Supply chain managers use predictive analytics to enhance operational efficiency and demand forecasting.
| Sector | Improvement Description |
|---|---|
| Quality Control | AI-driven quality control identifies defects efficiently, ensuring compliance and reducing waste. |
| Human Resources | Automates tasks, enhances talent acquisition, and reduces bias in hiring processes. |
| Finance | Speeds up data analytics, forecasting, and risk management, significantly updating manual processes. |
| Supply Chain Management | Enhances operational efficiency and demand forecasting through predictive analytics. |
These advancements drive growth in the business intelligence market and set new standards for business analytics.
Real-Time Data Processing
Real-time data processing has become a cornerstone of modern business intelligence trends. Companies now expect instant access to live data, enabling rapid decision-making and operational agility. The convergence of streaming and batch processing platforms simplifies data architectures, allowing organizations to manage both types of workloads seamlessly.
| Trend | Description |
|---|---|
| Convergence of Streaming and Batch | Anticipated unification of platforms that can handle both streaming and batch processing seamlessly, simplifying data architectures. |
| Real-Time Data Observability | The rise of specialized solutions for monitoring data quality and performance, ensuring reliability in real-time data processing pipelines. |
| Democratization of Real-Time Analytics | Increasing accessibility of real-time analytics tools for non-technical users, facilitated by low-code/no-code platforms and intuitive interfaces, empowering business users to gain insights without heavy reliance on technical staff. |
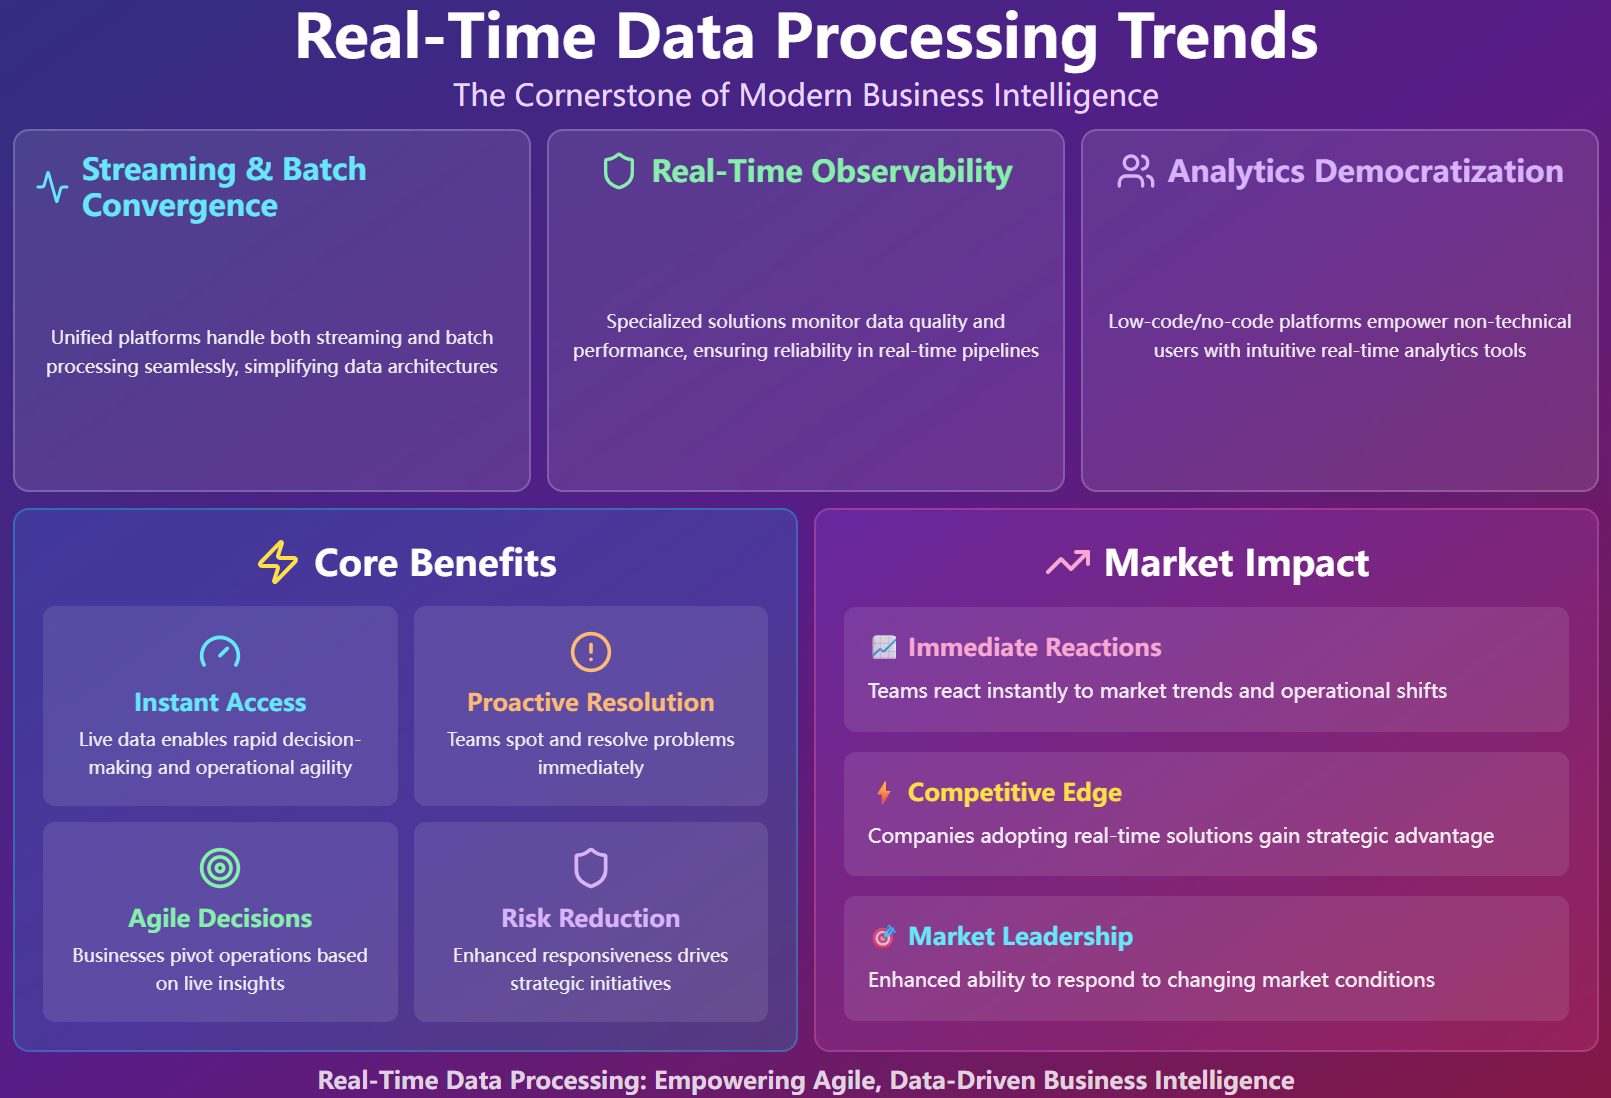
Real-time analytics enables businesses to make rapid, data-driven decisions with instant access to live insights, allowing teams to react immediately to market trends and operational shifts.
- Teams proactively spot problems and resolve them immediately, enhancing operational agility.
- Real-time analytics provides insights necessary for agile decision-making, enabling businesses to pivot operations as needed.
- Leveraging real-time data analysis enhances responsiveness and reduces risks, driving strategic initiatives with actionable insights.
These trends reflect the growing importance of real-time data processing in the business intelligence marketplace. Companies that adopt these solutions gain a competitive edge and improve their ability to respond to changing market trends.
Self-Service BI and Data Democratization
Self-service business intelligence and data democratization are reshaping how organizations use data. Employees across departments now access business intelligence software without relying on IT specialists. This shift empowers teams to explore data, create reports, and visualize trends independently.
Democratizing data allows employees to work more efficiently and build better connections with colleagues. This access to information increases their autonomy in decision-making, leading to higher productivity and stronger relationships with managers and team members.

- Enhances innovation by allowing employees from various departments to access data freely, leading to creative problem-solving.
- Boosts operational efficiency as team members can identify inefficiencies and streamline processes with real-time data access.
- Encourages informed decision-making at all levels, ensuring decisions are based on comprehensive insights rather than limited information.
- Fosters a data-driven culture where decisions are based on insights, enhancing collaboration.
- Improves decision-making ability by allowing quick access to necessary information, increasing responsiveness.
- Breaks down departmental silos, promoting cross-functional collaboration and shared insights.
Self-service BI tools and data democratization support the growth of a data-driven culture. Organizations that embrace these business intelligence trends experience higher employee engagement, improved operational efficiency, and better business outcomes. As market trends evolve, companies must prioritize data accessibility and empower their workforce to leverage analytics for strategic growth.
FanRuan Solutions in the Business Intelligence Market
FineBI for Data Integration and Visualization
FanRuan stands out in the business intelligence marketplace by offering robust solutions that simplify data integration and visualization. FineBI enables organizations to connect with over 30 big data platforms and SQL data sources, including Excel file datasets. The platform uses a folder-based approach to organize data by business subject, making management straightforward.

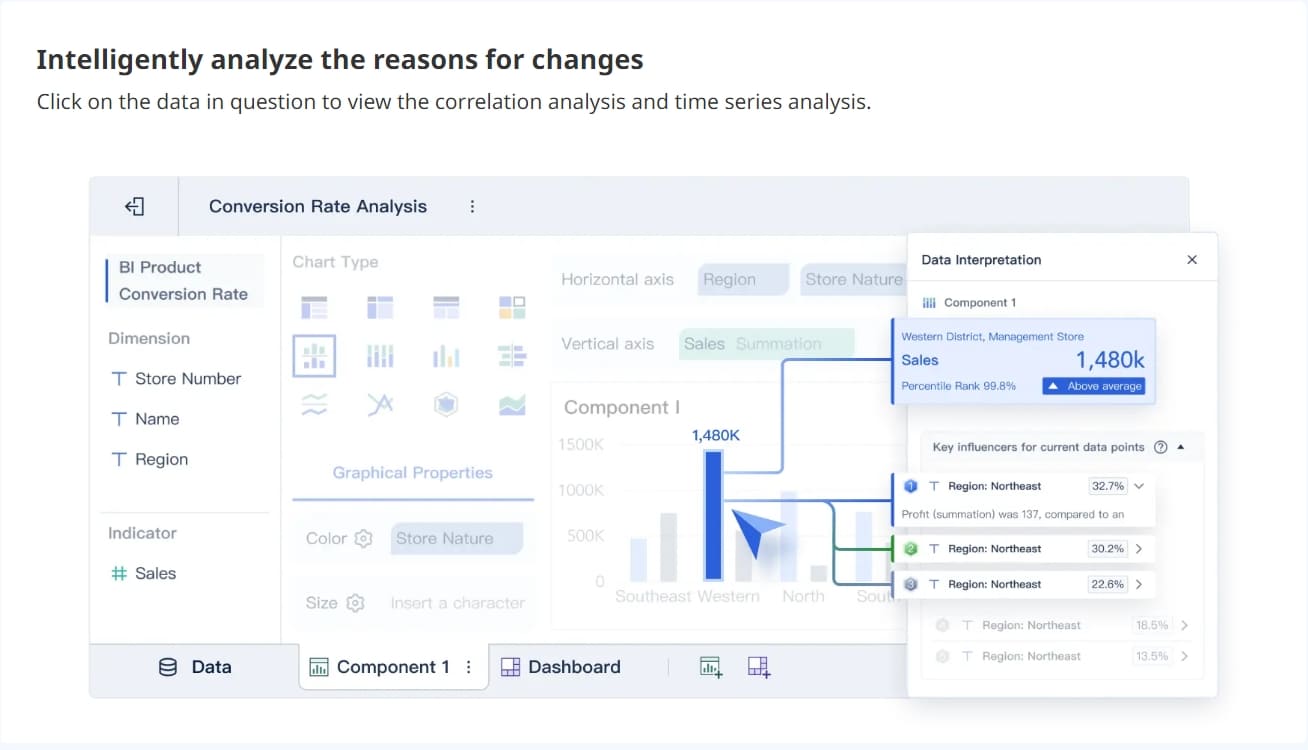
Administrators can model data based on warehouse relationships and configure linkages for joint analysis. Users benefit from intuitive visual data analysis, which highlights data issues and recommends optimal visual effects. FineBI recognizes dimensions and indicators, supporting various calculations and exploration methods. Customizable dashboards allow users to merge analytic data into unified reports, improving communication and decision-making.

| Feature | Description |
|---|---|
| Data Source Connectivity | FineBI supports connections with over 30 big data platforms and SQL data sources, as well as Excel file datasets. |
| Data Management | It employs a folder-based approach for classifying data according to business package subjects. |
| Data Modeling | Admins can model data based on relationships in the data warehouse and configure linkages for joint analysis. |
| Visual Data Analysis | Users can intuitively identify data issues and receive recommendations for visual effects based on selected data. |
| Analysis Capabilities | FineBI recognizes dimensions and indicators, allowing for various calculations and data exploration methods. |
| Dashboard Functionality | Users can merge analytic data into unified reports with customizable dashboards for effective data communication. |
FineBI differentiates itself in the business intelligence market through several key features:
- Self-Service Analytics: Users conduct their own analyses using a drag-and-drop interface, reducing reliance on IT support.
- Interactive Dashboards: Stakeholders explore data dynamically, gaining deeper insights.
- Data Visualization: A wide range of visualization options enhances the communication of insights.
- Real-Time Data Analysis: Users analyze data as it is generated, enabling quick responses to business changes.


Real-World Impact: Customer Success Stories
FanRuan solutions deliver measurable results across industries. Lotte.com used customer experience analytics to understand shopping cart abandonment, resulting in a $10 million increase in sales. Cementos Argos established a business analytics center to standardize finance processes, leading to enhanced profitability and insights. Sabre Airline Solutions leveraged real-time dashboards to analyze customer behavior, boosting revenue and client satisfaction.
| Company | Impact Description | Result/Benefit |
|---|---|---|
| Lotte.com | Used customer experience analytics to understand shopping cart abandonment. | $10 million increase in sales. |
| Cementos Argos | Established a business analytics center to standardize finance processes. | Enhanced profitability and insights. |
| Sabre Airline Solutions | Leveraged real-time dashboards to analyze customer behavior. | Boosted revenue and client satisfaction. |
Industries such as retail and healthcare report significant benefits from FanRuan solutions. Retailers improve customer behavior analysis and inventory management, optimizing stock levels and reducing costs. Healthcare organizations enhance patient data analysis, clinical trial efficiency, and operational processes. FanRuan continues to drive innovation and efficiency, shaping trends in the business intelligence marketplace.
Data Governance and Security in BI
Managing Data Quality and Compliance
Organizations in the business intelligence marketplace recognize that strong data governance is essential for reliable analytics and regulatory compliance. They treat data as a valuable product, driving business value and insights. Teams align governance policies with IT standards to avoid silos and maintain consistency. Quality assurance practices ensure accuracy and reliability, while automated tools streamline data management and compliance monitoring.
Regular audits and performance reviews help organizations adapt governance strategies to evolving regulations and business needs.
Companies establish clear data quality standards and policies. They perform regular assessments to identify and resolve issues. Automation plays a key role, with tools that check data quality and enforce compliance. Training programs educate employees on maintaining standards, and dedicated teams oversee data quality management.
| Aspect | Description |
|---|---|
| Data Governance Framework | Establishes policies, standards, roles, and responsibilities for managing data assets. |
| Compliance | Adheres to legal, regulatory, and ethical standards governing data usage. |
| GDPR Requirements | Mandates accurate records of customer consent and emphasizes data quality to avoid violations. |
| CCPA Requirements | Requires businesses to maintain detailed records of personal data and respond to consumer requests. |
| Risk Reduction | A robust governance program reduces the likelihood of violations and provides documented evidence. |
| Financial Impact | Non-compliance can lead to significant fines, e.g., GDPR fines can reach up to €20 million. |
Aligning governance with compliance builds trust with consumers and stakeholders. Effective governance reduces risks and unlocks more value from data.
Role-Based Access and Privacy Controls
Role-based access controls (RBAC) serve as a cornerstone for data privacy and security in business intelligence platforms. RBAC ensures that only authorized roles can modify or view sensitive information, preserving data integrity and authenticity. This approach minimizes the risk of unauthorized access, whether from internal threats or external attacks.
| Key Benefits of RBAC | Description |
|---|---|
| Simplifies access management | Groups users into roles for easier management. |
| Enforces least privilege | Limits access to only what is necessary for each role. |
| Scales easily | Adapts to organizational growth and changes in roles. |
| Aids compliance | Supports regulatory requirements with clear access controls. |
Organizations implement privacy controls using several strategies:
- Privacy by Design: Integrates privacy into system development to anticipate and mitigate concerns.
- Privacy by Default: Sets privacy settings to the highest level, collecting only necessary data.
- Centralized governance with defined roles and a designated privacy officer.
- Data inventory and mapping to visualize flows and identify risks.
- Standardized processes for impact assessments, requests, and breach handling.
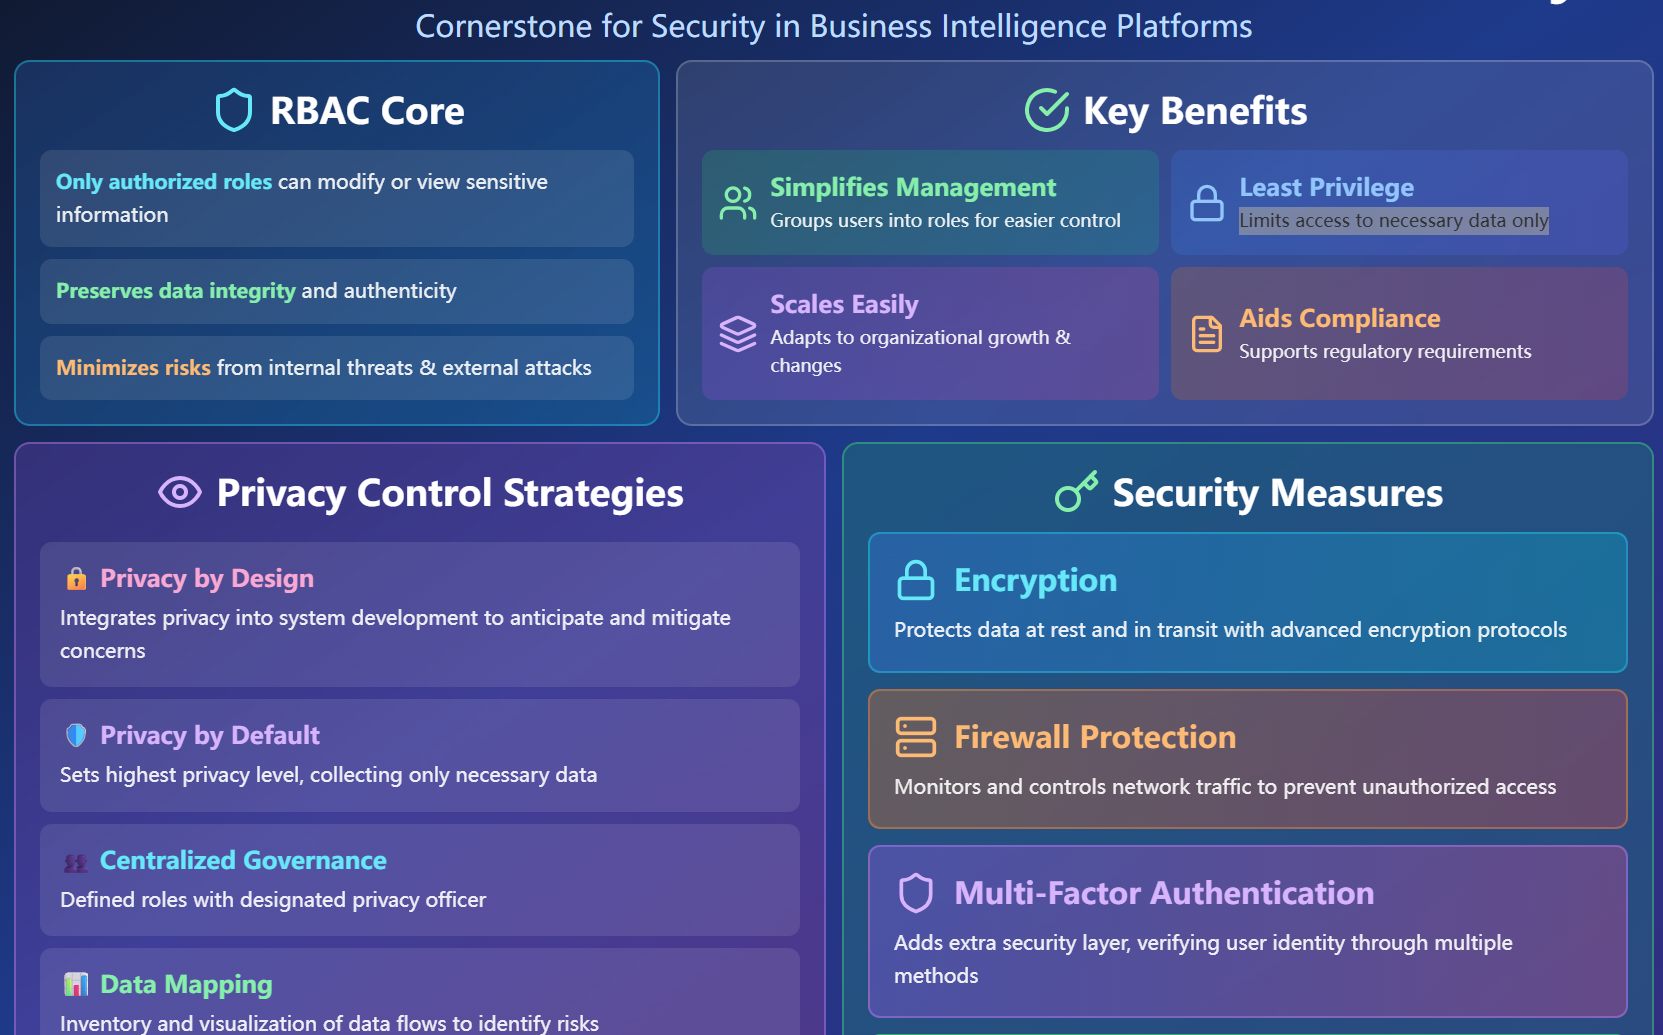
Security measures such as encryption, firewall protection, and multi-factor authentication further protect sensitive information. These controls ensure that data remains secure and accessible only to those who need it, supporting compliance and building trust in the business intelligence marketplace.
Advanced Visualization and Predictive Insights

Interactive Dashboards and Augmented Analytics
Organizations now rely on interactive dashboards to transform complex data into actionable insights. These dashboards allow users to customize views, which keeps engagement high and supports ongoing use. An intuitive design reduces abandonment rates and encourages consistent interaction. Business leaders see dashboards as essential tools for strategic planning and informed decision-making.
| Trend | Description |
|---|---|
| Augmented Analytics | Utilizes AI to automate data analysis, making insights accessible to non-technical users. |
| Natural Language Query | Allows users to interact with data using everyday language, simplifying data access and insights. |
| Self-Service Analytics | Empowers users to perform data analysis independently, reducing reliance on IT teams. |
Active data exploration becomes possible as users interact with information in real time. This approach provides immediate visibility and enables on-the-spot decisions. Customization and flexibility ensure dashboards meet the needs of different roles within an organization. Companies using interactive dashboards are more likely to find timely insights compared to those using static reports. The business intelligence market continues to expand, with projections showing significant growth through 2033.
Forecasting and Scenario Modeling
Advanced analytics now play a central role in forecasting and scenario modeling. Predictive analytics tools help organizations evaluate different scenarios using data science and machine learning. Leaders use these tools to make accurate decisions about business strategy. AI forecasting engines address a wide range of planning needs and challenges across the enterprise.
| Technique | Description |
|---|---|
| AI Forecasting Engine | Leverages machine learning for business planning and challenge resolution. |
| Scenario Modeling | Models a large number of scenarios reflecting changes in market and economic indicators. |
| Automated Forecast Creation | Uses machine learning to build optimal algorithms, improving accuracy and reducing bias. |
Predictive insights shift organizations from traditional decision-making to data-driven strategies. This transition helps identify trends and anticipate market changes. AI's role in strategic frameworks fosters innovation and resilience in a rapidly evolving business landscape.
Tip: Identify key issues and analyze critical uncertainties to strengthen scenario planning and improve outcomes.
Adapting to Business Intelligence Marketplace Changes
Strategies for Future-Proofing BI Investments
Organizations must adopt proactive strategies to ensure their business intelligence investments remain valuable as technology evolves. Leaders focus on increasing productivity to contain costs and enhancing employee experience to attract and retain talent. They improve adaptability by equipping teams with tools for agile practices. Delivering better visibility through near real-time insights supports informed decision-making. Reducing risk remains a priority, with measures in place to minimize cyber threats and fraud.
- Upskilling and reskilling the workforce prepares teams for future changes. Investment in training and technology ensures employees can adapt to new analytics platforms and methodologies.
- Cloud-based bi solutions offer scalability and flexibility, enabling organizations to respond quickly to market shifts.
- AI-powered analytics and self-service BI tools allow decision-makers to access data instantly, optimizing resource allocation and improving operational efficiency.
A flexible culture encourages open-mindedness and innovation, enabling teams to pivot strategies as the business demands.
Building a Data-Driven Culture with FanRuan
FanRuan supports organizations in developing a robust data-driven culture. The platform provides advanced applications that streamline analytics and empower business teams.
| Application Type | Description |
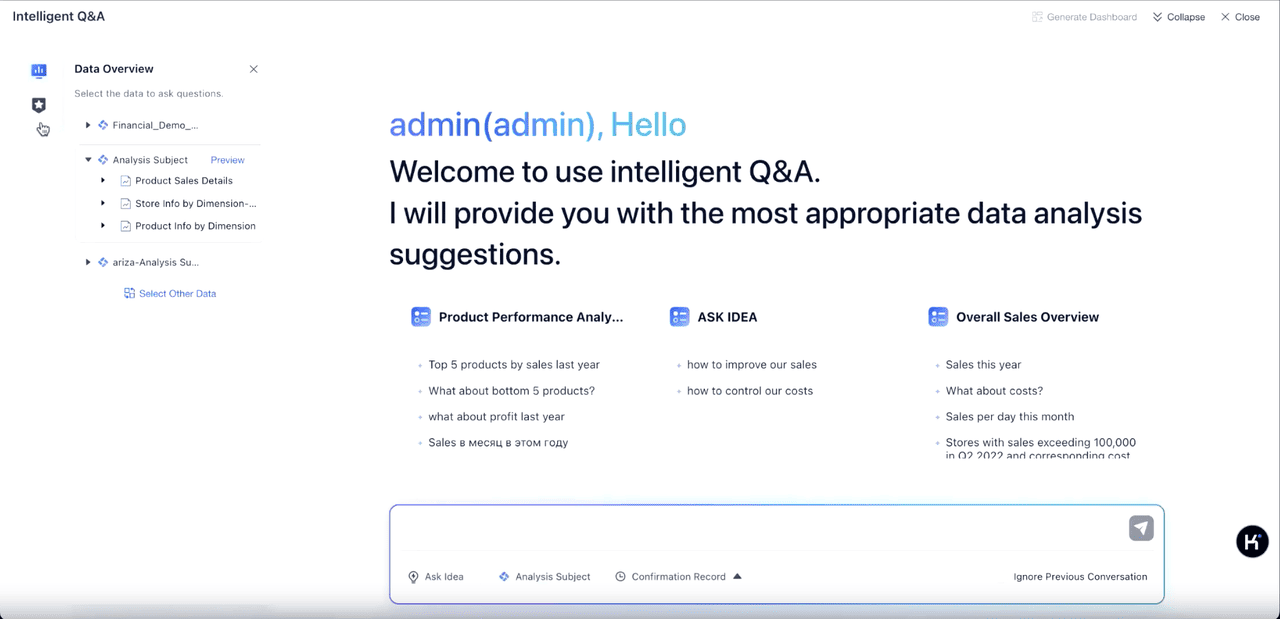
|---|---|
| Q&A Data Retrieval | Enables business teams to query data using natural language, significantly reducing query time. |
| Smart Reporting | Combines large-model semantic analysis with visualization for instant analytics. |
| AI Agent Decision Support | Integrates business logic with model reasoning for automated analysis and alerts. |
FanRuan and FineBI facilitate scalable, agile BI adoption. Teams leverage real-time data and intuitive dashboards to monitor market trends and customer behavior. The integration of cloud-based bi solutions ensures secure access and collaboration across departments. Organizations that embrace these technologies build resilience and maintain a competitive edge in a rapidly changing marketplace.
Business intelligence in 2026 will center on ai-powered insights, self-service analytics, and real-time insights. Organizations can adapt by following these steps:
- Adjust revenue models to meet market demands.
- Build flexible infrastructure for scalability.
- Invest in automation and AI for efficiency.
- Use business intelligence tools to analyze data.
- Hire adaptable talent.
- Capture customer feedback for improvement.
- Apply change management principles.
- Rethink organizational structures.
- Monitor performance with clear KPIs.
Staying proactive in tracking business intelligence marketplace changes will help organizations remain competitive.


FAQ

The Author
Lewis
Senior Data Analyst at FanRuan
Related Articles

ERP Reporting Explained: What It Is, How It Works, and Why Enterprise Teams Rely on It
ERP reporting is the process of turning data inside your enterprise resource planning system into usable business insight. For finance leaders, operations directors, supply chain managers, and IT teams, that matters beca
Yida Yin
Jun 25, 2026
8 Best Restaurant Reporting Software Tools for 2026: Compare FineReport, Toast, SpotOn & More
$1 is a highly customizable business intelligence and reporting platform that helps restaurants turn POS, labor, inventory, finance, and multi location data into real time dashboards and decision ready reports. 8 Best Re
Yida Yin
Jun 24, 2026

Database Reporting Architecture: When to Use a Reporting Database vs Your Operational System
$1 is not just about pulling data into a dashboard. It is an architecture decision that affects application performance, reporting speed, data trust, and how confidently your teams can make decisions. If you are an IT ma
Yida Yin
Jun 24, 2026