A self service analytics platform gives you the power to access, analyze, and visualize data without needing advanced technical skills. This type of platform supports self service business intelligence by letting you explore insights independently, which increases your control over analytics.
You no longer need to rely solely on IT teams for reports or dashboards. The shift to self-service analytics means you can create visualizations and make decisions faster. Many organizations now report improved efficiency and faster insights. FineBI stands out in this space, offering an intuitive, enterprise-grade self service analytics platform.
| Statistic | Percentage |
|---|---|
| Organizations reporting improved operational efficiency | 59% |
| Users saving time on data preparation | 85% |
| Business users making quick decisions | 90% |
- Self-service analytics democratizes data access and reduces IT dependency.
- Companies see faster decision-making and better business outcomes.
Understanding Self Service Analytics Platform
What is Self Service Analytics
A self service analytics platform gives you the ability to explore and analyze data without needing advanced technical skills. You can access information, create visualizations, and generate reports on your own. This approach changes how organizations use analytics. You do not need to wait for IT teams to deliver insights. You can answer business questions quickly and make decisions based on real-time data.
Industry analysts define self service analytics as a way for users at all levels to access and analyze data. You can visualize data without IT support. This method democratizes analytics, breaks down silos, and helps you make agile decisions. You gain control over your analytics journey. You can explore trends, monitor performance, and respond to changes faster.
Self service analytics platforms stand out because they focus on usability. You get intuitive interfaces and guided workflows. You can connect to multiple data sources, clean and prepare data, and build dashboards with drag-and-drop tools. You do not need to write code or learn complex query languages. You can customize dashboards and reports to fit your needs.
Tip: Self service analytics platforms help you unlock the value of your data. You can turn raw information into actionable insights and share findings with your team.
Key Features of Analytics Platforms
When you choose a self service analytics platform, you should look for features that support independent analysis and secure collaboration. Top-rated self-service analytics platforms offer a range of capabilities. You can see how these features compare across popular tools in the table below:
| Product | Core Features & Security | User Experience & Quality ★ | Value Proposition 💰 | Target Audience 👥 | Unique Selling Points ✨ |
|---|---|---|---|---|---|
| Querio | AI natural language querying, SOC 2, embedded | Fast insights in seconds, context-aware, reliable | Contact for pricing | Cross-functional teams, product teams | Embedded analytics SDK, privacy-focused AI, centralized knowledge base |
| Microsoft Power BI | MS 365 integration, AI features, row-level sec | Strong community, broad learning resources ★★★★ | Affordable, scalable pricing | MS 365/Azure users, enterprises | Deep MS ecosystem integration, certified visuals marketplace |
| Tableau | Role-based licenses, rich visuals, data prep | Mature visual exploration, steep learning curve | Premium pricing, costly at scale | Enterprises, analysts | Tableau Prep, Pulse alerts, large connector gallery |
| Qlik Cloud Analytics | Associative engine, GenAI insights, reporting | Scalable, powerful for complex data ★★★★ | Capacity-based flexible pricing | Enterprises with multi-source data | GenAI-assisted insights, predictive analytics add-ons |
| Google Cloud Looker & Studio Pro | Governed semantic model, self-service explore | Good governance, cloud-native, onboarding ease | Quote-based, complex pricing | Google Cloud users, enterprises | LookML semantic model, free Studio onboarding |
| Amazon QuickSight | Serverless, ML anomaly detection, flexible pricing | Fast queries, AWS integration ★★★ | Per-user & capacity, add-ons extra | AWS customers | SPICE acceleration, generative BI features |
| ThoughtSpot | AI search, cloud data integrations, embedded | User-friendly, AI-driven insights ★★★★ | Variable pricing, consumption-based | Business users, embedded analytics | Natural language search, automated insights |
| Zoho Analytics | Drag-drop, AI assistant, blending, alerts | Affordable, suitable for SMB ★★★ | Competitive pricing, free tier | SMBs, cost-conscious users | "Ask Zia" AI, white-label & embedded options |
| Domo | End-to-end ETL, governance, mobile, embedded | Rapid deployment, scalable, consumption pricing | Quote-based, trial available | Enterprises needing fast scale | Consumption-based pricing, prebuilt apps |
| Sisense | Embed via APIs/SDK, multi-tenant, OEM-ready | Developer-friendly, extended marketplace | Quote-based, embedding focus | Product teams embedding analytics | Strong embedded BI, multi-tenant security |
You will find several common features in leading self-service analytics platforms:
- Associative data modeling lets you connect and analyze data from different sources.
- Real-time monitoring helps you track key metrics and respond quickly.
- Connectivity with cloud data sources ensures you can access information wherever it resides.
- AI capabilities support advanced analytics and predictive modeling.
- Flexible deployment options allow you to use the platform on-premises or in the cloud.
- Predictive analytics help you forecast trends and make proactive decisions.
Self service analytics platforms also provide strong security. You can control access to sensitive data and set permissions for different users. You can collaborate with your team and share dashboards securely.
Note: The right analytics platform should match your business needs. Look for tools that offer scalability, ease of use, and robust data governance.
FineBI Overview
FineBI is a leading self service analytics platform designed for business users and analysts. You can use FineBI to connect to a wide range of data sources, including databases, cloud warehouses, and big data platforms. You can prepare and process data with visual tools, create interactive dashboards, and share insights across your organization.
FineBI stands out because it combines agility with enterprise-grade governance. You get a zero-code interface, so you do not need technical expertise to build dashboards or analyze data. You can drag and drop components, apply filters, and customize layouts. FineBI supports real-time analytics, so you can make decisions based on the latest information.
You can use FineBI to:
- Integrate data from multiple sources for unified analysis.
- Build self-service data sets with joins, formulas, and filters.
- Create dashboards with rich visualization options.
- Collaborate with your team and manage data permissions.
- Monitor usage and ensure compliance with audit trails.
FineBI empowers you to explore data independently. You can track KPIs, identify trends, and predict outcomes. You can share findings with your team and drive data-driven decisions. FineBI supports large-scale deployments and high-performance analytics, making it suitable for organizations of any size.
Tip: FineBI helps you reduce time-to-insight and improve efficiency. You can focus on analysis and decision-making, not on technical barriers.
FineBI’s unique value lies in its user-friendly approach and powerful features. You can achieve self-service analytics at scale, with secure collaboration and advanced analytics capabilities.
How Self Service Analytics Platform Works
A self service analytics platform transforms how you interact with data. You gain the ability to connect, prepare, analyze, and share information independently. This section explains the core workflow stages of a self service analytics platform, using FineBI as a practical example. You will see how integration with multiple data sources, visual exploration, collaboration, and governance come together to support data-driven decisions.
Data Integration and Preparation
You start your analytics journey by connecting your self service analytics platform to various data sources. Most organizations work with a mix of databases, cloud warehouses, spreadsheets, and SaaS applications. FineBI, as a leading analytics platform, supports integration with multiple data sources, making it easy for you to unify information from across your business.
Common data sources you can integrate:
- Databases
- Cloud warehouses
- Spreadsheets
- SaaS applications
Once you connect your data, you need to prepare it for analysis. This step ensures your analytics results are accurate and reliable. Best practices for preparing data in a self service analytics platform include cleaning, validating, and standardizing information. You should remove duplicates, fix inconsistencies, and format data correctly. Training power users to spot and flag data issues helps maintain high-quality analytics.
| Best Practice | Description |
|---|---|
| Clean Data | Ensure data is free from duplicates and inconsistencies to maximize insight accuracy. |
| Data Readiness | Prepare data to be accurate, complete, and formatted correctly for analysis. |
| Organizational Standards | Establish standards for data formatting and ingestion to maintain consistency across the organization. |
You should always validate your data sources for accuracy and completeness. Consistent, clean data forms the foundation for effective self-service analytics. Organizations also need to implement security measures to protect sensitive data, following compliance regulations and setting access levels based on user roles.
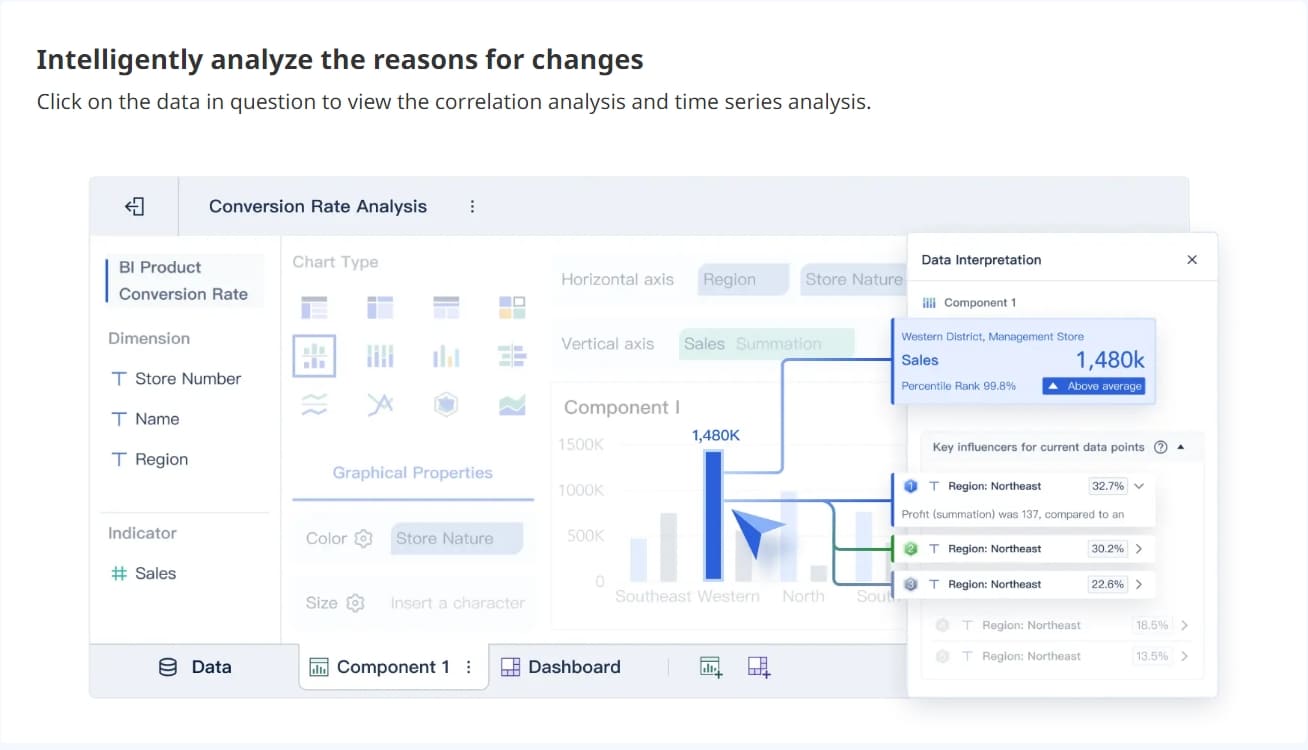
Visual Exploration and Dashboard Creation
After preparing your data, you move to visual exploration. A self service analytics platform gives you user-friendly interfaces that make analytics accessible to everyone. You can interact with your data in real time, uncover trends, and answer business questions without technical barriers.
Key features that support visual exploration and dashboard creation include:
- Intuitive interfaces that simplify data interaction for non-technical users
- Real-time access to the latest data, enabling timely insights
- Drag-and-drop functionality for easy dashboard creation
- AI-driven insights that help you discover deeper trends
- Natural language querying, so you can ask questions in everyday language
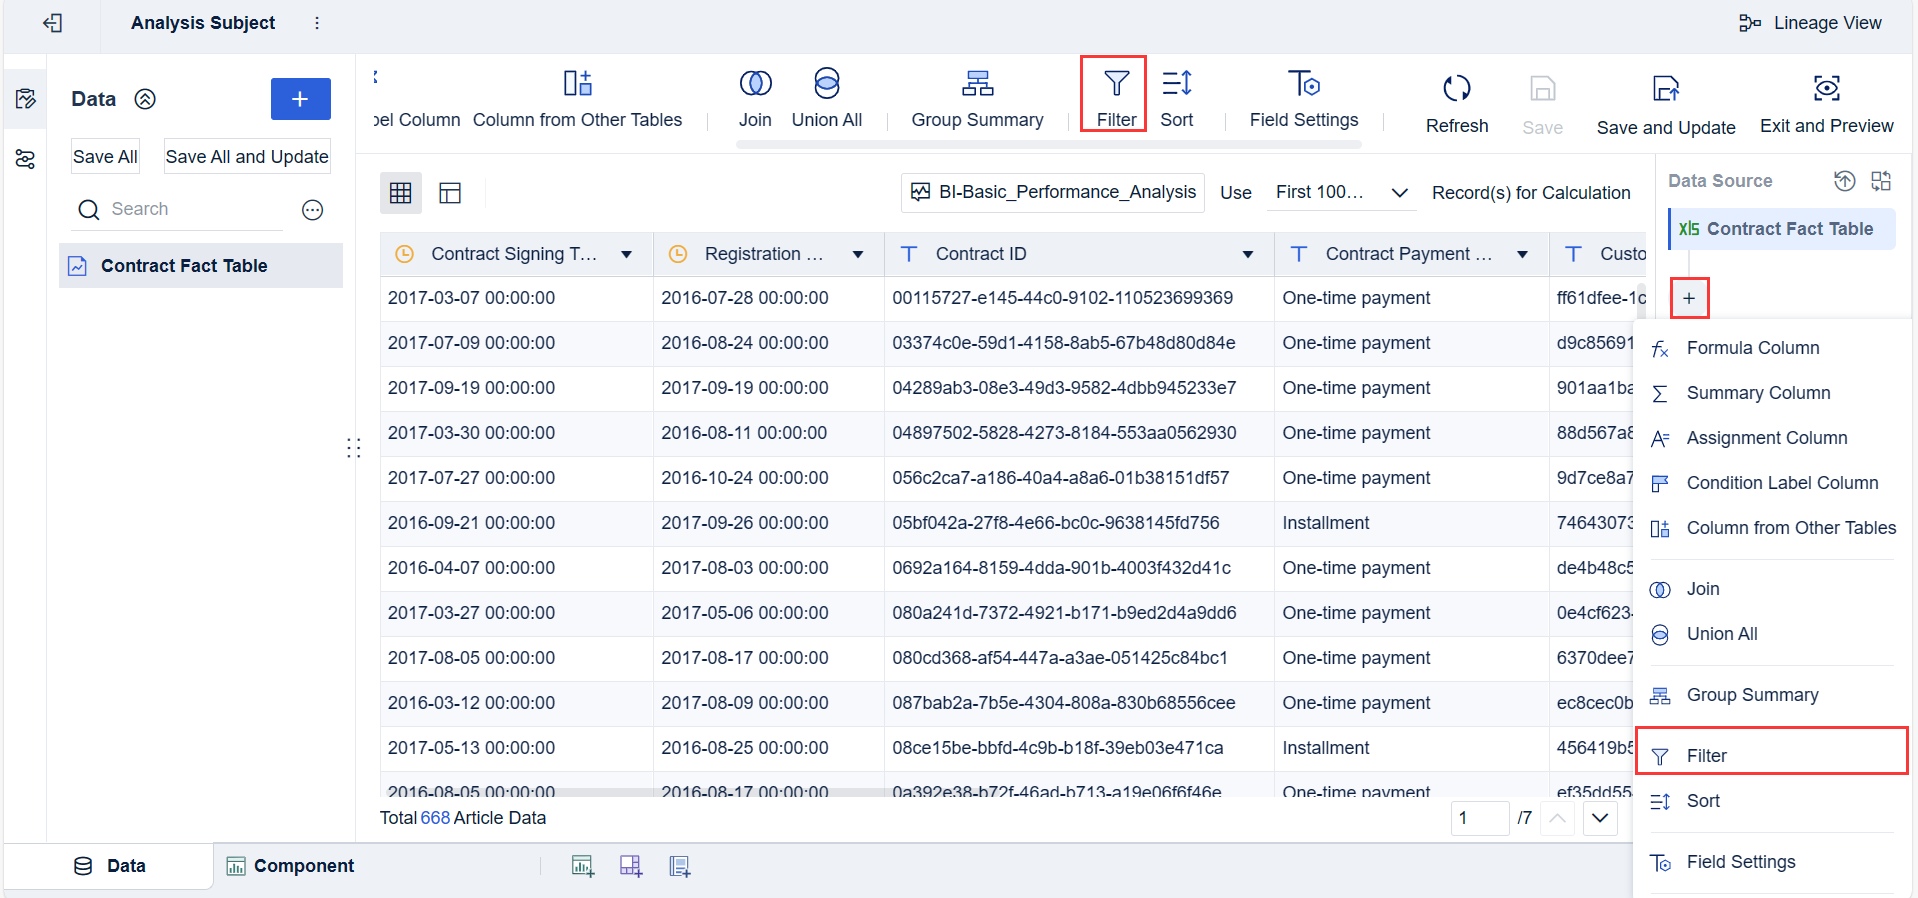
With FineBI, you can build customizable dashboards by dragging and dropping charts, tables, and other components. You can apply filters, adjust layouts, and create visualizations that match your business needs. This self-service functionality empowers you to create dashboards quickly, without waiting for IT support. You can also save templates for future use, making it easier to maintain consistency across your analytics projects.
Collaboration and Governance
A self service analytics platform does more than just help you analyze data. It also enables collaboration and ensures secure data sharing. When you use self-service analytics, you can share dashboards, reports, and insights with colleagues across departments. This cross-team collaboration aligns everyone around the same data, breaking down silos and supporting unified, data-driven decisions.
| Evidence | Description |
|---|---|
| Collaboration and sharing | Built for cross-department collaboration, these tools allow users to easily share insights, reports, and dashboards with colleagues, aligning teams around data-driven decisions. |
| More cross-team collaboration | With an entire organization under the umbrella of a single self-service analytics platform, diverse teams can work together within the same environment. A centralized data workspace keeps all personnel on the same page, aligning priorities and removing data siloes that act as barriers to effective collaboration. |
| Enhanced collaboration | With everyone accessing the same data and working within a unified platform, collaboration improves, driving better business outcomes. |
Governance is essential for secure analytics. A self service analytics platform includes features like role-based permissions, audit trails, and compliance controls. FineBI, for example, lets you assign permissions based on roles or departments. You can mask sensitive data for specific users and monitor all activity for compliance. The platform supports secure sharing through hardware address binding, VPN, single sign-on, and password protection.
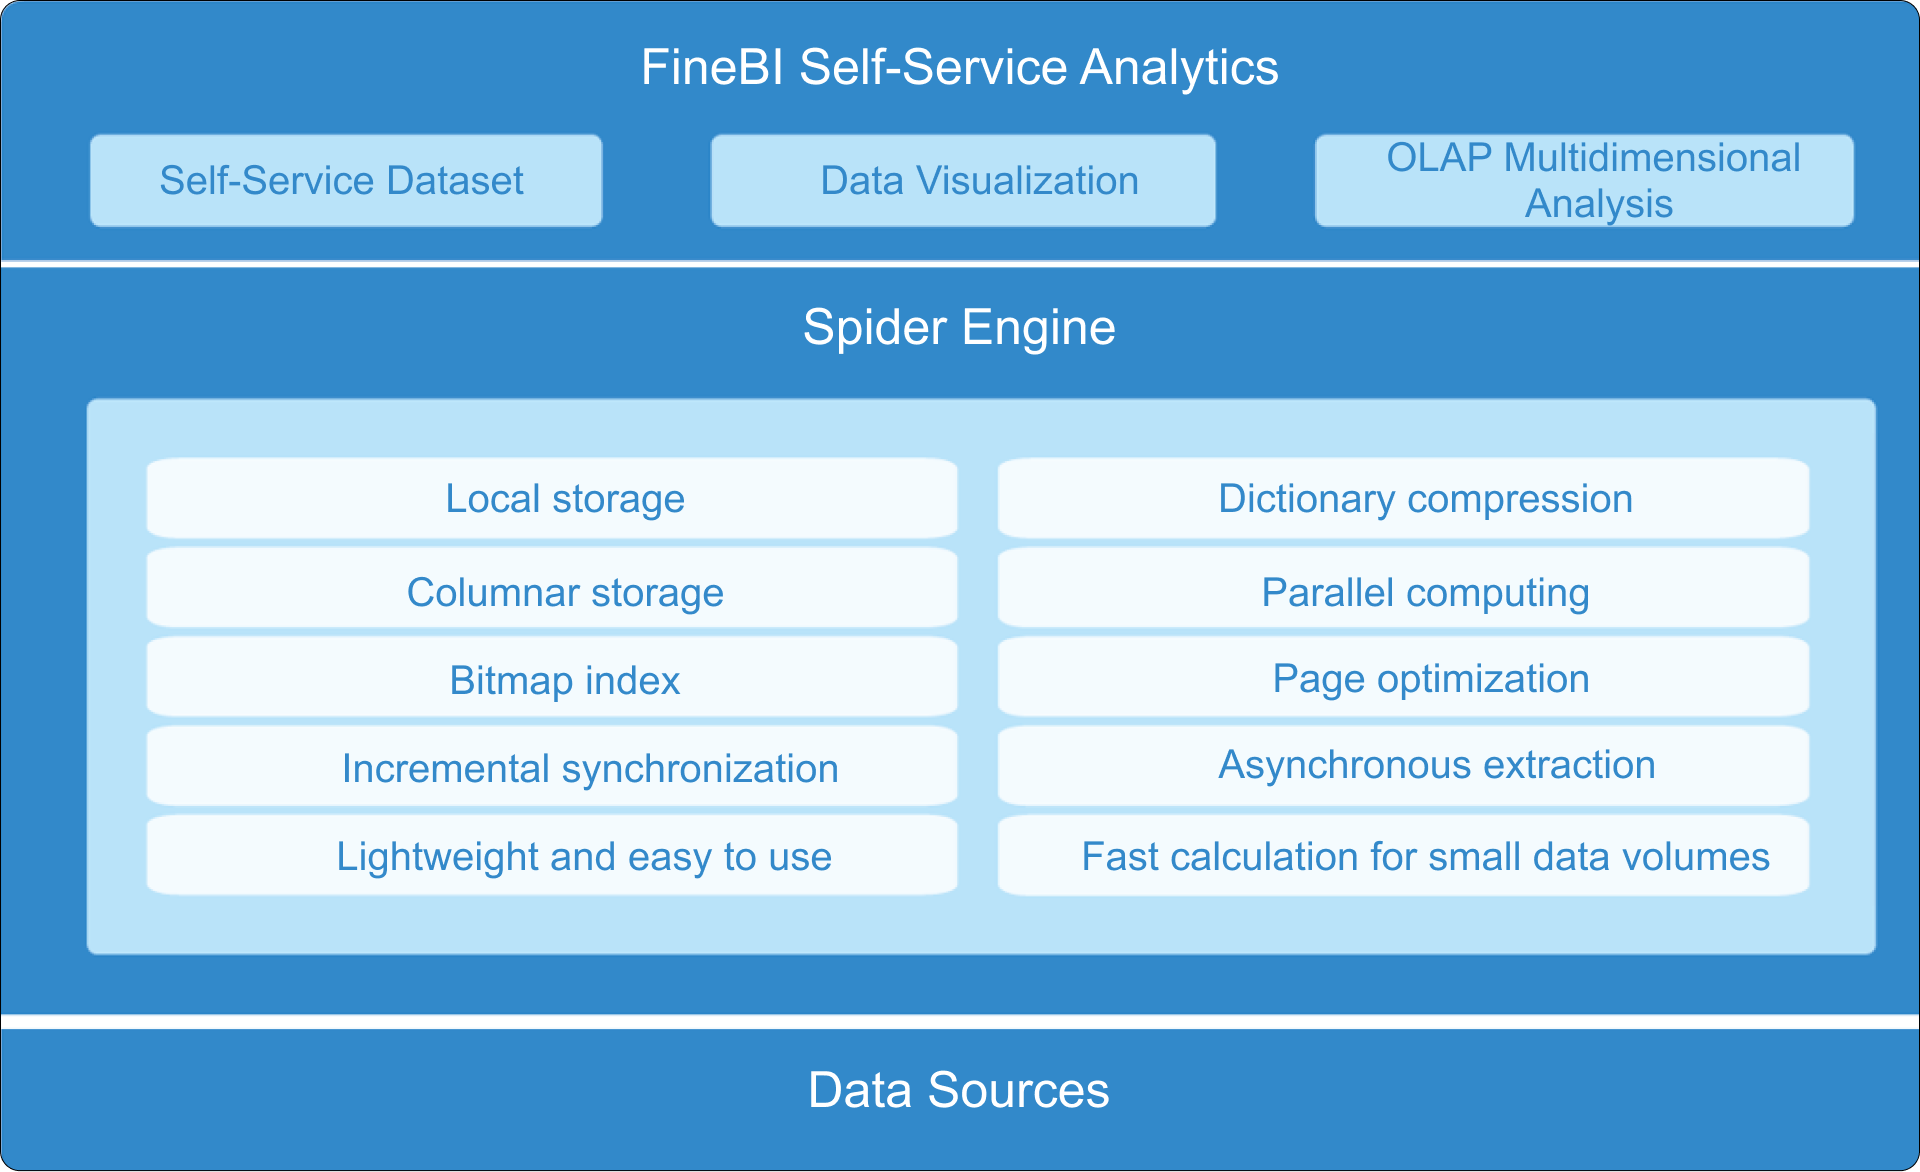
| Key Components | Description |
|---|---|
| Data Model | 3NF Model with domains and dimensions details. |
| Metadata | Includes governance domains, data products, data assets, glossary terms, subscription requests, data quality rules, dimensions, data quality facts, and data health actions. |
| Benefits | Empowers data practitioners, provides flexibility and efficiency, enhances agility, and is cost-effective. |
FineBI Workflow
FineBI structures the analytics workflow into four clear stages. You can follow these steps to move from raw data to published dashboards:
- Data Integration: Connect to your data sources, including databases, cloud warehouses, and files. Schedule updates to keep your analytics current.
- Data Processing: Build datasets by joining tables, adding formulas, and defining hierarchies. Clean and refine your data to ensure accuracy.
- Visual Exploration: Use drag-and-drop tools to create dashboards. Apply filters, customize layouts, and save reusable templates. FineBI supports ai-driven insights and natural language queries, making analytics even more accessible.
- Publishing & Governance: Share dashboards securely with your team. FineBI lets you apply for publication, get admin approval, and publish resources to specific directories. You can control who views each dashboard and monitor usage for compliance.
Typical workflow steps in FineBI:
- Users apply for publication.
- Admin approves the application.
- Resources are published to the corresponding directory.
- Users with viewing permission can access the published resources.
- The same resource can be published to multiple directory nodes.
FineBI supports subject collaboration, data sharing, and dashboard sharing. You can integrate self-service datasets, components, and dashboards into subjects for collaborative sharing. The permission system covers dashboards, platform management, templates, and data connections. You can allocate permissions to individuals or departments, ensuring only authorized users access sensitive information.
FineBI’s workflow ensures that you can move from data integration to actionable analytics quickly and securely. You gain the flexibility to create, explore, and share insights, all within a governed environment. This approach helps you make data-driven decisions with confidence, using a self service analytics platform that adapts to your business needs.
Tip: A self service analytics platform like FineBI empowers you to take control of your analytics journey. You can connect to any data source, build customizable dashboards, and collaborate securely—all without needing advanced technical skills.
Benefits and Challenges of Self Service Analytics Platform
Empowering Business Users
A self service analytics platform gives you the ability to answer business questions quickly and independently. You can use self service analytics to filter, sort, and visualize data without waiting for IT support. These platforms foster collaboration across departments and eliminate data silos, making cross-functional decision-making easier. You gain access to user-friendly interfaces, so everyone in your organization can make data-driven decisions, regardless of their technical expertise.
- You can handle routine data requests on your own.
- You can create dashboards tailored to your needs.
- You can combine insights from different departments.
Improving Efficiency and Decision-Making
Self service analytics improves reporting efficiency and accuracy. You can generate or update reports quickly, reducing delays. When you use self-service analytics, you minimize errors because you work directly with the data you know best. The analytics platform increases productivity and reduces the burden on IT teams, allowing them to focus on strategic tasks. You get faster access to data, which leads to quicker decision-making.
| Benefit | Impact on Efficiency |
|---|---|
| Increased productivity | More employees can analyze data, leading to faster insights. |
| Reduced IT burdens | IT teams can focus on strategic tasks rather than routine requests. |
| Enhanced decision-making speed | Faster access to data leads to quicker decision-making. |
| Improved data accessibility | More users can access and analyze data independently. |
Addressing Data Governance and Security
You need to ensure that your analytics platform protects sensitive information. Self-service bi tools like FineBI use role-based access controls to restrict data to authorized users. You can define who manages and accesses data, maintain strict data quality standards, and educate users about governance policies. Regular policy reviews help you adapt to changing business needs and risks.
| Governance Practice | Purpose |
|---|---|
| Data ownership | Defines responsibility for data management. |
| Role-based access controls | Ensures only authorized users access sensitive data. |
| Data quality rules | Maintains accuracy and reliability of analytics. |
| User education | Empowers users to follow governance practices. |
| Regular policy reviews | Updates frameworks to meet new security needs. |
Overcoming Adoption Barriers
You may face challenges when adopting self service analytics. Common issues include user resistance, lack of confidence in data skills, dashboard confusion, cost management, and balancing security with accessibility. You can overcome these barriers by using strategies such as user surveys, focus groups, and usage analytics. Support ticket analysis and stakeholder interviews help you identify and resolve problems. Define clear goals, create a phased plan, and prioritize quick wins to show the value of self-service tools.
Tip: Place quick wins first and address critical issues to demonstrate the usefulness of self service analytics.
Choosing the Right Self Service Analytics Platform
Essential Features to Consider
When you select a self service analytics platform, you should focus on features that support independent analysis and secure collaboration. You need user-friendly interfaces that make analytics accessible to everyone. Data preparation tools help you clean and organize information before analysis. Customizable visualizations allow you to create dashboards that fit your business needs. Secure sharing options and governance controls protect sensitive data and ensure compliance. Mobile access lets you view analytics on any device. Built-in help resources guide you through the platform. Scalability ensures the platform grows with your business. Integration capabilities allow you to connect to multiple data sources.
- User-friendly interfaces
- Data preparation tools
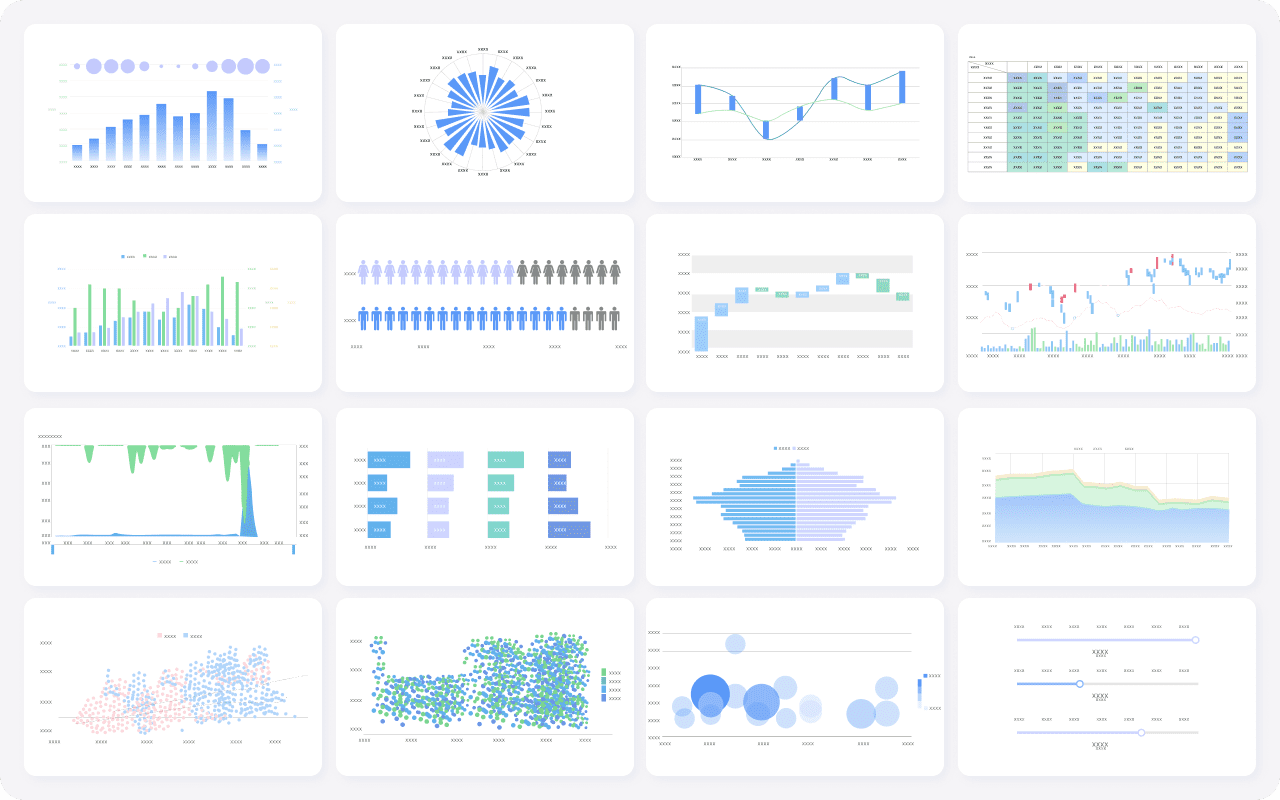
- Customizable visualizations
- Secure sharing options
- Governance controls
- Mobile access
- Built-in help resources
- Scalability
- Integration capabilities
You should also consider ease of use, security, customization options, and integrations when evaluating self-service bi tools.
FineBI vs. Alternatives
You want an analytics platform that balances usability and scalability. FineBI stands out with its drag-and-drop interface, making complex visualizations easy to build. The platform uses in-memory computing to handle large data volumes. FineBI grows with your business, supporting both small and large organizations. Other platforms may vary in scalability and usability, depending on their design.
| Feature | FineBI | Other Platforms |
|---|---|---|
| Scalability | Grows with business needs, suitable for SMBs | Varies by platform |
| Usability | Drag-and-drop GUI for complex visualizations | Depends on platform design |
| Data Management | In-memory computing for large data volumes | Varies by platform |
FineBI offers strong data management and supports real-time analytics. You can create dashboards quickly and share insights securely.
Industry Use Cases
Self service analytics platforms drive results across industries. In healthcare, professionals use analytics to access and analyze patient data, improving diagnosis and treatment. Marketers analyze user behavior to identify trends and optimize user experience. Manufacturing teams use predictive maintenance to forecast machinery failures and reduce downtime. Finance professionals integrate data to overcome silos and make timely decisions.
| Industry | Use Case Description |
|---|---|
| Healthcare | Access and analyze patient data quickly, improving diagnosis and treatment outcomes. |
| Marketing | Analyze user behavior to identify trends and optimize user experience rapidly. |
| Manufacturing | Use predictive maintenance to forecast machinery failures and minimize downtime. |
| Finance | Integrate data and prepare it for analysis, enabling timely financial decision-making. |
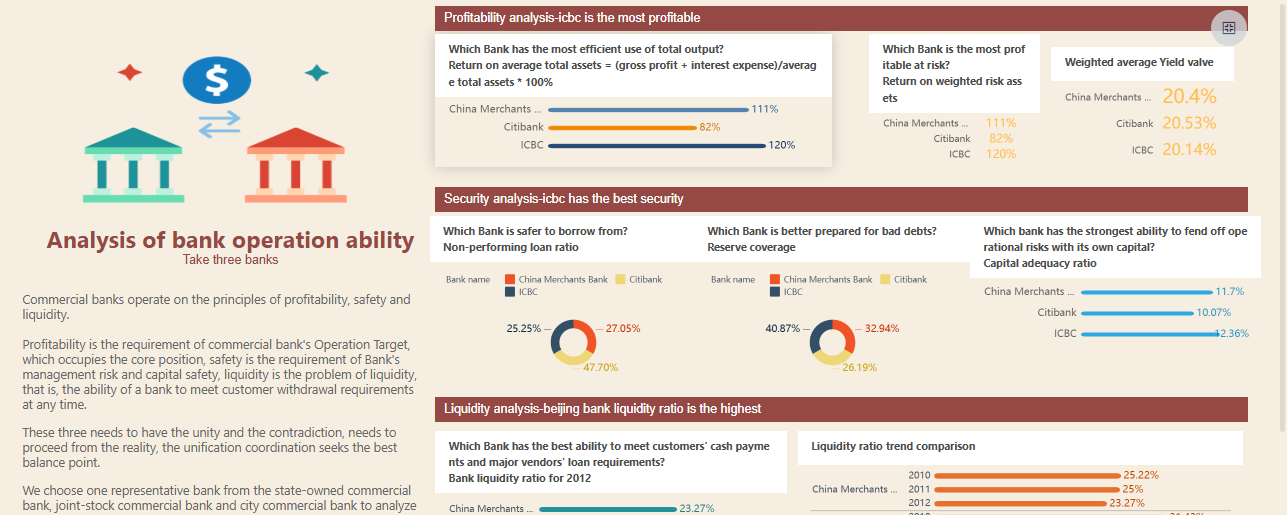
You can see how a self-serve bi solution like FineBI helps organizations in banking, such as Huaxia Bank, empower departments to analyze data independently and improve operational efficiency.
Best Practices for Self Service Analytics Platform Implimentation
User Training and Change Management
You need to invest in user training to unlock the full value of a self service analytics platform. Train both administrators and business users so everyone understands how to use the platform effectively. Offer a variety of resources, such as detailed guides, step-by-step video tutorials, and comprehensive FAQs. Make these resources easy to access so users can resolve questions independently. Analyze user behavior to identify where users struggle and tailor your training to address those areas. Create a checklist of training exercises to motivate users and help them track their progress. This approach builds confidence and encourages adoption across your organization.
Tip: Cultivate a data-driven culture by encouraging everyone to engage with analytics and share responsibility for data quality.
Aligning Analytics with Business Goals
You should align your data analytics approach with your company’s strategic objectives. Start by understanding your business goals. Identify key metrics and align KPIs with these goals to create a shared language between your data analytics team and business units. Choose the right analytical framework to generate actionable insights. Establish a feedback loop with stakeholders so you can refine your analytics based on their input. Communicate findings clearly to drive adoption and action. Measure and report the impact of analytics on business outcomes to demonstrate value.
Continuous Improvement
Continuous improvement ensures your self-service analytics platform remains valuable over time. Track usage, query performance, and the impact of analytics on decision-making. Set governance policies, such as query limits and performance standards, to balance user autonomy with system stability. Manage dashboards and visualizations throughout their lifecycle, from creation to retirement, to keep your analytics platform efficient and relevant. Regularly review and update your processes to adapt to changing business needs and maintain real-time data access.
Note: By following these best practices, you maximize the value of your analytics platform and empower your organization to make data-driven decisions with confidence.
Self service analytics platforms help you reduce barriers to data and foster a data-driven culture. You gain a single source of truth, which improves collaboration and accuracy. FineBI stands out by empowering you to create and share analytics independently, freeing up technical resources for high-value projects.
A unified analytics platform lets you trust and act on insights that matter most, while strong governance protects sensitive information.
Evaluate your analytics needs and consider FineBI for scalable, secure, and user-friendly analytics that drive data-driven decisions.

Continue Reading About Self Service Analytics Platform
How to Do Retention Analysis for Business Success
What is Pareto Chart and How Does it Work
How DuPont Analysis Helps You Understand Your Business


FAQ

The Author
Lewis
Senior Data Analyst at FanRuan
Related Articles

What Recruiters Look for in a Data Analysis Portfolio: 10 Criteria to Score Yours Fast
A $1 is not judged like a school assignment. It is judged like a hiring shortcut. Recruiters, hiring managers, and analytics leads use it to answer one question fast: Can this person solve business problems with data in
Lewis Chou
May 29, 2026

What Is Data Analytics Consulting? Beginner’s Guide to Services, Deliverables, and Business Value
$1 helps organizations turn raw data into decisions they can trust. For many business leaders, the challenge is not a lack of data. It is a lack of clarity. Reports conflict, teams track different KPIs, dashboards are un
Lewis Chou
Jun 03, 2026

Data Analyst Job Description [+2026 Guide]: Compare Responsibilities, Skills, and Salary by Industry
A strong $1 does more than list tasks. It defines how a company turns raw data into business decisions, which teams the analyst supports, and what measurable outcomes the role is expected to influence. For employers, tha
Lewis Chou
Jun 02, 2026