You need powerful market research data analysis tools to unlock valuable insights. Top choices include FineBI, Tableau, Qualtrics, SurveyMonkey Analyze, Google Analytics, Domo, Power BI, Brandwatch, Meltwater, and Talkwalker. High-quality tools let you make better decisions, understand market trends, and minimize risks. Below, you can see how adoption rates are rising:
| Statistic | Value |
|---|---|
| Participation rate of companies using analytics | 80% |
| Percentage of data & analytics leaders involved | 72% |
| Global data analytics market value in 2025 | $64.75 billion |
| CAGR of the data analytics market | 29.40% |
| Percentage of organizations adopting AI technologies | 65% |
Review each tool carefully and match features with your business goals for the best results.
Top Market Research Data Analysis Tools
Market research data analysis tools help you collect, process, and interpret information to make informed business decisions. These tools allow you to analyze large volumes of data, identify patterns, and generate actionable insights. When you use market research data analysis tools, you can better understand your target audience, track market trends, and improve your strategies.
You need market research data analysis tools to turn raw data into meaningful responses. These tools support survey market research tools, marketing analytics tools, and data visualization tools. They help you organize survey responses, visualize results, and share findings with your team. The right tool can transform your approach to market research and give you a competitive edge.
FineBI Overview and Key Features

FineBI stands out among market research data analysis tools for its robust workflow and integration capabilities. You can connect FineBI to over 100 data sources, including databases, cloud platforms, and APIs. This flexibility ensures you can bring all your data together for unified analysis. FineBI’s workflow covers data integration, processing, visual exploration, and secure publishing.

| Feature/Advantage | Description |
|---|---|
| Integration with Data Sources | Connects to over 100 data sources for seamless integration. |
| Predictive Analytics | AI-driven predictive analytics for trend forecasting. |
| Role-based Access Control | Secure data sharing through role-based access. |
| Customizable Dashboards | Interactive visualizations tailored to user needs. |
| Real-time Data Updates | Provides instant insights with real-time updates. |
| Self-service Analytics | Empowers non-technical users with self-service options. |
| Scalability | Designed to handle large datasets and complex KPIs. |
FineBI empowers you to create dashboards with a drag-and-drop interface. You can explore data visually, apply filters, and save templates for future use. The platform supports real-time data updates, so your insights stay current. FineBI’s self-service analytics let you analyze data without relying on IT, making it ideal for business users. You can also set role-based permissions to control access and protect sensitive information. FineBI’s scalability ensures you can manage complex KPIs and large datasets as your business grows.
Tableau
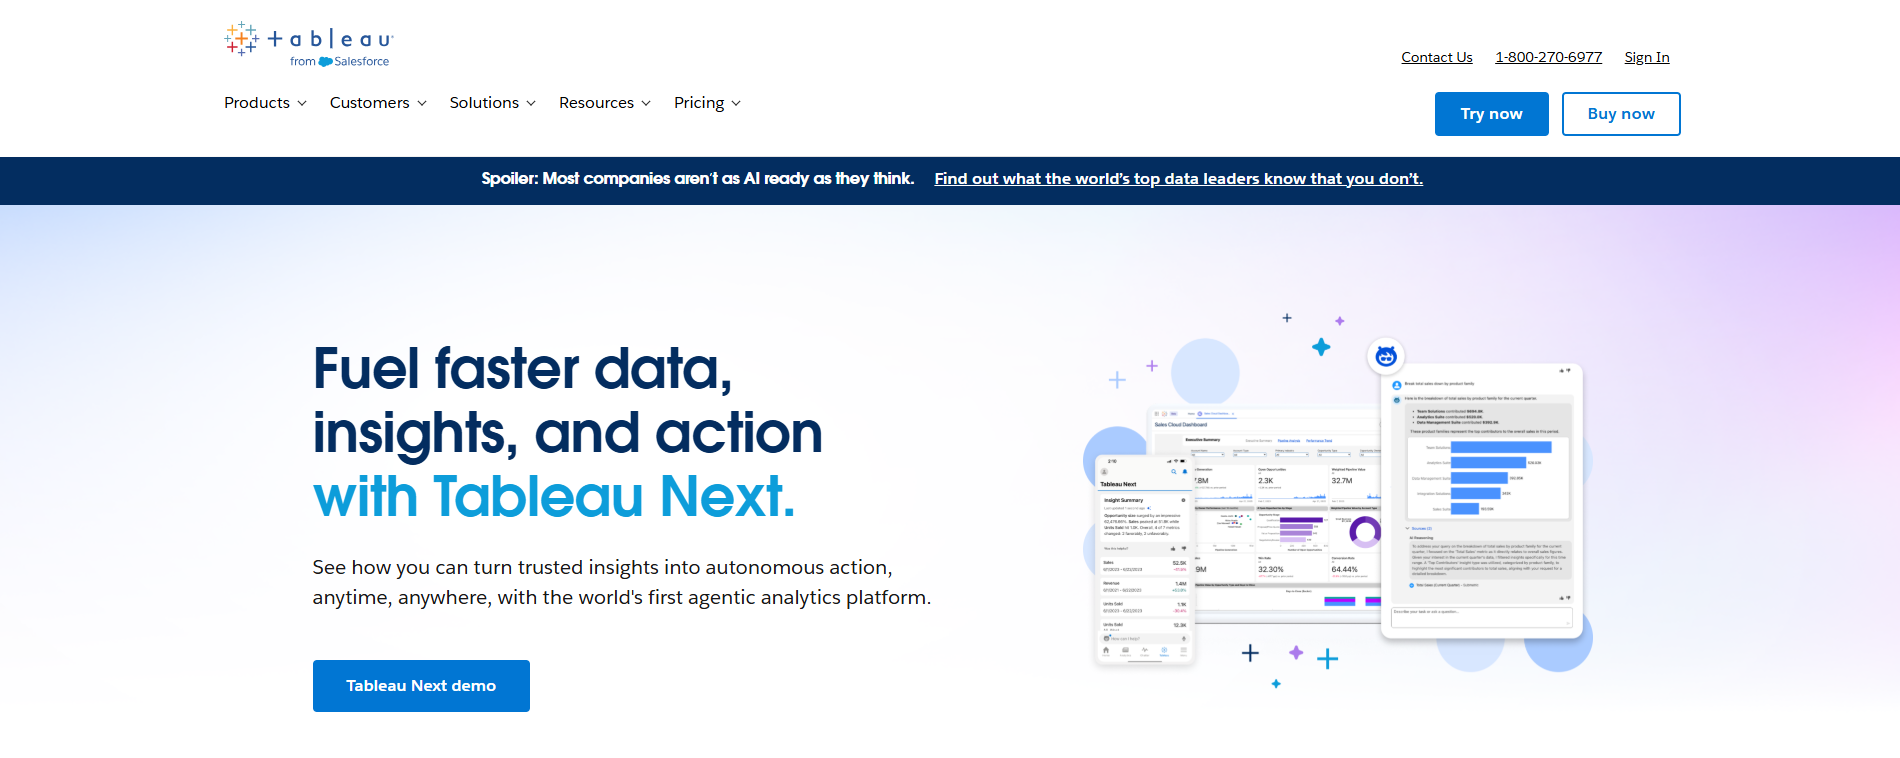
Tableau is a leading name in market research data analysis tools. You can use Tableau to import data from Excel, CSV, and many databases. The platform offers strong data visualization and analytics features, making it easy to create interactive dashboards.
| Feature | User Comment |
|---|---|
| Data Importing | Data importing is simple by using Excel or CSV. Plotting is scalable. |
| Integration | Integration part was a bit difficult and required effort. |
| Visualization | Tableau supports most databases and offers a wide range of analytics needs. |
| Complexity | Mastering robust features can be challenging for less tech-savvy users. |
| Viewer License | Viewer license is less useful unless you have many analysts. |
| Report Refresh | No automatic report refresh; manual updates needed. |
| Customization | Some users find customization options limited. |
| Formatting | Formatting is limited; drag-and-drop is missing in some areas. |
| Add-ons | Some add-on products seem incomplete. |
| Data Integration | Seamless connection to multiple data sources. |
Tableau’s strengths include its user-friendly interface and powerful data visualization capabilities. You can create interactive reports and dashboards to share with your team. However, you may find the learning curve steep if you are new to analytics. Tableau is best for organizations with experienced analysts who need advanced visualization and reporting features.
Qualtrics
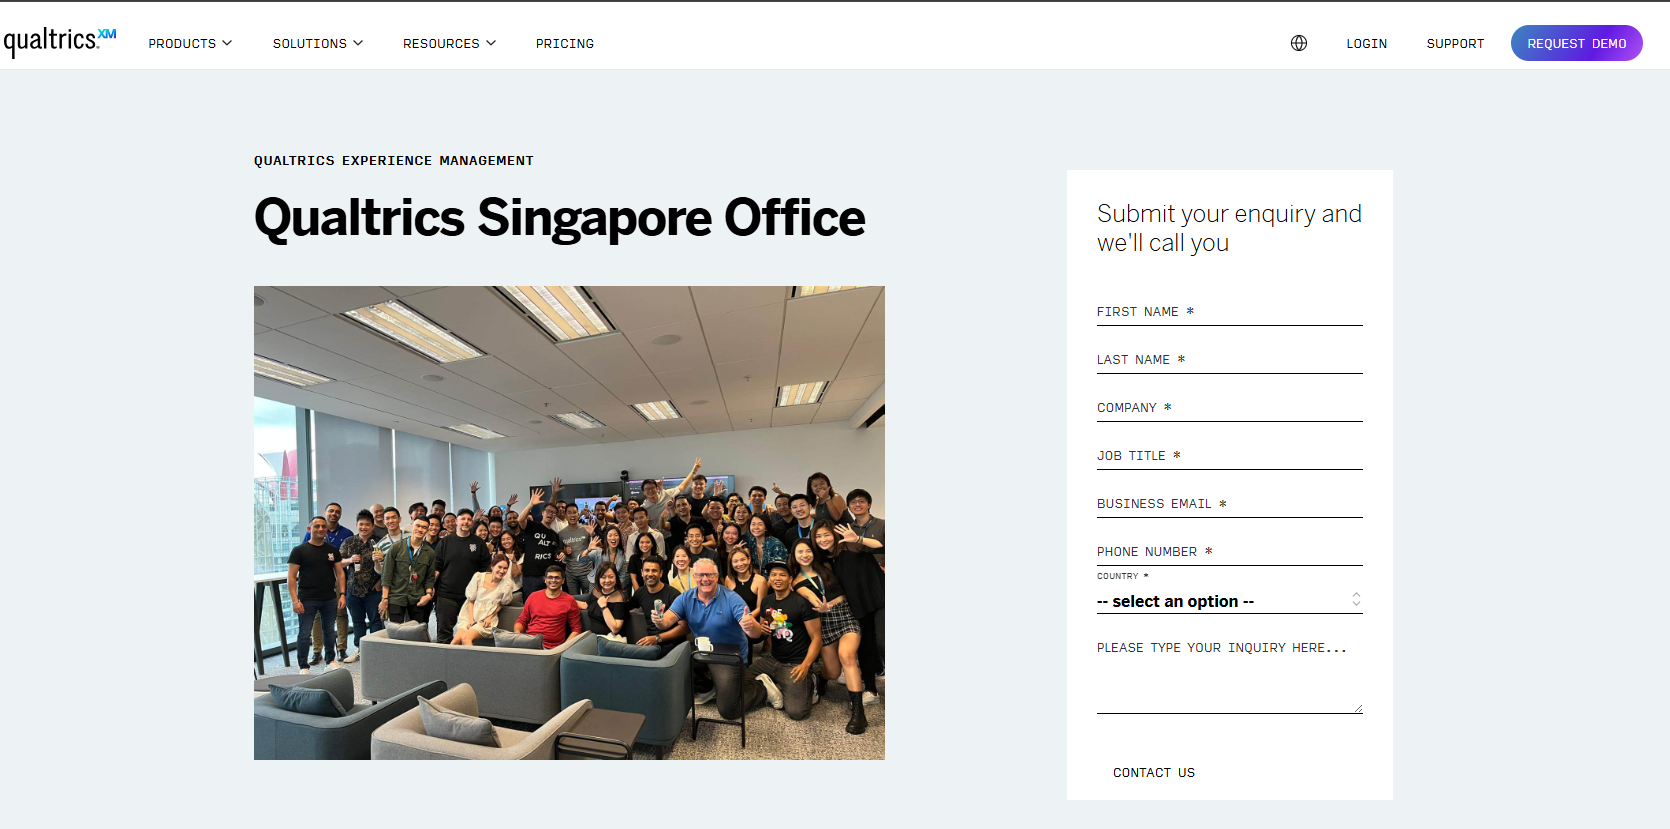
Qualtrics is a comprehensive platform among market research tools, especially for survey research and advanced analytics. You can use Qualtrics to design surveys, collect responses, and analyze data with AI-powered insights.
| Functionality | Description |
|---|---|
| Comprehensive platform | Integrates various functionalities for data collection and analysis. |
| AI and automation | Streamlines research and improves data quality. |
| ExpertReview | Detects and removes quality gaps in surveys. |
| Problem detection | Flags issues like broken logic and methodology errors. |
| Quality response management | Removes poor quality responses with a single click. |
Qualtrics helps you identify market trends and consumer behaviors. The platform accelerates insights that drive business impact and supports product development with continuous customer feedback. You can track and analyze trends in real time, making it easier to stay ahead of competitors. Qualtrics is ideal if you need a flexible, AI-driven solution for survey market research tools and advanced analytics.
SurveyMonkey Analyze
SurveyMonkey Analyze is a popular choice for collecting and analyzing survey responses. You can use its clean interface to create surveys, add questions, and customize themes. The platform offers a variety of data reporting tools and AI integration for data collection and analysis.
| Strengths | Limitations |
|---|---|
| Wide variety of data reporting tools | Basic reporting features |
| AI integration for data collection/analysis | Complexity in analysis tools |
| Restricted data analysis flexibility | |
| Security risks with sensitive data |
SurveyMonkey offers a powerful analytics suite that rivals dedicated research tools, but users note that advanced features are locked behind higher pricing tiers and there is a steep learning curve for sophisticated analysis.
You can track live responses with real-time dashboards and use AI-powered features for text analysis and trend tracking. SurveyMonkey Analyze is best for businesses that need quick, straightforward survey analysis and reporting.
Google Analytics
Google Analytics is a staple among marketing analytics tools. You can use it to gain cross-platform insights, track user behavior, and measure campaign performance. The platform offers predictive analytics, customizable reporting, and enhanced cross-device tracking.
| Feature | Description |
|---|---|
| Cross-platform insights | Holistic view of user interactions across devices and touchpoints. |
| Predictive analytics | Anticipates user behavior for proactive marketing strategies. |
| Customizable reporting | Tailored insights into user behavior and demographics. |
| Enhanced cross-device tracking | Unified view of user interactions across multiple devices. |
| AI-powered insights | Surfaces meaningful patterns and trends for actionable recommendations. |
| Data privacy controls | Emphasizes user privacy and compliance with regulations. |
| Streamlined interface | Easy access and visualization of essential insights. |
| Customization flexibility | Set up and measure any custom event relevant to your needs. |
| Powerful integrations | Connects data from various sources for comprehensive reports and deeper insights. |
You can integrate Google Analytics with other market research tools to enhance your insights builder and improve user understanding. The platform helps you refine marketing efforts and drive business strategies based on real-time data.
Domo
Domo is a cloud-based platform that empowers you to make data-backed decisions. You can automate data collection, monitor real-time metrics, and use AI technologies for advanced analytics.
- Domo focuses on automation and real-time monitoring, which are crucial for timely insights.
- Companies see a high return on investment, with reports showing a return of $6.93 for every dollar invested.
- Domo helps turn data into a competitive advantage, fueling smarter and faster decisions.
- Real-time business intelligence enables you to adapt quickly to changing market conditions.
- Customizable dashboards and AI capabilities enhance quick decision-making and trend analysis.
Domo is ideal for organizations that need real-time insights and automation in their market research data analysis tools.
Power BI
Power BI is a versatile tool for market research data analysis tools. You can connect Power BI to various data sources, clean and model data, and create interactive dashboards.
| Feature | Description |
|---|---|
| Data Connectivity | Integration with various data sources, including applications and SQL databases. |
| Data Transformation and Modeling | Clean, group, and model data for comprehensive reporting. |
| Visualization Options | Numerous interactive and customizable visualizations, including charts and maps. |
| Real-Time Reporting | Supports real-time data collection for up-to-date dashboards. |
| NLP-Based Assistive Features | Natural language processing for data exploration and summarization. |
Power BI offers affordable and scalable pricing, with a user-friendly interface for business users. You can create customizable dashboards, use Q&A features for instant answers, and collaborate easily with your team. Power BI is best for organizations that want deep integration with Microsoft products and need flexible data visualization.
Brandwatch
Brandwatch is a leader in social media market research tools. You can use Brandwatch to track consumer sentiment, analyze emotions, and monitor content sources across blogs, forums, news, and social media.
| Capability | Description |
|---|---|
| Iris AI Technology | Real-time data processing and insights generation. |
| Comprehensive Data Integration | Integration of vast amounts of data from various sources for a holistic view of social media trends. |
Brandwatch provides real-time tracking of brand performance, refreshing daily. You can set up alert thresholds to monitor potential issues and turn them into strategic opportunities. The platform’s self-service dashboard allows you to optimize campaigns based on current data and identify gaps in your strategy.
Meltwater
Meltwater is a powerful tool for media monitoring and competitive analysis. You can use Meltwater to analyze user wants, needs, and behaviors, uncover audience influence, and track market trends.
| Feature/Capability | Description |
|---|---|
| Data Analysis | Provides insights into user wants, needs, and behaviors. |
| Social Listening | Uncovers audience influence across digital channels. |
| Competitive Monitoring | Tracks market trends and competitor activities. |
| Audience Insights | Offers in-depth insights into consumer behavior and engagement metrics. |
| Market Research | Identifies customer pain points and market gaps. |
| Trend Analysis | Predicts changing consumer behaviors and emerging market signals. |
Meltwater tracks keywords, aggregates content from global news sources and social media, and automates data collection into dashboards. You can analyze engagement, reach, and sentiment for your brand and competitors, saving time and gaining valuable insights.
Talkwalker

Talkwalker offers expansive coverage for brand monitoring and analytics. You can monitor over 150 million websites, including news, TV, radio, social media, blogs, and forums.
| Capability | Description |
|---|---|
| Expansive Coverage | Monitoring spans news sites, newspapers, magazines, TV, radio, and more in 187 languages. |
| AI-Powered Analysis | AI extracts actionable insights from text, image, and video content, including sentiment analysis and trends. |
| Custom Monitoring | Real-time alerts tailored to brand, product, or competitor mentions. |
| Reporting & Sharing | Customizable dashboards and coverage reports, with integration options for BI and marketing tools. |
Talkwalker enables you to track brand mentions, analyze sentiment, and use visual listening tools to identify brand presence in images and videos. The demographics dashboard helps you analyze consumer segments, and the AI query builder allows for comprehensive searches. Talkwalker is a strong choice if you need a 360-degree view of your brand and industry.
These top market research data analysis tools each offer unique features to help you collect, analyze, and act on responses. Whether you need advanced analytics, real-time insights, or powerful data visualization, you can find a tool that fits your business needs and target audience.
Why Market Research Data Analysis Tools Matter
Market research data analysis tools help you turn raw information into actionable insights. These tools allow you to collect, organize, and interpret data from surveys, social media, and customer feedback. When you use market research data analysis tools, you gain a clear understanding of your audience and market trends. You can make decisions based on facts, not guesses.
You need market research data analysis tools to improve the quality of your research. These tools support both quantitative and qualitative market research. They help you analyze large datasets and uncover patterns that might be missed with manual methods. You can also ensure data quality by using automated checks and real-time updates. This leads to more reliable results and better business outcomes.
Data-Driven Decision Making
Market research tools play a key role in driving business growth and giving you a competitive advantage. You can use these tools to understand customer needs and steer your business direction. Identifying market trends helps you stay ahead of competitors. Informing product development ensures new products match what customers want.
Market research tools help you spot potential roadblocks before they become problems. You get real-time data, which lets you pivot quickly when the market changes. Research-backed projections also build investor confidence.
Companies that use both structured and unstructured data can find regional opportunities that others may miss. You gain the ability to make faster, smarter decisions that move your business forward.
Enhancing Research Quality
You improve research quality when you use market research tools. These platforms let you automate data collection and analysis, reducing errors and saving time. You can run surveys, conduct interviews, and analyze feedback with greater accuracy. Automated tools also help you maintain high data quality by flagging inconsistencies and missing values.
| Industry | Company Example | Market Research Tools Used |
|---|---|---|
| Technology | Various | Usage analytics, user experience studies |
| Retail | Specialty Retail | Mystery shopping, price analysis, customer perception studies |
| Healthcare | Large Healthcare System | Post-visit surveys, focus groups, journey mapping studies |
You see better results when your research is thorough and reliable. High-quality data leads to insights that drive successful strategies.
Improving Customer Insights
Market research tools help you gain deeper consumer insights. You can track customer behavior, preferences, and satisfaction levels. These tools allow you to segment your audience and tailor your marketing efforts. Qualitative market research features, such as focus groups and interviews, reveal the motivations behind customer choices.
You can use dashboards and visualizations to share findings with your team. This makes it easier to act on insights and improve products or services. When you understand your customers, you build stronger relationships and increase loyalty.
Types of Market Research Data Analysis Tools
Market research data analysis tools help you answer business questions and track market trends. You use these tools to collect, organize, and interpret data from surveys, social media, and customer feedback. The right tool lets you turn raw information into actionable insights, improving your decision-making and strategy.
You find several categories of market research data analysis tools. Each category serves a unique purpose and fits different business needs. Some tools focus on gathering customer feedback, while others help you analyze competitor activity or visualize data. You choose the best tool based on your goals, such as new product improvements or target audience profiling.
| Category | Purpose |
|---|---|
| End-to-end platforms | Provide comprehensive research capabilities with advanced methodologies and AI analysis. |
| Survey tools | Gather customer feedback through direct surveys and interviews. |
| Social listening | Monitor social media for keywords and consumer sentiment. |
| Analytics | Offer insights into SEO, competitive research, and market trends. |
| Specialized research | Focus on specific research needs and methodologies. |
Survey Market Research Tools
Survey market research tools help you collect direct feedback from customers. You design surveys, distribute them, and analyze responses to understand preferences and opinions. These tools support interviews and questionnaires, making them essential for primary data collection. You use them to profile your target audience and refine your marketing strategy.
Marketing Analytics Tools
Marketing analytics tools let you track campaign performance and measure user behavior. You gain insights into SEO, website traffic, and competitive positioning. These tools help you monitor market trends and adjust your strategy based on real-time data. You use analytics to identify opportunities and optimize your marketing efforts.
Business Intelligence Platforms
Business intelligence platforms give you advanced analytics and data visualization capabilities. FineBI stands out in this category. You connect FineBI to over 100 data sources, unify information, and create interactive dashboards. The drag-and-drop interface and OLAP analysis make it easy for you to explore data. FineBI's high-performance engine processes large datasets and supports thousands of users. You use business intelligence platforms to build an insights builder and share findings across your organization.
AI-Driven Research Tools
AI-driven research tools use artificial intelligence to analyze large volumes of data quickly. You uncover patterns, predict trends, and automate reporting. These tools enhance data visualization and help you interpret complex information. You use AI-driven tools to improve accuracy and speed in your market research projects.
Choosing High-Quality Market Research Data Analysis Tools
When you select market research data analysis tools, you gain the ability to turn raw information into actionable insights. These tools help you collect, process, and interpret data from surveys, social media, and competitor research tools. You use market research data analysis tools to improve data quality, streamline your workflow, and reach your target audience more effectively.
High-quality market research data analysis tools allow you to analyze large datasets, visualize trends, and build an insights builder for your business. You need tools that support audience targeting, integrate with marketing analytics tools, and offer strong data visualization tools. The right market research software ensures data integrity and helps you make informed decisions.
Key Features to Evaluate
You should evaluate several criteria when choosing market research data analysis tools. The following table highlights important features and their descriptions:
| Criteria | Description |
|---|---|
| Access to high-quality data | Reliable, up-to-date information from various sources, including both quantitative and qualitative data. |
| Smart ways to analyze and visualize insights | Built-in analytics and visualization features to identify trends and opportunities. |
| Seamless integration with your workflow | Compatibility with existing systems like CRM and marketing platforms, along with collaboration features. |
| Strong security and compliance standards | Protection of sensitive data through encryption and compliance with regulations like GDPR and CCPA. |
| Scalability without unexpected costs | Flexible pricing and the ability to scale without hidden fees. |
| Easy to use with reliable support | Intuitive interface and responsive support options to assist users effectively. |
FineBI excels in these areas. You can connect to multiple data sources, analyze information with advanced analytics, and visualize results using interactive dashboards. FineBI’s enterprise governance features ensure data integrity and compliance.
Integration and Compatibility
Integration capabilities play a key role in the effectiveness of market research data analysis tools. You need tools that connect with your existing business systems and support seamless data flow. FineBI offers robust integration with databases, cloud platforms, and APIs, making it easy to unify information from different sources.
- Integration capabilities enhance workflow efficiency and support data-driven decision-making.
- Compatibility with CRM, marketing analytics tools, and competitor research tools improves collaboration and audience targeting.
Usability and Learning Curve
Usability determines how quickly your team can adopt market research data analysis tools. You want an intuitive interface and clear guidance for data processing. FineBI's self-service analytics and drag-and-drop dashboard creation make it accessible for business users. Reliable support and training resources help you maximize the value of your market research software.
- Easy-to-use tools allow team members to generate insights without technical expertise.
- A short learning curve increases productivity and encourages broader adoption.
Pricing and Scalability
Pricing and scalability affect your long-term success with market research data analysis tools. You should look for flexible pricing models and the ability to scale as your business grows. FineBI supports large datasets and thousands of users, ensuring you can expand your research without unexpected costs.
- Scalable tools handle large volumes of data and adapt to changing market conditions.
- Transparent pricing helps you manage budgets and avoid hidden fees.
Choosing high-quality market research data analysis tools gives you a competitive edge. You improve data quality, enhance audience targeting, and build effective data visualization tools for your business.
FineBI As Market Research Data Analysis Tools

FineBI demonstrates the power of market research data analysis tools by solving real business challenges. You use these tools to collect, process, and interpret information from multiple sources. Market research data analysis tools help you understand customer behavior, identify trends, and make informed decisions. When you apply FineBI, you gain access to advanced data analysis, real-time insights, and secure data sharing.
Enterprise Data Integration
You often face fragmented data across departments and platforms. FineBI addresses this issue by integrating data from over 100 sources, including databases, cloud services, and APIs. You can use data cleaning techniques to standardize and refine your information. This process ensures data integrity and supports accurate analysis. FineBI’s enterprise data integration lets you build a unified view of your business, making it easier to track KPIs and compare performance across teams.
Tip: Use FineBI’s integration features to connect survey design results, social listening tools, and competitive intelligence tools for a comprehensive market overview.
Self-Service Analytics for Business Users
FineBI empowers you to perform self-service analytics without relying on IT support. You can create interactive dashboards using drag-and-drop data visualization. The platform’s ai-driven analytics help you uncover patterns and predict future outcomes. You access real-time data, allowing you to respond quickly to market changes. FineBI's insights builder lets you explore data independently and share findings with your team.
- You save time by automating routine analysis.
- You improve collaboration with secure, role-based access.
- You boost productivity by focusing on actionable insights.
Customer Success Story: BOE
BOE Technology Group used FineBI to overcome challenges with data fragmentation and inconsistent metrics. You can learn from their experience. BOE built a data warehouse, standardized metric definitions, and created KPI dashboards. FineBI enabled cross-factory benchmarking and improved operational efficiency by 50%. The company reduced inventory costs by 5% and enhanced decision-making with real-time insights. FineBI helped BOE align analytics with business goals and support digital transformation.
FineBI’s market research data analysis tools deliver measurable results in diverse industries. You can achieve similar success by leveraging its integration, analytics, and visualization capabilities.
Best Practices for Using Market Research Data Analysis Tools
Market research data analysis tools help you collect, process, and interpret information from many sources. These tools turn raw data into useful insights that guide your business decisions. You use them to understand your customers, track trends, and improve your strategies.
When you use market research data analysis tools, you gain a clear view of your market. You can identify what your audience wants and how your competitors act. These tools support audience targeting, data visualization, and reporting. You can also combine them with competitor research tools to build a complete picture of your industry.
Setting Clear Objectives
Start every project by setting clear objectives. You need to know what questions you want to answer. Define your goals before you collect data. This step helps you choose the right tools and methods. For example, if you want to improve audience targeting, focus on tools that segment and analyze customer groups. Clear objectives keep your research focused and efficient.
Ensuring Data Quality
High-quality data leads to better results. Always check your data for errors or missing values. Use features like FineBI’s data cleaning and validation tools to ensure accuracy. Clean data supports reliable analysis and trustworthy insights. You should also update your data regularly to reflect current trends.
Tip: Schedule regular data reviews to catch issues early and maintain high standards.
Team Collaboration
Collaboration improves your research outcomes. Share dashboards and reports with your team using secure access controls. FineBI allows you to set permissions and work together on projects. When everyone can view and discuss results, you make better decisions. Teamwork also helps you spot trends and patterns that one person might miss.
Continuous Improvement
Market research data analysis tools work best when you review and refine your process. Use an insights builder to track what works and what does not. Update your methods as your business grows. Try new data visualization techniques to present findings more clearly. Continuous improvement keeps your research effective and your business competitive.
Choosing the right market research data analysis tools shapes your business success. You should match your needs with the best features and test options like FineBI. Start with a free trial, compare data visualization capabilities, and use an insights builder to explore results. Stay curious and keep learning about new technologies. This approach helps you adapt and grow in a changing market.

Continue Reading About Market Research Data Analysis Tools
How to Do Retention Analysis for Business Success
What is Pareto Chart and How Does it Work
How DuPont Analysis Helps You Understand Your Business


FAQ

The Author
Lewis
Senior Data Analyst at FanRuan
Related Articles

What Recruiters Look for in a Data Analysis Portfolio: 10 Criteria to Score Yours Fast
A $1 is not judged like a school assignment. It is judged like a hiring shortcut. Recruiters, hiring managers, and analytics leads use it to answer one question fast: Can this person solve business problems with data in
Lewis Chou
May 29, 2026

What Is Data Analytics Consulting? Beginner’s Guide to Services, Deliverables, and Business Value
$1 helps organizations turn raw data into decisions they can trust. For many business leaders, the challenge is not a lack of data. It is a lack of clarity. Reports conflict, teams track different KPIs, dashboards are un
Lewis Chou
Jun 03, 2026

Data Analyst Job Description [+2026 Guide]: Compare Responsibilities, Skills, and Salary by Industry
A strong $1 does more than list tasks. It defines how a company turns raw data into business decisions, which teams the analyst supports, and what measurable outcomes the role is expected to influence. For employers, tha
Lewis Chou
Jun 02, 2026