Data analysis and data analytics play essential roles in understanding and utilizing data. You use data analysis to examine past trends and uncover patterns. It helps you make sense of historical data by breaking it down into meaningful insights. On the other hand, data analytics focuses on predicting future outcomes and recommending actions. These fields often overlap, but their goals and methods differ. Recognizing the distinction between data analysis vs data analytics ensures you choose the right approach for your needs. Learn more about tools like FineBI and FineReport to enhance your data journey.

Key Takeaways on Data Analysis vs Data Analytics
- Purpose & Focus: Data analysis examines past data to uncover trends and patterns, helping you understand what happened. Data analytics predicts future outcomes and suggests actions to guide planning.
Methods & Tools: Data analysis uses simpler techniques to study current data, while data analytics employs advanced methods like machine learning. Tools like FineBI and FineDataLink simplify both tasks.
Applications & Choice: Both are vital in fields like healthcare, finance, and marketing. Knowing their differences helps you choose the right approach for smarter decisions.
Understanding Data Analysis vs Data Analytics
What Is Data Analysis?
Data analysis involves examining historical data to uncover patterns, trends, and insights. You use it to understand what has happened in the past and why. This process often includes descriptive and diagnostic analysis. Descriptive analysis summarizes historical data, helping you identify key trends. Diagnostic analysis, on the other hand, digs deeper to determine the causes behind specific outcomes.
For example, in healthcare, data analysis can help identify patterns in patient recovery rates. Tools like FineBI simplify this process by offering intuitive dashboards and real-time insights. You can also use software like Tableau or KNIME to visualize and interpret data effectively. The goal is to make sense of existing information and present it in a way that supports decision-making.
What Is Data Analytics?
Data analytics takes a broader approach, focusing on predicting future outcomes and recommending actions. It uses advanced techniques like predictive and prescriptive analytics. Predictive analytics forecasts future trends based on historical data, while prescriptive analytics suggests actionable strategies to achieve desired outcomes.
For instance, in retail, data analytics can predict customer buying behavior and recommend personalized marketing strategies. This field often employs tools like Python, R, and platforms such as FineDataLink for real-time data integration and analysis. Unlike data analysis, which looks backward, data analytics helps you look forward, enabling proactive decision-making.
How Are Data Analysis and Data Analytics Related?
Data analysis and data analytics are interconnected. While data analysis focuses on understanding past events, data analytics builds on these insights to predict and shape the future. Think of data analysis as the foundation and data analytics as the structure built upon it. Both rely on data but serve different purposes.
A useful comparison can be seen in the table below:
| Aspect | Data Analysis | Data Analytics |
|---|---|---|
| Purpose | Summarizes historical data | Predicts outcomes based on historical data |
| Scope | Restricted approach, reviews existing data | Broad approach, encompasses entire data lifecycle |
| Techniques and Methods | Uses diagnostic and descriptive analysis | Employs complex statistical models |
| Data Processing | Retrieves data from existing resources | Uses advanced techniques for real-time big data |
| Complexity | Less complex, focuses on interpretation | More complex, involves data collection and modeling |
| Tools and Software | Uses tools like KNIME and Tableau | Utilizes R, Python, and business intelligence tools |
| Outcomes | Provides visualizations of historical data | Generates actionable insights and forecasts |
Both fields play crucial roles in industries like finance, healthcare, and technology. For example, FineBI supports both data analysis and data analytics, empowering businesses to make informed decisions.
Key Differences Between Data Analysis vs Data Analytics
Purpose and Goals
Retrospective Insights in Data Analysis
Data analysis focuses on understanding the past. You use it to summarize historical data and identify patterns or trends. For example, in finance, data analysis helps you examine past revenue data to find correlations with market performance. This retrospective approach allows you to answer questions like, "What happened?" and "Why did it happen?" Tools like FineBI simplify this process by offering intuitive dashboards and visualizations.

Predictive and Prescriptive Insights in Data Analytics
Data analytics, on the other hand, looks forward. It predicts future outcomes and recommends actions. For instance, in healthcare, data analytics identifies factors influencing mental health referrals by analyzing parameters like income and access to care. Predictive analytics forecasts trends, while prescriptive analytics suggests strategies to achieve desired results. Platforms like FineDataLink enable real-time data integration, making these advanced techniques more accessible.
Scope and Approach
Narrow Focus of Data Analysis
Data analysis has a restricted scope. It works with existing data to provide insights into specific questions. For example, in retail, you might use data analysis to visualize customer purchase histories and identify seasonal trends. This narrow focus makes it ideal for tasks that require detailed examination of past events.
Broader Scope of Data Analytics
Data analytics encompasses a wider scope. It includes data collection, validation, and modeling. In finance, data analytics helps mitigate investment risks by analyzing market data to diversify portfolios. This broader approach allows you to address complex challenges and make proactive decisions. Tools like FineBI support this by integrating data from multiple sources for comprehensive analysis.
Techniques and Methods
Statistical Techniques in Data Analysis
Data analysis relies on statistical methods like descriptive and diagnostic analysis. Descriptive analysis summarizes data, while diagnostic analysis identifies causes behind outcomes. For example, you might use descriptive analysis to create monthly sales reports and diagnostic analysis to understand why sales spiked during a specific period. Tools like Tableau and KNIME are commonly used for these tasks.
Advanced Techniques in Data Analytics (e.g., Machine Learning)
Data analytics employs advanced techniques such as regression, time series analysis, and machine learning. These methods help you predict future trends and optimize strategies. For instance, predictive analytics can forecast stock prices, while prescriptive analytics can recommend supply chain improvements. Platforms like FineReport enhance these processes with real-time analytics and dynamic visualizations.
| Aspect | Data Analysis | Data Analytics |
|---|---|---|
| Purpose | Summarizes historical data | Predicts outcomes based on historical data |
| Techniques | Diagnostic and descriptive analysis | Regression, time series, Monte Carlo simulations |
| Complexity | Less complex, uses existing data | More complex, requires data collection and cleaning |
| Tools | KNIME, Tableau, OpenRefine | R, Python, Tableau, Apache Spark, SAS |
| Output | Visualizations of historical data | Actionable insights, forecasts, reports, dashboards |
Both data analysis and data analytics play vital roles in decision-making. While data analysis helps you understand the past, data analytics equips you to shape the future. Tools like FineBI and FineDataLink bridge the gap, empowering you to leverage both approaches effectively.
Tools and Technologies
Tools for Data Analysis (e.g., Excel, SQL, FineBI)
When working with data analysis, you rely on tools that simplify the process of examining historical data. Excel is one of the most widely used tools. It allows you to organize, filter, and visualize data through pivot tables and charts. SQL is another essential tool. It helps you retrieve and manipulate data from databases efficiently. For example, you can use SQL to extract sales data for a specific period and analyze trends.
FineBI takes data analysis to the next level. It provides self-service analytics and intuitive dashboards, making it easier for you to explore historical data. FineBI supports integration with various data sources, including relational databases and big data platforms. This feature ensures you can analyze data from multiple systems in one place. By using FineBI, you can create detailed reports and visualizations that help you understand past performance. Learn more about FineBI's capabilities here.

Tools for Data Analytics (e.g., Python, R, FineDataLink)
Data analytics requires more advanced tools to predict outcomes and recommend actions. Python and R are popular programming languages for this purpose. Python offers libraries like Pandas and Scikit-learn for data manipulation and machine learning. R excels in statistical modeling and visualization, making it ideal for predictive analytics.
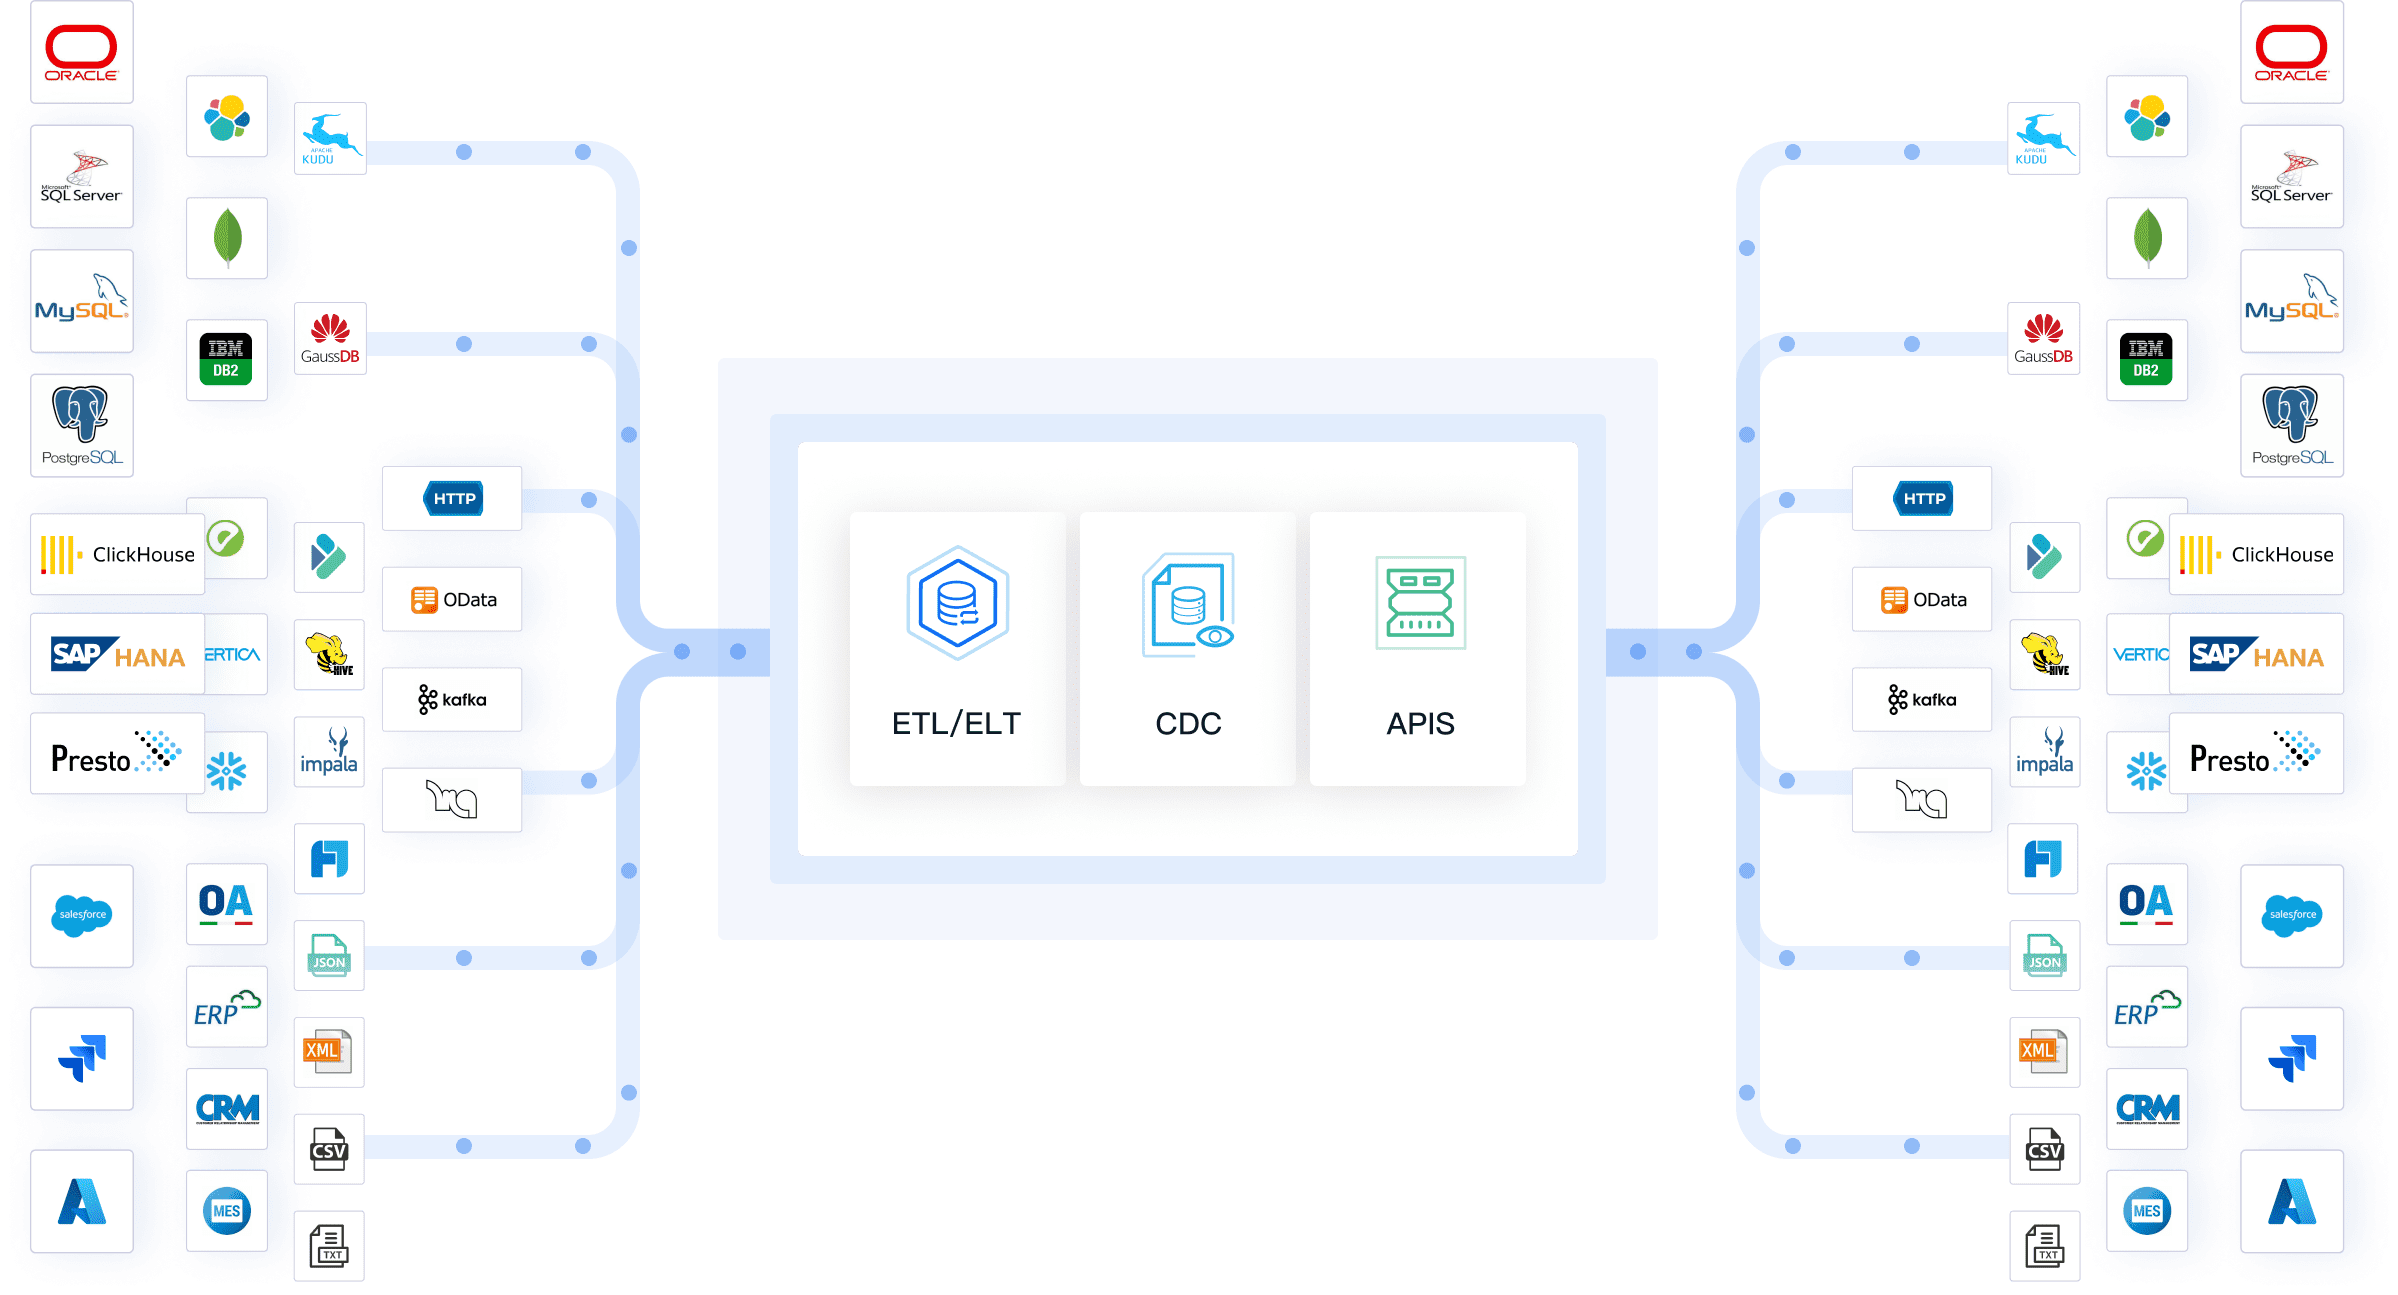
FineDataLink is a powerful platform for data analytics. It enables real-time data integration and advanced ETL processes. With FineDataLink, you can synchronize data from multiple sources and prepare it for analysis. This tool is particularly useful for building predictive models and generating actionable insights. Its low-code interface makes it accessible even if you have limited technical expertise. Explore FineDataLink's features here.

Outcomes and Deliverables
Reports and Insights from Data Analysis
Data analysis delivers reports and visualizations that summarize historical data. These reports help you identify patterns and trends. For instance, in retail, you might analyze customer purchase histories to determine the most popular products during a specific season. Tools like FineBI simplify this process by offering pre-built templates and customizable dashboards. You can use these insights to make informed decisions about inventory management or marketing strategies.
Actionable Strategies from Data Analytics
Data analytics goes beyond understanding the past. It provides actionable strategies based on predictive and prescriptive insights. For example, in healthcare, data analytics can forecast patient admission rates and recommend resource allocation strategies. FineDataLink enhances this process by integrating real-time data from multiple systems. This capability ensures your predictions are accurate and up-to-date.
The table below highlights the key differences in outcomes between data analysis and data analytics:
| Metric | Data Analysis | Data Analytics |
|---|---|---|
| Purpose | Summarizes historical data | Predicts outcomes based on data |
| Scope | Restricted to existing data | Broad, covering entire data lifecycle |
| Techniques | Data visualization tools | Predictive modeling and analytics tools |
| Outcomes | Reports and visualizations | Actionable insights and forecasts |
By understanding these differences, you can choose the right approach for your needs. Whether you aim to analyze past performance or predict future trends, tools like FineBI and FineDataLink can support your journey.
Applications of Data Analysis vs Data Analytics in Industries

Business and Marketing
Customer Behavior Analysis with FineBI
In business and marketing, understanding customer behavior is crucial. Data analysis helps you examine historical customer data to identify patterns and trends. For example, you can analyze purchase histories to determine which products are most popular during specific seasons. FineBI simplifies this process by offering intuitive dashboards and self-service analytics. It allows you to visualize customer behavior and segment audiences effectively. By leveraging these insights, you can make informed decisions about inventory management and marketing strategies.
Predictive Marketing Strategies with FineDataLink
Data analytics takes customer insights a step further by predicting future behaviors and recommending strategies. For instance, you can use predictive analytics to forecast which products customers are likely to buy next. FineDataLink enables real-time data integration, allowing you to analyze data from multiple sources seamlessly. This capability helps you create personalized marketing campaigns that resonate with your target audience. By using tools like FineDataLink, you can optimize your marketing efforts and improve customer engagement.
Healthcare
Patient Data Analysis
In healthcare, data analysis plays a vital role in improving patient outcomes. You can use it to examine historical patient data and identify recovery patterns. For example, hospitals often analyze patient records to determine the effectiveness of specific treatments. FineBI provides real-time insights and visualizations, making it easier for healthcare professionals to interpret data. This approach helps you understand what has worked in the past and apply those lessons to current cases.
Predictive Healthcare Analytics
Data analytics in healthcare focuses on predicting future trends and improving resource allocation. For example, predictive analytics can forecast patient admission rates, helping hospitals prepare for surges in demand. FineDataLink supports this by integrating real-time data from various systems, ensuring accurate predictions. With these insights, you can allocate resources more effectively and enhance patient care. Predictive healthcare analytics also aids in identifying risk factors for diseases, enabling early intervention and better outcomes.
Finance
Financial Reporting and Auditing
Data analysis ensures accuracy and transparency in financial reporting. You can use it to examine historical financial data and identify discrepancies. For instance, auditors analyze past transactions to detect errors or irregularities. FineBI simplifies this process by providing customizable dashboards and detailed reports. Studies, such as those by Castillo-Merino et al. (2020) and Le and Lobo (2020), highlight how high-quality audits improve financial information quality and transparency. By using tools like FineBI, you can enhance the reliability of your financial reports.
Risk Assessment and Fraud Detection
Data analytics is essential for identifying risks and preventing fraud in the financial sector. For example, predictive analytics can detect unusual transaction patterns that may indicate fraudulent activity. FineDataLink enables advanced ETL processes and real-time data synchronization, making it easier to analyze large datasets. Research by Enofe et al. (2015) and Drogalas et al. (2017) shows that forensic audits and high-quality analytics significantly aid in fraud detection. By leveraging data analytics, you can protect your organization from financial risks and enhance decision-making.
Technology
System Performance Analysis
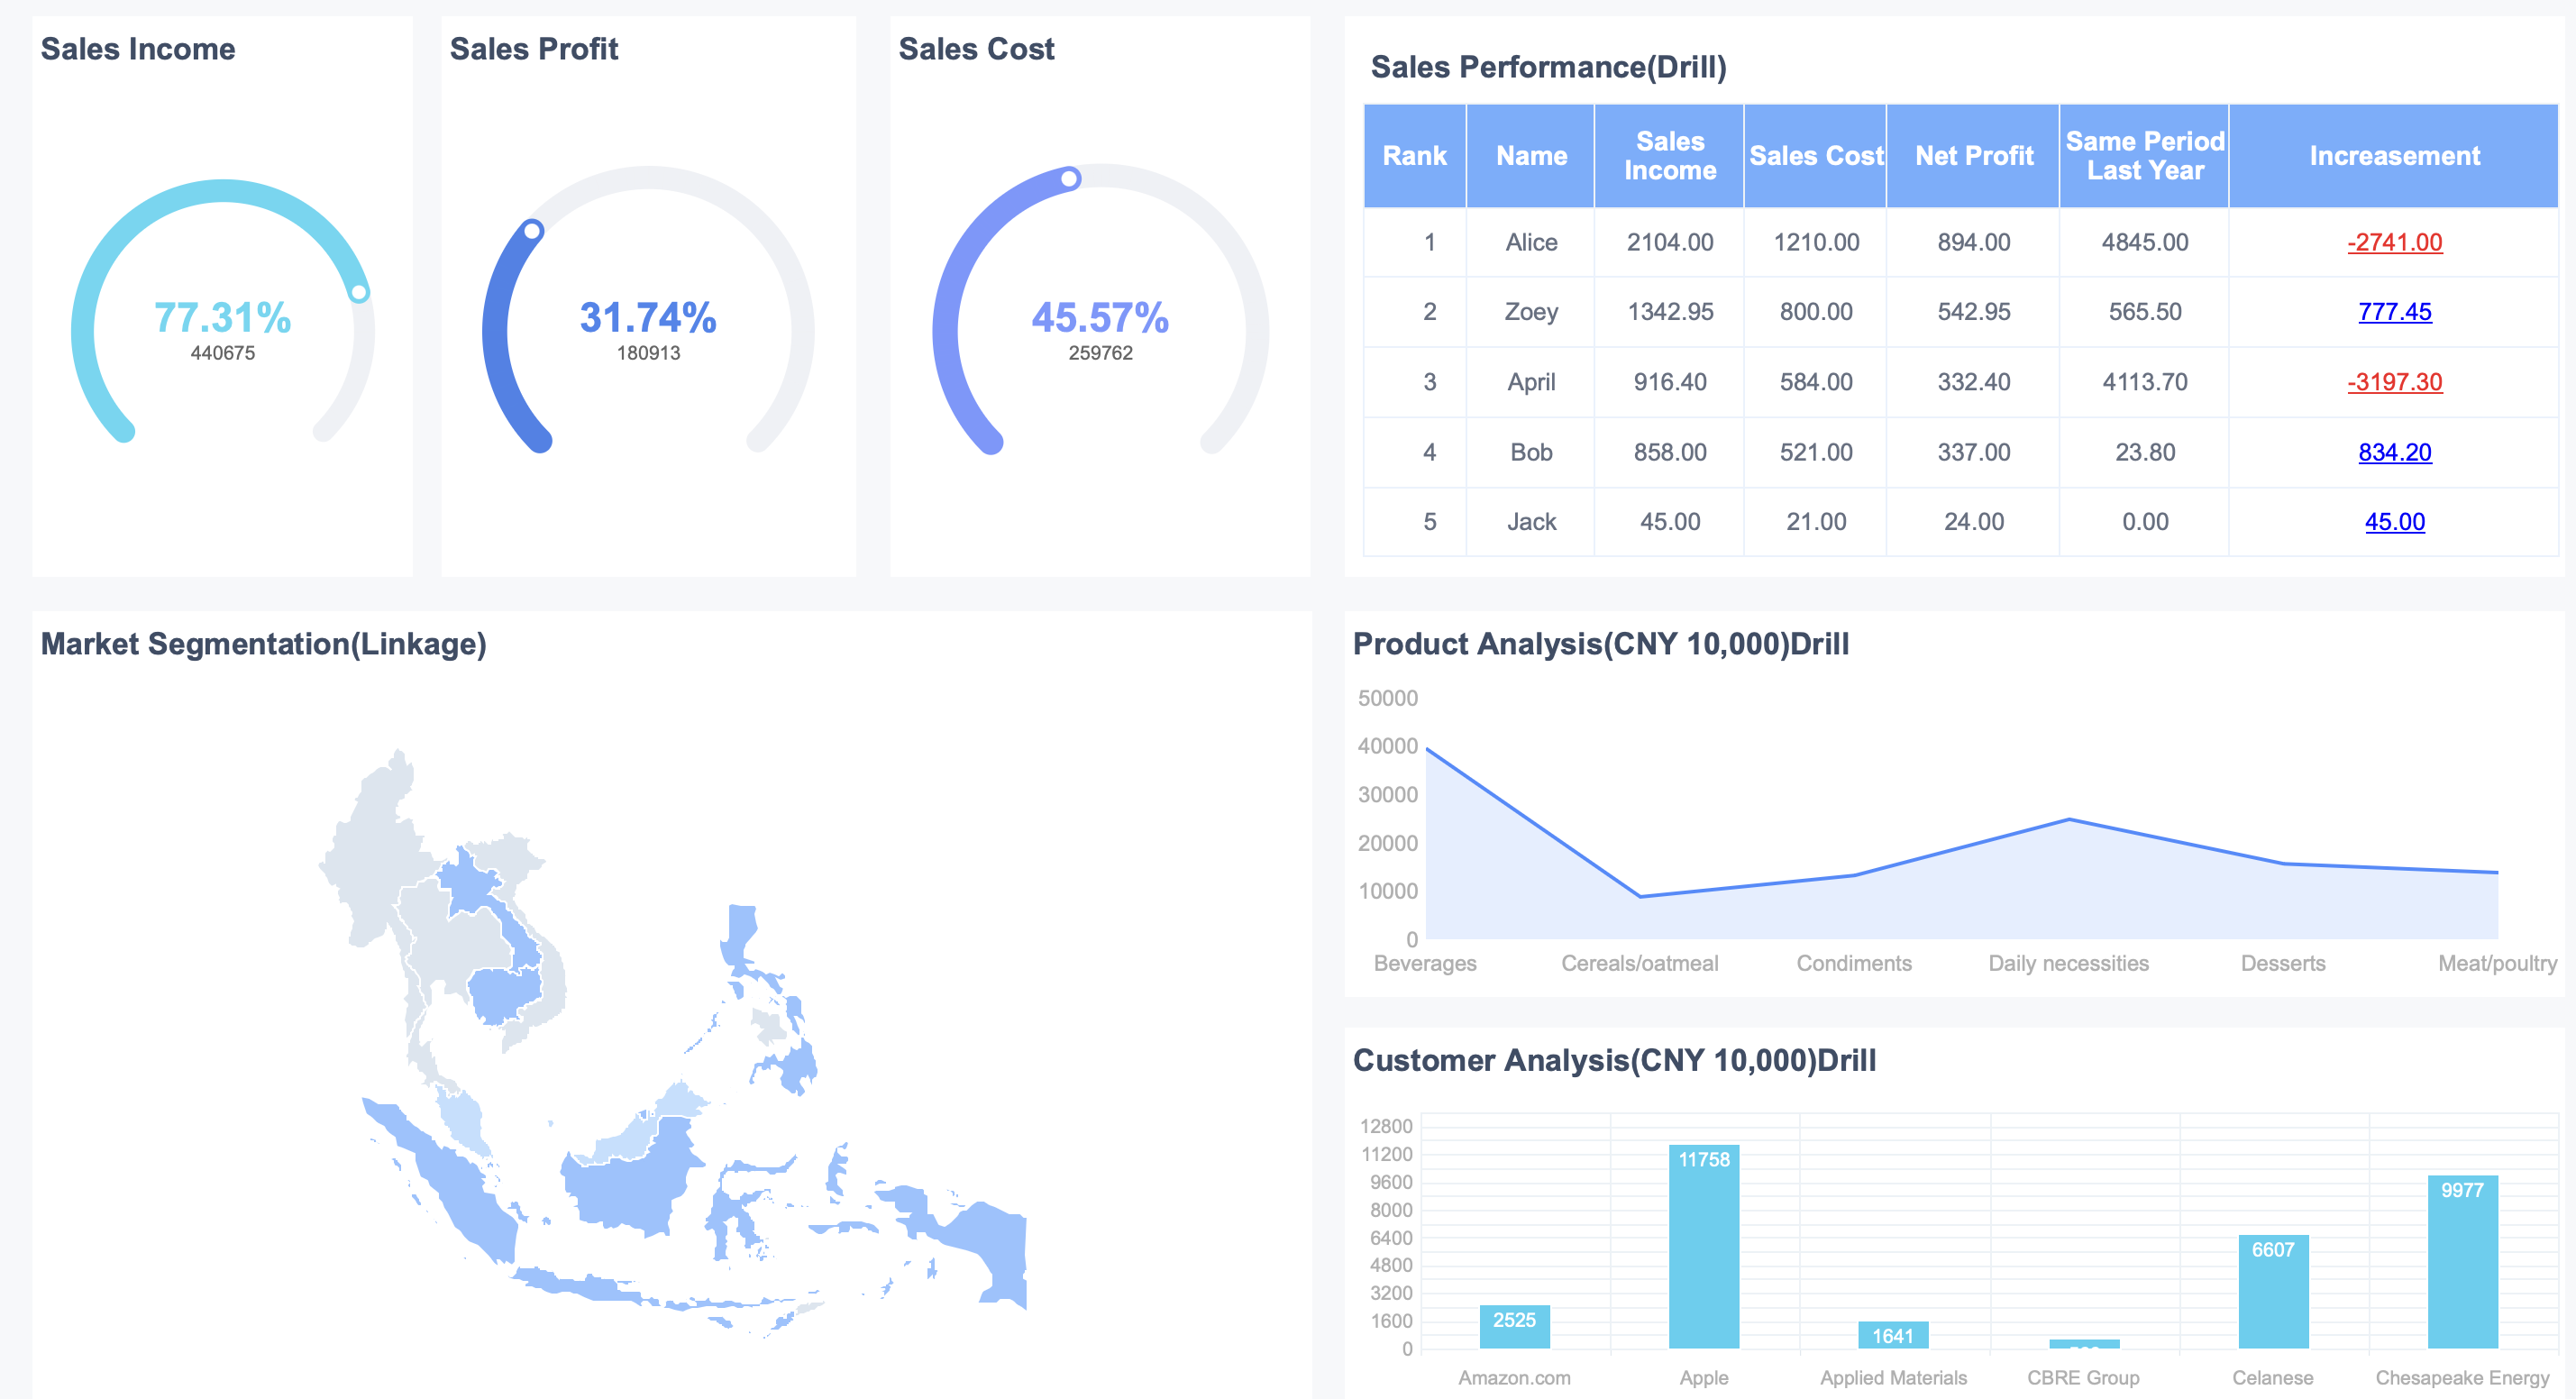
You rely on system performance analysis to ensure your technology operates efficiently. This process involves examining system data to identify bottlenecks, optimize resources, and improve overall performance. For example, in IT infrastructure, analyzing server logs helps you detect issues like slow response times or high CPU usage. By addressing these problems early, you prevent downtime and enhance user experience.
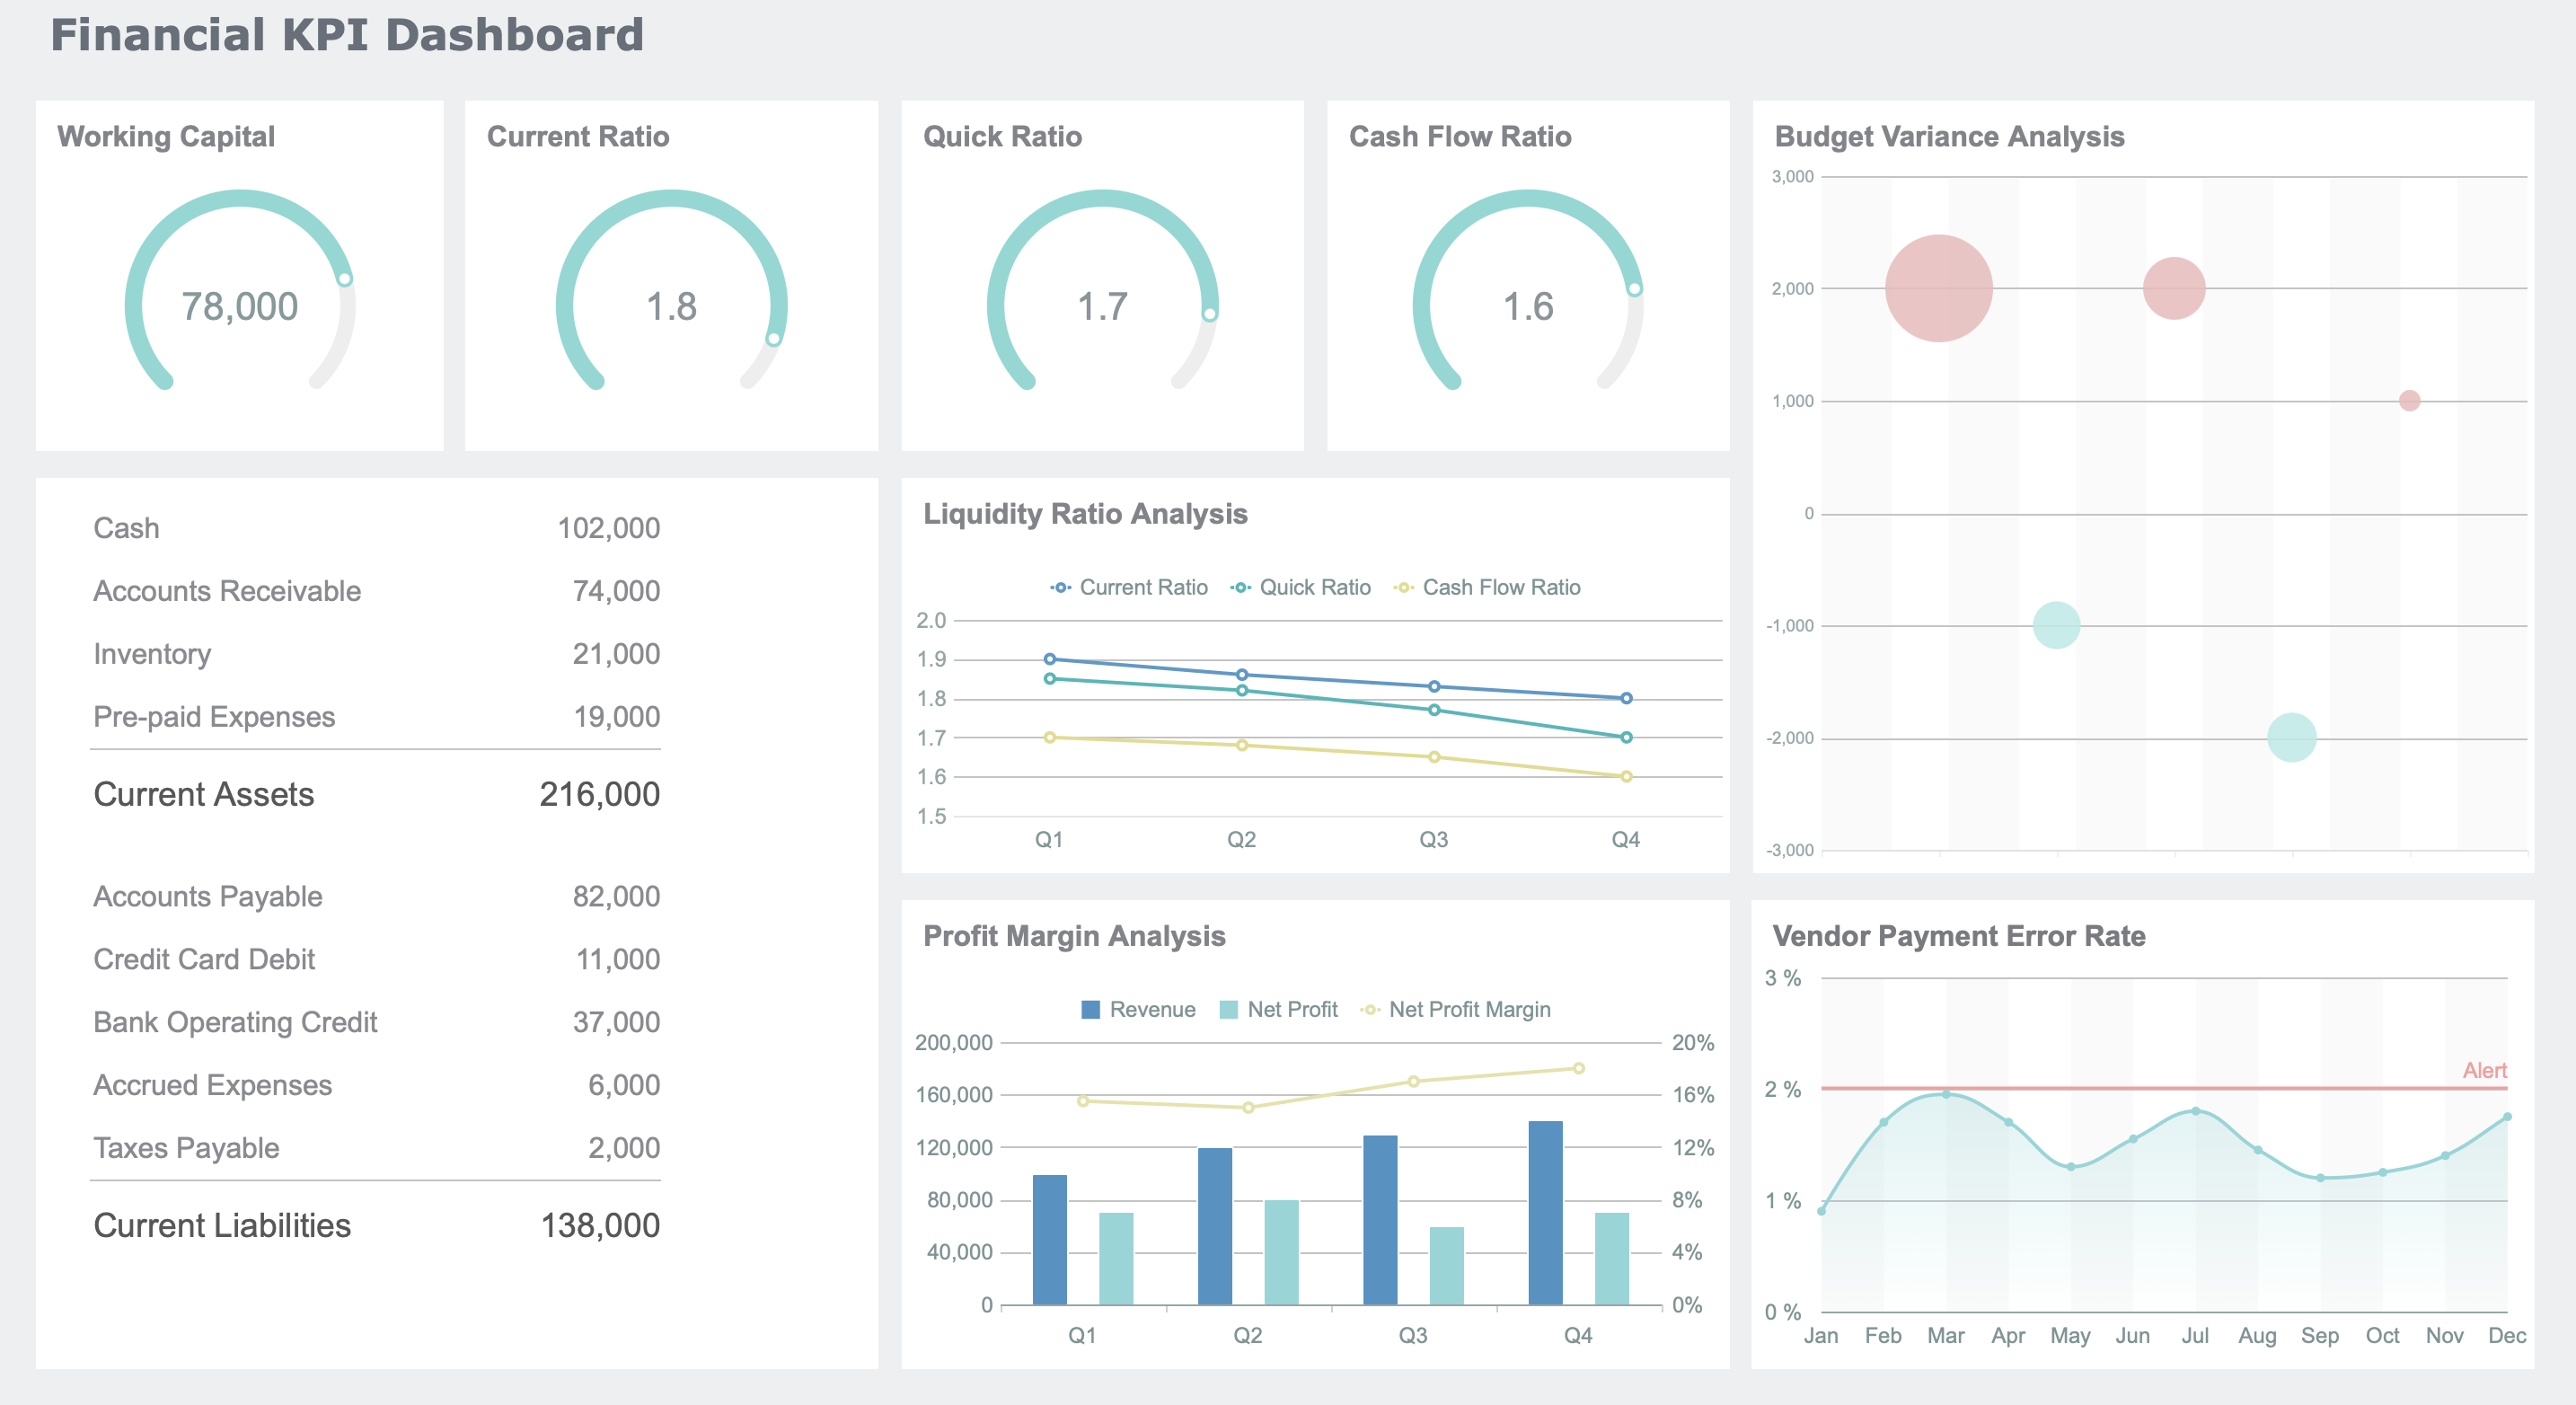
Tools like FineBI simplify this process by providing real-time dashboards and visualizations. These features allow you to monitor system metrics and identify trends quickly. For instance, you can track server performance over time and pinpoint periods of high demand. This insight helps you allocate resources effectively and maintain system stability.
You can try it out in the demo model below:
System performance analysis also plays a crucial role in industries like manufacturing and logistics. By analyzing machine data, you can predict maintenance needs and reduce operational disruptions. This proactive approach ensures your systems run smoothly and efficiently.
AI and Machine Learning Applications with FineReport
Artificial intelligence (AI) and machine learning (ML) have transformed how you approach data analytics. These technologies enable you to uncover patterns, predict outcomes, and make data-driven decisions. For example, in retail, AI algorithms analyze customer behavior to recommend personalized products. In healthcare, ML models predict patient outcomes based on historical data.
FineReport enhances these applications with advanced visualization tools. Its dynamic 3D visualizations and real-time analytics help you interpret complex data effortlessly. For instance, you can use FineReport to visualize the results of an ML model predicting sales trends. The platform’s drag-and-drop interface makes it accessible, even if you lack technical expertise.
AI and ML also improve system performance analysis. By integrating these technologies, you can automate anomaly detection and optimize resource allocation. FineReport supports these efforts by providing interactive dashboards that highlight key insights. This capability allows you to focus on strategic decisions rather than manual data processing.
Incorporating AI and ML into your data analytics strategy gives you a competitive edge. These technologies enable you to adapt to changing conditions and make informed decisions quickly. With tools like FineReport, you can harness the power of AI and ML to drive innovation and growth.

How to Choose Between Data Analysis vs Data Analytics
Assessing Your Goals
When to Use Data Analysis
You should use data analysis when your primary goal is to understand past events and their causes. This approach works best for summarizing historical data and identifying patterns or trends. For example, if you want to evaluate the performance of a marketing campaign, data analysis can help you determine which strategies worked and why. Tools like FineBI simplify this process by offering intuitive dashboards and visualizations.
To decide if data analysis suits your needs, consider these factors:
- Data Quality: Ensure your data is accurate and complete.
- Scope: Focus on specific questions or problems.
- Outcomes: Aim to generate reports or visual summaries of historical data.
When to Use Data Analytics
Data analytics is ideal when you need to predict future outcomes or develop actionable strategies. For instance, a retailer facing declining sales can use data analytics to forecast customer behavior and adjust inventory accordingly. This structured approach involves collecting data, preparing it for analysis, and applying advanced techniques like predictive modeling. Platforms like FineDataLink enable real-time data integration, making these tasks more efficient.
Use data analytics when:
- You need to address complex challenges.
- Your goal is to make proactive, data-driven decisions.
- You require insights that align with long-term business objectives.
| Metric Type | Description |
|---|---|
| Data Quality Metrics | Ensures reliability and accuracy of data, focusing on completeness, accuracy, and consistency. |
| Data Accessibility Metrics | Tracks ease of access to data, including availability and user access levels. |
| Data Governance Metrics | Measures adherence to policies and effectiveness of data stewardship. |
| Data Analytics Metrics | Focuses on outcomes of data analysis, such as data-driven decisions and actionable insights. |
| Alignment with Business Goals | Assesses contribution of data initiatives to business objectives through strategic alignment scores and ROI. |
Skillsets and Tools Required
Skills for Data Analysis
To excel in data analysis, you need strong analytical and problem-solving skills. Familiarity with tools like Excel, SQL, and FineBI is essential. These tools help you organize, filter, and visualize data effectively. You should also understand statistical techniques like descriptive and diagnostic analysis.
Key skills include:
- Data Cleaning: Ensure data accuracy and consistency.
- Visualization: Create charts and graphs to present findings.
- Communication: Translate insights into actionable recommendations.
Skills for Data Analytics with FineChatBI
Data analytics requires a broader skill set. You need expertise in programming languages like Python or R and experience with advanced techniques like machine learning. Tools like FineChatBI enhance your capabilities by providing a conversational interface for data queries. This tool combines rule-based and large models, ensuring precision and credibility in your analysis.
Essential skills for data analytics include:
- Data Modeling: Build predictive models to forecast outcomes.
- Real-Time Analysis: Use platforms like FineDataLink for dynamic insights.
- Strategic Thinking: Align analytics efforts with business goals.
| Aspect | Data Analysis | Data Analytics |
|---|---|---|
| Scope | Limited to specific data operations | Comprehensive business intelligence |
| Objectives | Cleaning and analyzing data | Turning raw data into actionable insights |
| Tools | OpenRefine, KNIME, RapidMiner | Python, Power BI, Tableau |
| Process Length | Short (3 steps) | Long (8 steps) |
Industry and Role Considerations
Roles That Focus on Data Analysis
Roles centered on data analysis often involve examining historical data to identify trends and patterns. Common positions include:
- Data Analyst: Focuses on cleaning and interpreting data.
- Business Analyst: Uses data to support decision-making processes.
- Financial Analyst: Examines revenue data to discover correlations.
These roles require proficiency in tools like Excel and FineBI. Analysts often work in industries like finance, healthcare, and retail, where understanding past performance is crucial.
Roles That Require Data Analytics Expertise
Data analytics professionals play a strategic role in organizations. They use advanced techniques to predict outcomes and recommend actions. Key roles include:
- Data Scientist: Develops predictive models and algorithms.
- BI Engineer: Builds systems for real-time data analysis.
- Operations Analyst: Optimizes processes using analytics insights.
In manufacturing, data analytics helps optimize operations and improve productivity. In finance, analytics teams mitigate investment risks by analyzing portfolios. Tools like FineDataLink and FineReport support these efforts by providing real-time data integration and visualization capabilities.
Tip: Choose a role that aligns with your skills and interests. If you enjoy working with historical data, consider data analysis. If you prefer predictive modeling and strategic decision-making, explore data analytics roles.
Data analysis and data analytics complement each other, offering unique benefits for understanding and utilizing data. Data analysis focuses on summarizing historical data, helping you interpret past trends and patterns. In contrast, data analytics predicts outcomes and identifies actionable strategies, enabling proactive decision-making. Together, they enhance campaign management and resource allocation by providing clarity and actionable insights.
FanRuan-en's tools, such as FineBI, FineDataLink, and FineReport, empower you to leverage both approaches effectively. Whether you aim to analyze past performance or predict future trends, these tools provide the capabilities you need to make informed, data-driven decisions. Explore how FineReport and other solutions can further enhance your data journey.
Click the banner below to try FineBI for free and empower your enterprise to transform data into productivity!
Continue Reading About Data Analysis
Why Care About Data Platforms? Find Out Here!
Understanding Descriptive Analytics: What It Is and How It Works
Step-by-Step Guide to Setting Up a Data Analytics Framework
Write a Killer Visual Analysis Essay in 2025!


FAQ

The Author
Lewis
Senior Data Analyst at FanRuan
Related Articles

What Recruiters Look for in a Data Analysis Portfolio: 10 Criteria to Score Yours Fast
A $1 is not judged like a school assignment. It is judged like a hiring shortcut. Recruiters, hiring managers, and analytics leads use it to answer one question fast: Can this person solve business problems with data in
Lewis Chou
May 29, 2026

What Is Data Analytics Consulting? Beginner’s Guide to Services, Deliverables, and Business Value
$1 helps organizations turn raw data into decisions they can trust. For many business leaders, the challenge is not a lack of data. It is a lack of clarity. Reports conflict, teams track different KPIs, dashboards are un
Lewis Chou
Jun 03, 2026

Data Analyst Job Description [+2026 Guide]: Compare Responsibilities, Skills, and Salary by Industry
A strong $1 does more than list tasks. It defines how a company turns raw data into business decisions, which teams the analyst supports, and what measurable outcomes the role is expected to influence. For employers, tha
Lewis Chou
Jun 02, 2026