You often hear people use reporting and analytics as if they mean the same thing. Imagine your team receives a monthly sales report but struggles to understand why sales dropped. Reporting gives you the numbers. Analytics helps you find the reasons. FanRuan and FineReport define reporting as producing flexible reports and building unified data platforms. Analytics means using that data to answer questions and improve decisions. Many organizations face challenges such as outdated systems, lack of skills, and unclear objectives.
| Aspect | Description |
|---|---|
| Reporting Capability | Quickly produce reports and build a unified data management platform. |
| Data Integration | Seamlessly connect with various systems to save costs and speed up projects. |
| Business Operations | Use more data for effective decisions. |
Reporting helps you organize and present your company’s data in a clear and accurate way. You use reporting to create summaries, tables, and charts that show what has happened in your business. Most companies rely on reporting to track sales, monitor performance, and share results with teams.
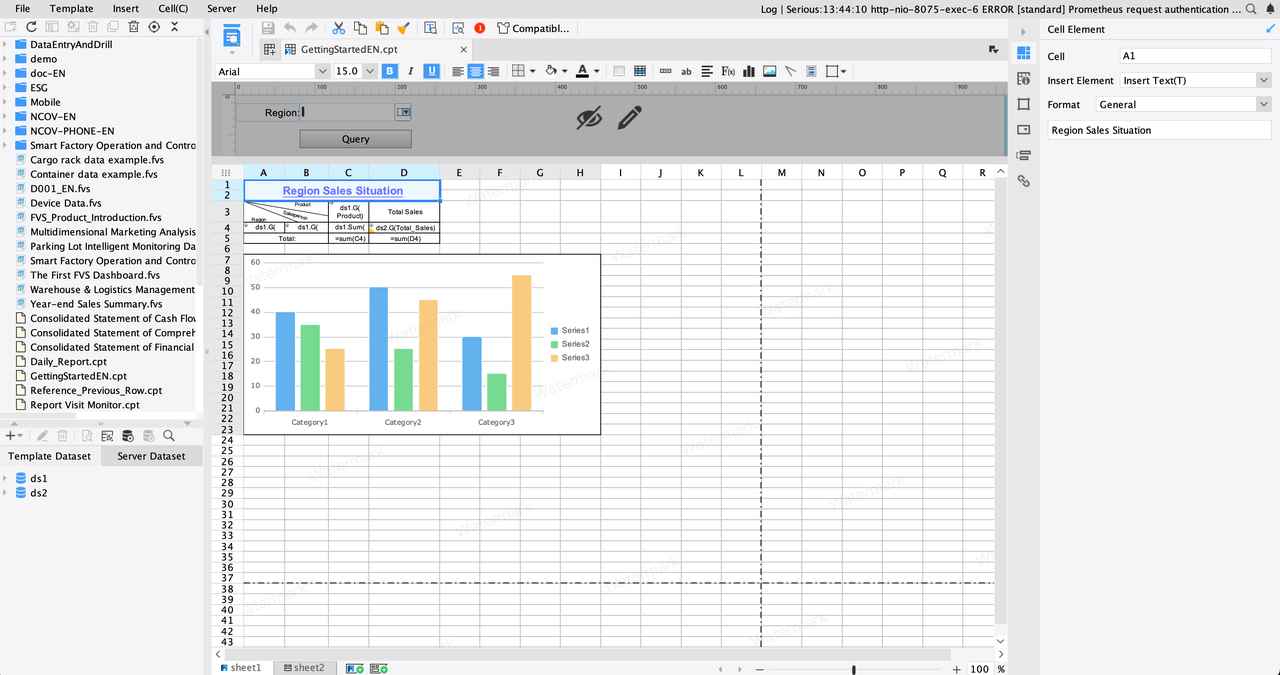
Reporting gives you a snapshot of your business. You can see trends, spot problems, and understand your progress over time.
FanRuan and FineReport make reporting easier by connecting to many data sources and letting you build custom reports quickly. With these tools, you can automate regular reports and share them across your organization.
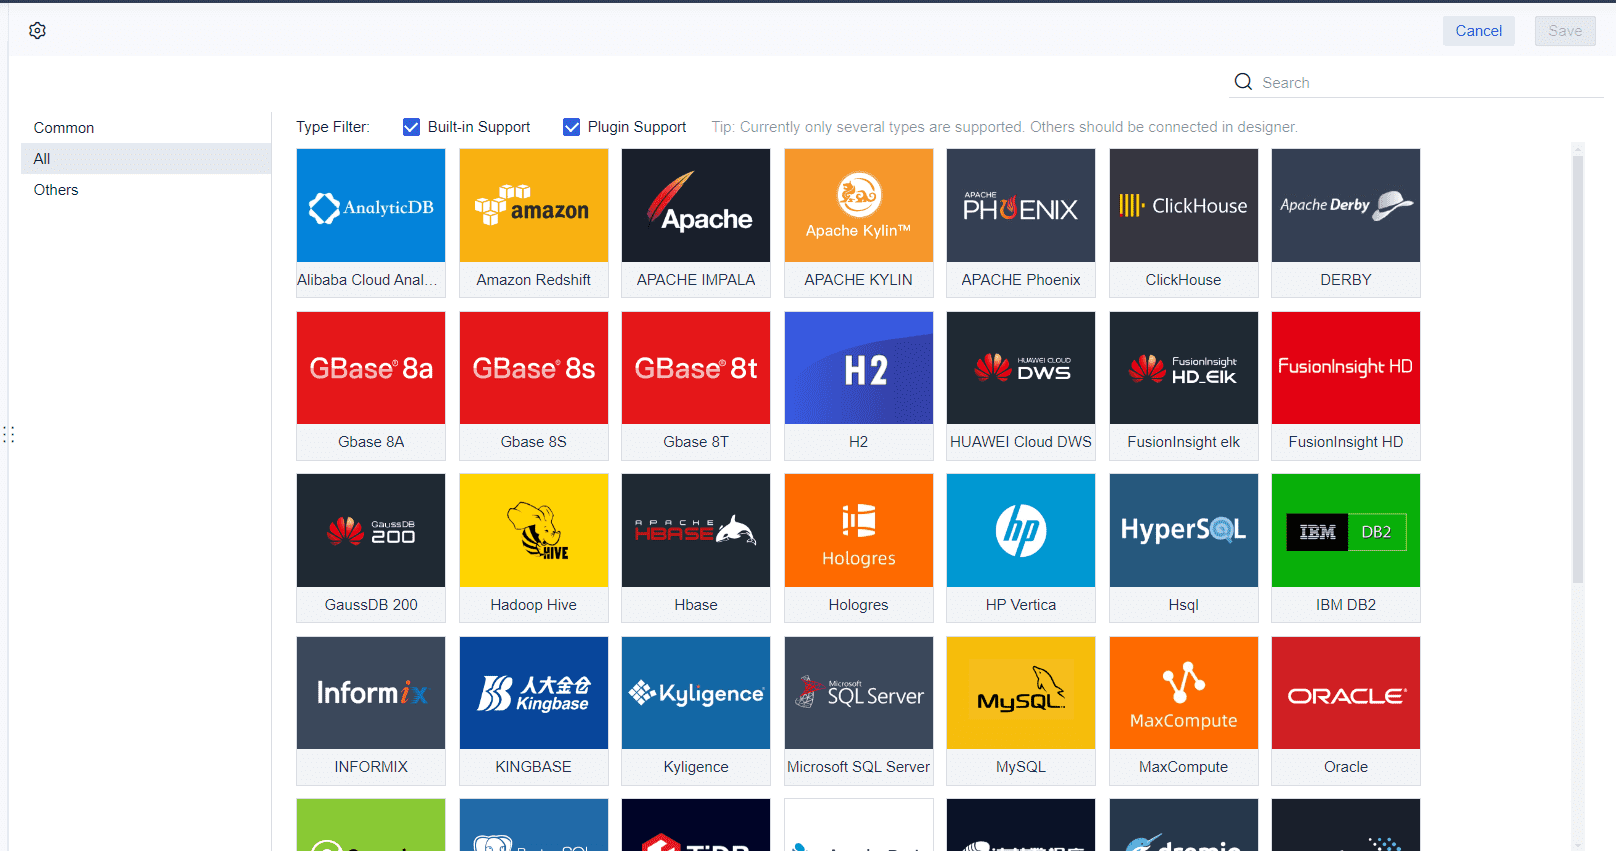
Here are some core functions of reporting:
| Core Function | Description |
|---|---|
| Reporting | Provides static reports summarizing historical data, helping you understand past performance. |
| Analysis | Examines data to uncover insights and trends. |
| Monitoring | Tracks key metrics over time. |
| Prediction | Uses past data to forecast future outcomes. |
You often use reporting for data integration, business intelligence, and sharing information with stakeholders.
Analytics goes beyond reporting. You use analytics to dig deeper into your data and answer important questions. Analytics helps you find patterns, explain why things happen, and predict what might come next.
FanRuan and FineReport support analytics by offering advanced features like funnel analysis and mobile dashboards. These tools help you explore data, compare results, and make better decisions.
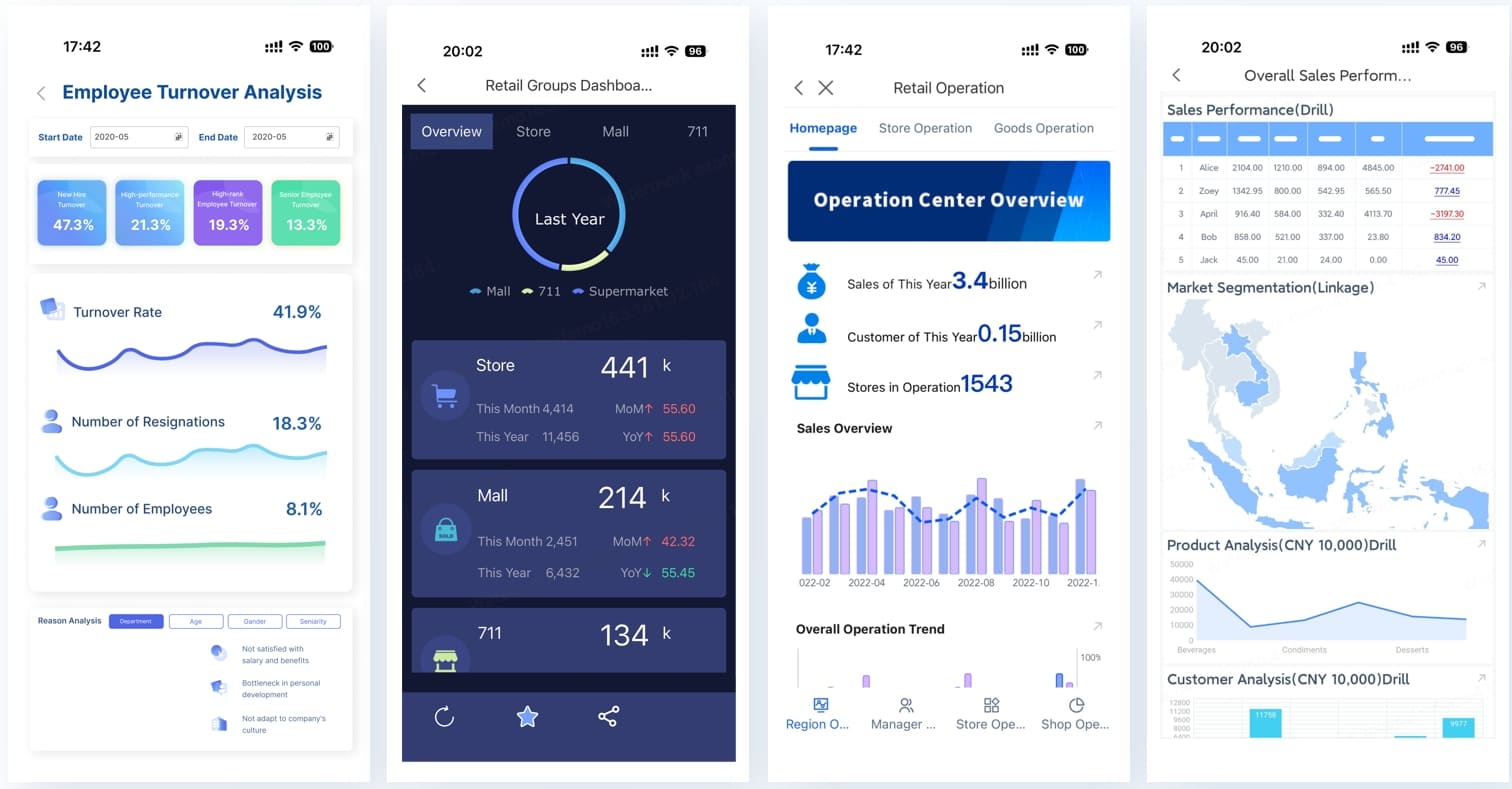
Analytics is used in many industries:
| Industry | Use Case Description |
|---|---|
| Healthcare | Predicts disease outbreaks and improves patient care. |
| IT and Cybersecurity | Manages complex systems and detects threats. |
| Financial | Finds fraud by analyzing patterns. |
| Retail and e-commerce | Optimizes pricing and personalizes recommendations. |
| Manufacturing | Drives strategic decisions and finds growth opportunities. |
The field of reporting and analytics has changed a lot over time. In the 1970s, companies started using databases for reporting. In the 1990s, data warehousing made it easier to analyze large amounts of data. Today, tools like FanRuan and FineReport use artificial intelligence and cloud computing to make analytics faster and more powerful.
When you compare reporting and analytics, you notice key differences in how each handles data. Reporting organizes and presents historical data in a structured format. You use reporting to communicate results to stakeholders and track performance over time. Analytics interprets data to uncover patterns and actionable insights. You rely on analytics to answer deeper questions and improve business outcomes.
Here is a table that highlights the key differences in data handling:
| Aspect | Reporting | Analytics |
|---|---|---|
| Purpose | Communicates insights to stakeholders | Provides actionable insights and identifies areas for improvement |
| Functionality | Presents data in a structured format | Interprets data to uncover patterns and trends |
| Data Type | Historical data | Current and predictive data |
| Frequency | Periodic generation (daily, weekly, monthly) | On-demand analysis |
FanRuan solutions, including FineReport, help you manage both reporting and analytics needs. FineReport connects to multiple data sources, allowing you to create custom reports and dashboards. You can use direct SQL queries for report generation or access real-time data for analytics. FineBI, another FanRuan product, focuses on self-service analytics and can process billions of records for deeper analysis.
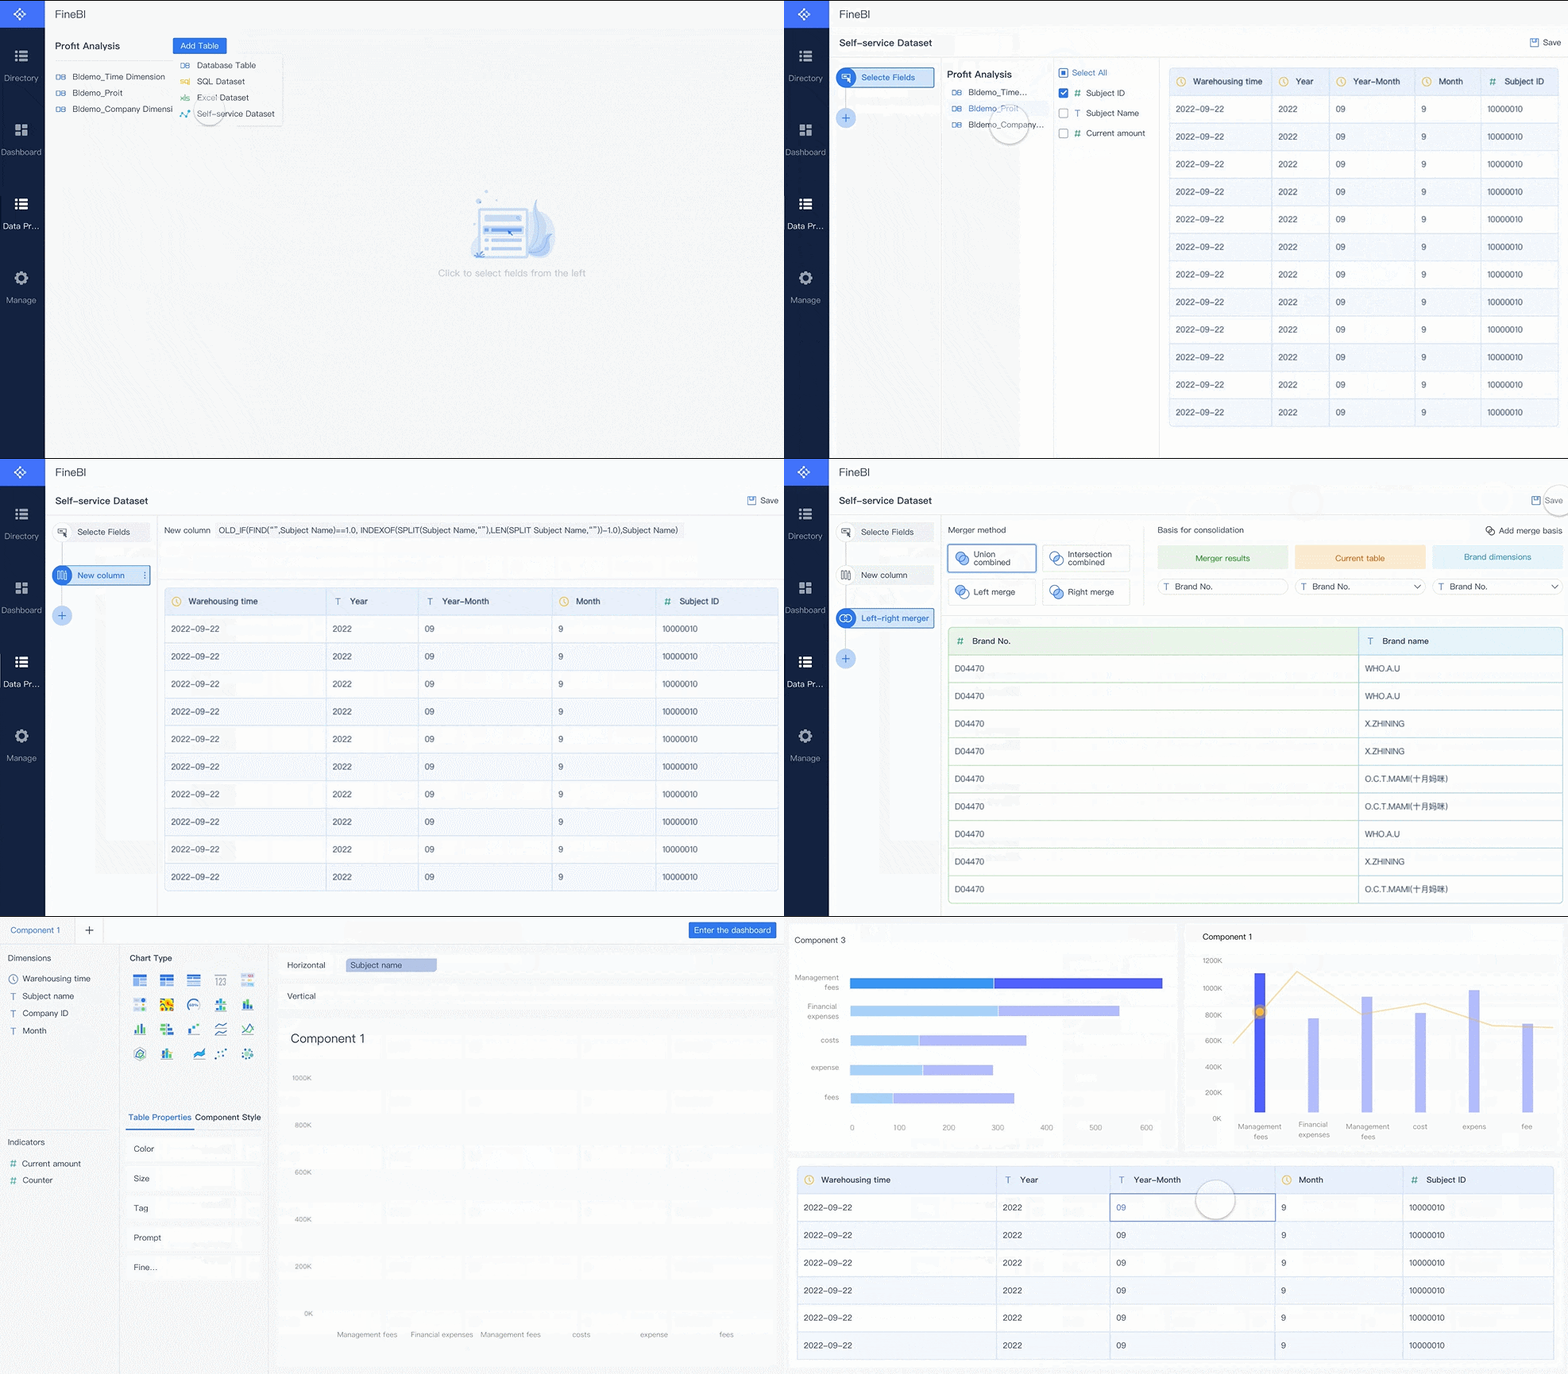
Tip: Use reporting to get a clear snapshot of your business. Use analytics to find out why things happen and what you can do next.
You approach reporting and analytics with different goals. Reporting summarizes past data and answers the question, "What happened?" You use dashboards, tables, and charts to get a clear overview of events. Analytics examines data to identify trends and insights. You ask, "Why did it happen?" and "What’s next?" Analytics uses statistical modeling and machine learning to predict future outcomes.
Here is a table that compares the approaches and outcomes:
| Aspect | Reporting | Analytics |
|---|---|---|
| Purpose | Summarizes past data | Examines data to identify trends and insights |
| Focus | Answers 'What happened?' | Answers 'Why did it happen?' and 'What’s next?' |
| Tools | Dashboards, tables, charts | Statistical modeling, machine learning |
| Outcome | Provides a clear overview of past events | Derives actionable insights for future actions |
| Expertise Needed | Basic understanding of data | Requires specialized knowledge and tools |
FanRuan solutions show you the difference between analytics and reporting. FineReport helps you collect and present data, focusing on the "what." Analytics tools like FineBI dig deeper, helping you understand the "why" and "how." This approach improves your decision-making and helps you respond to changes quickly.
You see another key difference when you look at static reporting and dynamic analytics. Static reports use fixed data from a specific point in time. You often share these as PDFs or printed documents. Dynamic analytics uses real-time or frequently updated data. You can interact with dashboards, filter data, and drill down for more details.
Here is a table that shows the differences:
| Static Reports | Dynamic Reports | |
|---|---|---|
| Data Currency | Fixed data from a specific point in time | Real-time or frequently updated data |
| Interactivity | Limited to predefined views | Users can filter, sort, and drill down into data |
| Update Frequency | Manual updates required | Automatic updates based on schedules or real-time feeds |
| Flexibility | Rigid structure and layout | Adaptable to changing data and user needs |
| User Experience | Consistent but limited interaction | Interactive and customizable |
| Data Volume Handling | Better for smaller, fixed datasets | Can handle large, changing datasets |
| Distribution Method | Often shared as PDFs or printed documents | Accessed through web interfaces or specialized software |
FineReport supports both static reporting and dynamic analytics. You can create fixed-format reports for regular business reviews. You also have access to dynamic charts, parameter filtering, and drill-down features. These tools let you interact with your data and explore different scenarios. You can filter data, link parameters, and expand data layers for detailed analysis. FineReport’s dynamic query feature improves efficiency, letting you filter data across multiple tables.
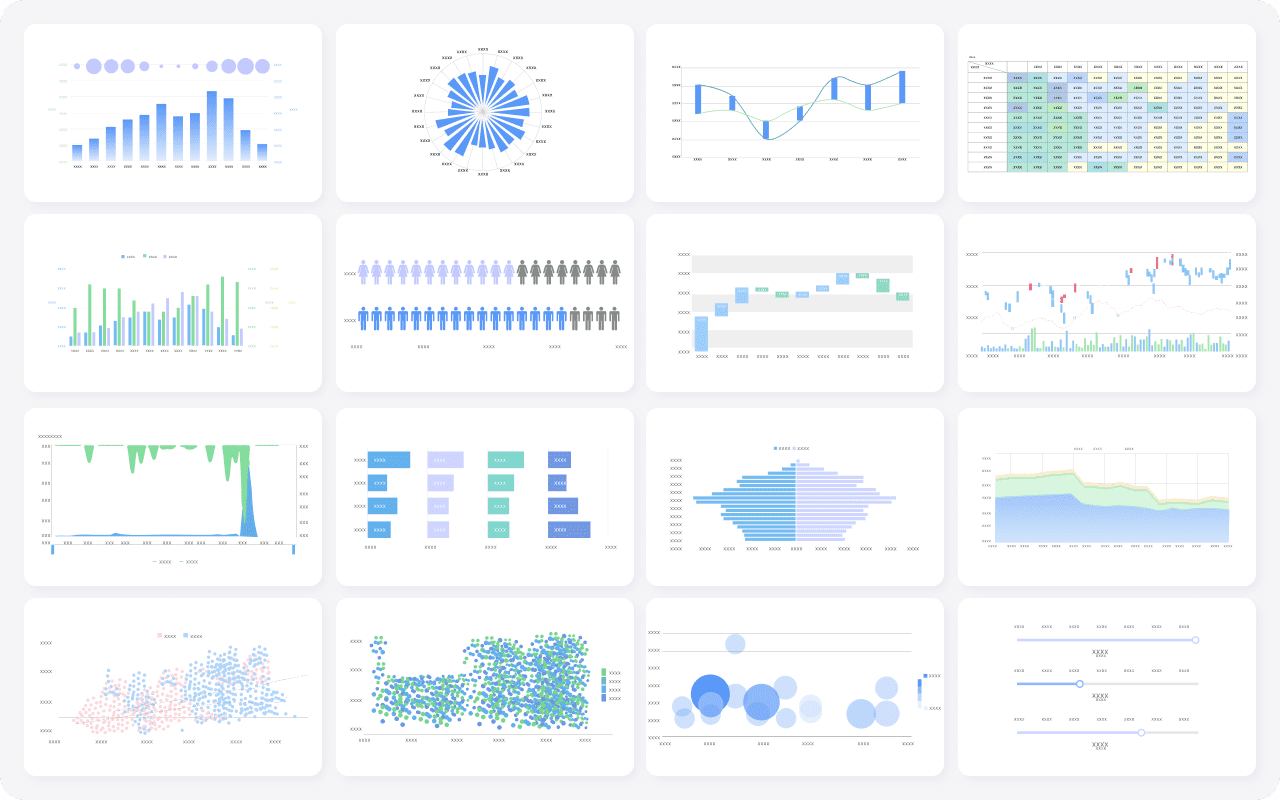
Note: When you use dynamic analytics, you gain more flexibility and deeper insights. You can adapt quickly to new information and make better decisions.
You need both reporting and analytics to run your business effectively. Reporting gives you the facts. Analytics helps you understand what those facts mean and how you can use them to grow.
You make better decisions when you understand the difference between reporting and analytics. Reporting gives you a snapshot of your business performance. Analytics helps you find patterns and predict future outcomes. When you use both, you can answer questions like "What happened?" and "Why did it happen?" This approach leads to smarter strategies and improved results.
For example, Walmart used analytics to study consumer behavior. The company predicted future choices based on past data. This helped Walmart manage inventory more efficiently and reduce waste. You can apply similar strategies in your organization to save costs and improve results.
Organizations that use analytics to enhance inclusion see real benefits. Southern Veterinary Partners improved belonging scores and reduced turnover by using people analytics. Companies with high inclusion scores often outperform their peers financially. Analytics helps you align business objectives, identify pain points, and design solutions that deliver value.
Calculating the ROI of analytics projects requires a clear formula: ROI = (Net Benefits / Total Costs) * 100. You should define objectives, set a timeframe, and measure results. Include both financial and intangible benefits, such as better decision-making and employee satisfaction.
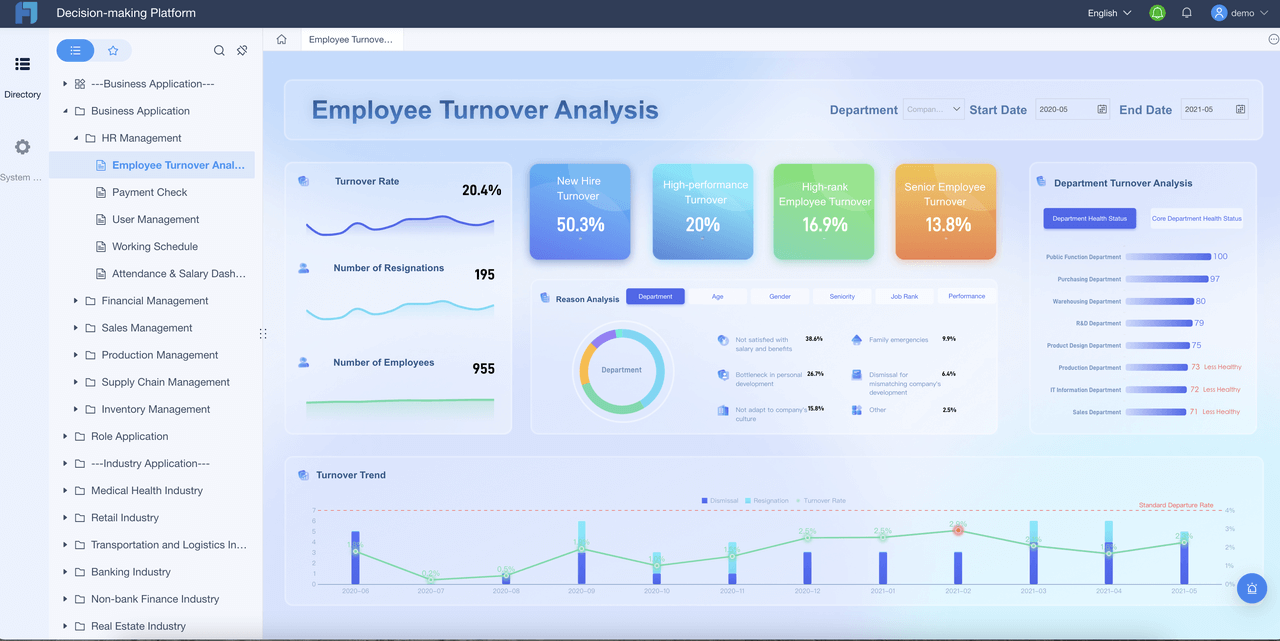
FanRuan and FineReport give you powerful tools to turn data into actionable insights. You can create custom reports with a flexible report designer. The drag-and-drop interface makes it easy to build dashboards and visualize data. FineReport connects to multiple data sources, giving you a comprehensive view of your business.
| Feature | Description |
|---|---|
| Flexible Report Designer | Quickly generate reports and dashboards with drag-and-drop tools. |
| Diverse Visualization | Visualize data in many ways for better understanding. |
| Interactive Analysis | Engage with data dynamically for deeper insights. |
| Data Integration | Combine data from different sources for a complete picture. |
| Mobile Accessibility | Access reports and dashboards on mobile devices for on-the-go insights. |
You benefit from timely insights and continuous monitoring. FineReport keeps your intelligence up to date with regular updates. You can act quickly and stay ahead of competitors. Analytics and reporting work together to help you measure ROI, communicate results, and improve business outcomes.
Tip: Use reporting to track progress and share results. Use analytics to find opportunities and drive growth.
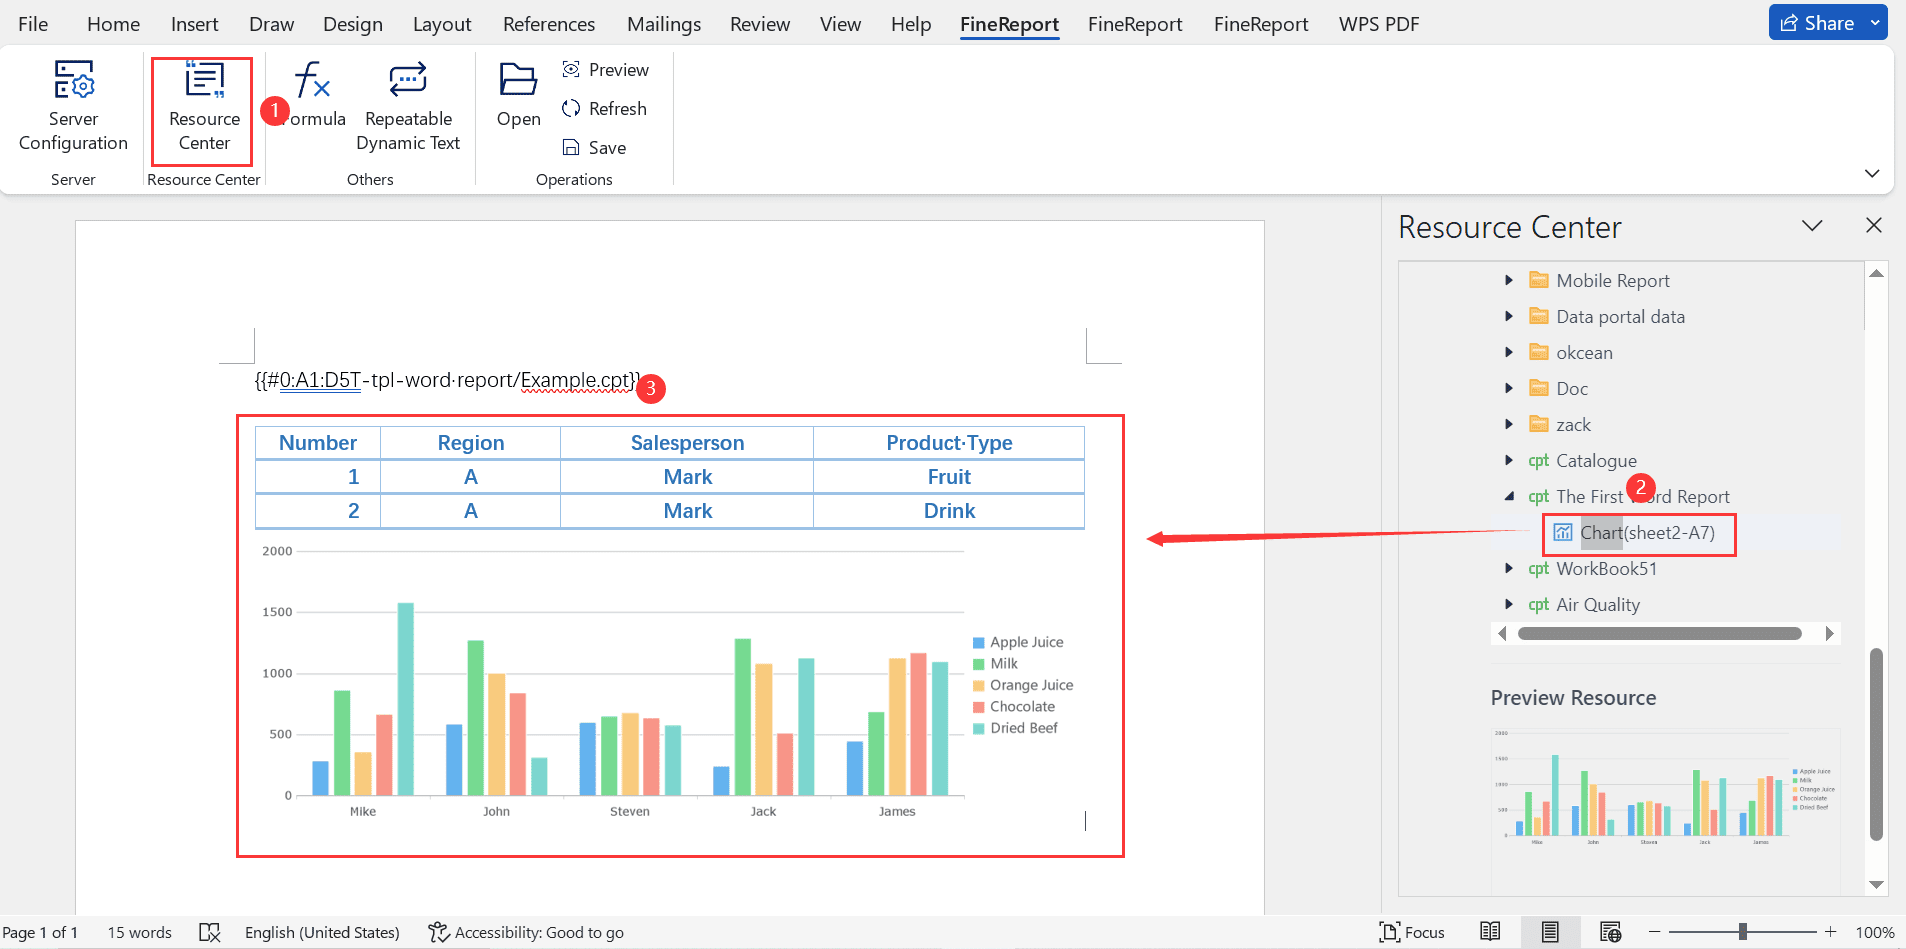
When you build a reporting template, you set the foundation for clear communication and smart decision-making. You want your reporting to be easy to read and understand. You also want your analytics to help you find patterns and make recommendations. A good template brings these goals together.
Start by focusing on clarity. Use simple language and visual data modeling. You help your team interpret results faster. Relevance matters too. Include only the most important metrics and KPIs. Tailor your reporting to your audience so they see what matters most. Actionability is key. Design your reporting to guide decision-makers. Add recommendations so users know what steps to take next.
Here is a table that shows essential components of a strong reporting template:
| Component | Description |
|---|---|
| Clarity | Make reports easy to understand with clear language and visuals. |
| Relevance | Focus on key metrics and KPIs that matter to your audience. |
| Actionability | Help users make decisions quickly by including recommendations. |
You need to include several steps in your reporting process.
Leading organizations use best practices to structure their reporting templates.
You improve your analytics by aligning your reporting with organizational objectives. You document roles and responsibilities so everyone knows who to consult. You integrate tools for cross-functional communication. These steps make your reporting more effective and your analytics more valuable.
Tip: When you combine strong reporting templates with powerful analytics, you help your organization make smarter decisions every day.
When you design an analytics template, you create a powerful tool for exploring data and finding answers. Analytics templates help you move beyond simple reporting. You use them to dig deeper into your data and discover patterns that drive business growth.
Start by setting clear objectives. Decide what questions you want analytics to answer. You might want to know why sales dropped or which products perform best. Next, gather the right data. Pull information from your reporting system, databases, or dashboards. Make sure your data is accurate and up to date.
You organize your analytics template with these key elements:
Tip: Always connect your analytics template with your reporting process. This helps you compare past performance with current insights.
Here is a simple table to guide you:
| Element | Purpose |
|---|---|
| Objective | Focus your analytics on a clear question |
| Data Sources | Use reporting and other systems for input |
| Metrics/KPIs | Track what matters most |
| Methods | Apply analytics techniques |
| Visualization | Show results with charts or dashboards |
| Recommendations | Turn insights into actions |
You improve your analytics by updating templates regularly. Review your reporting data and adjust your analytics methods as your business changes. This keeps your analysis relevant and useful.
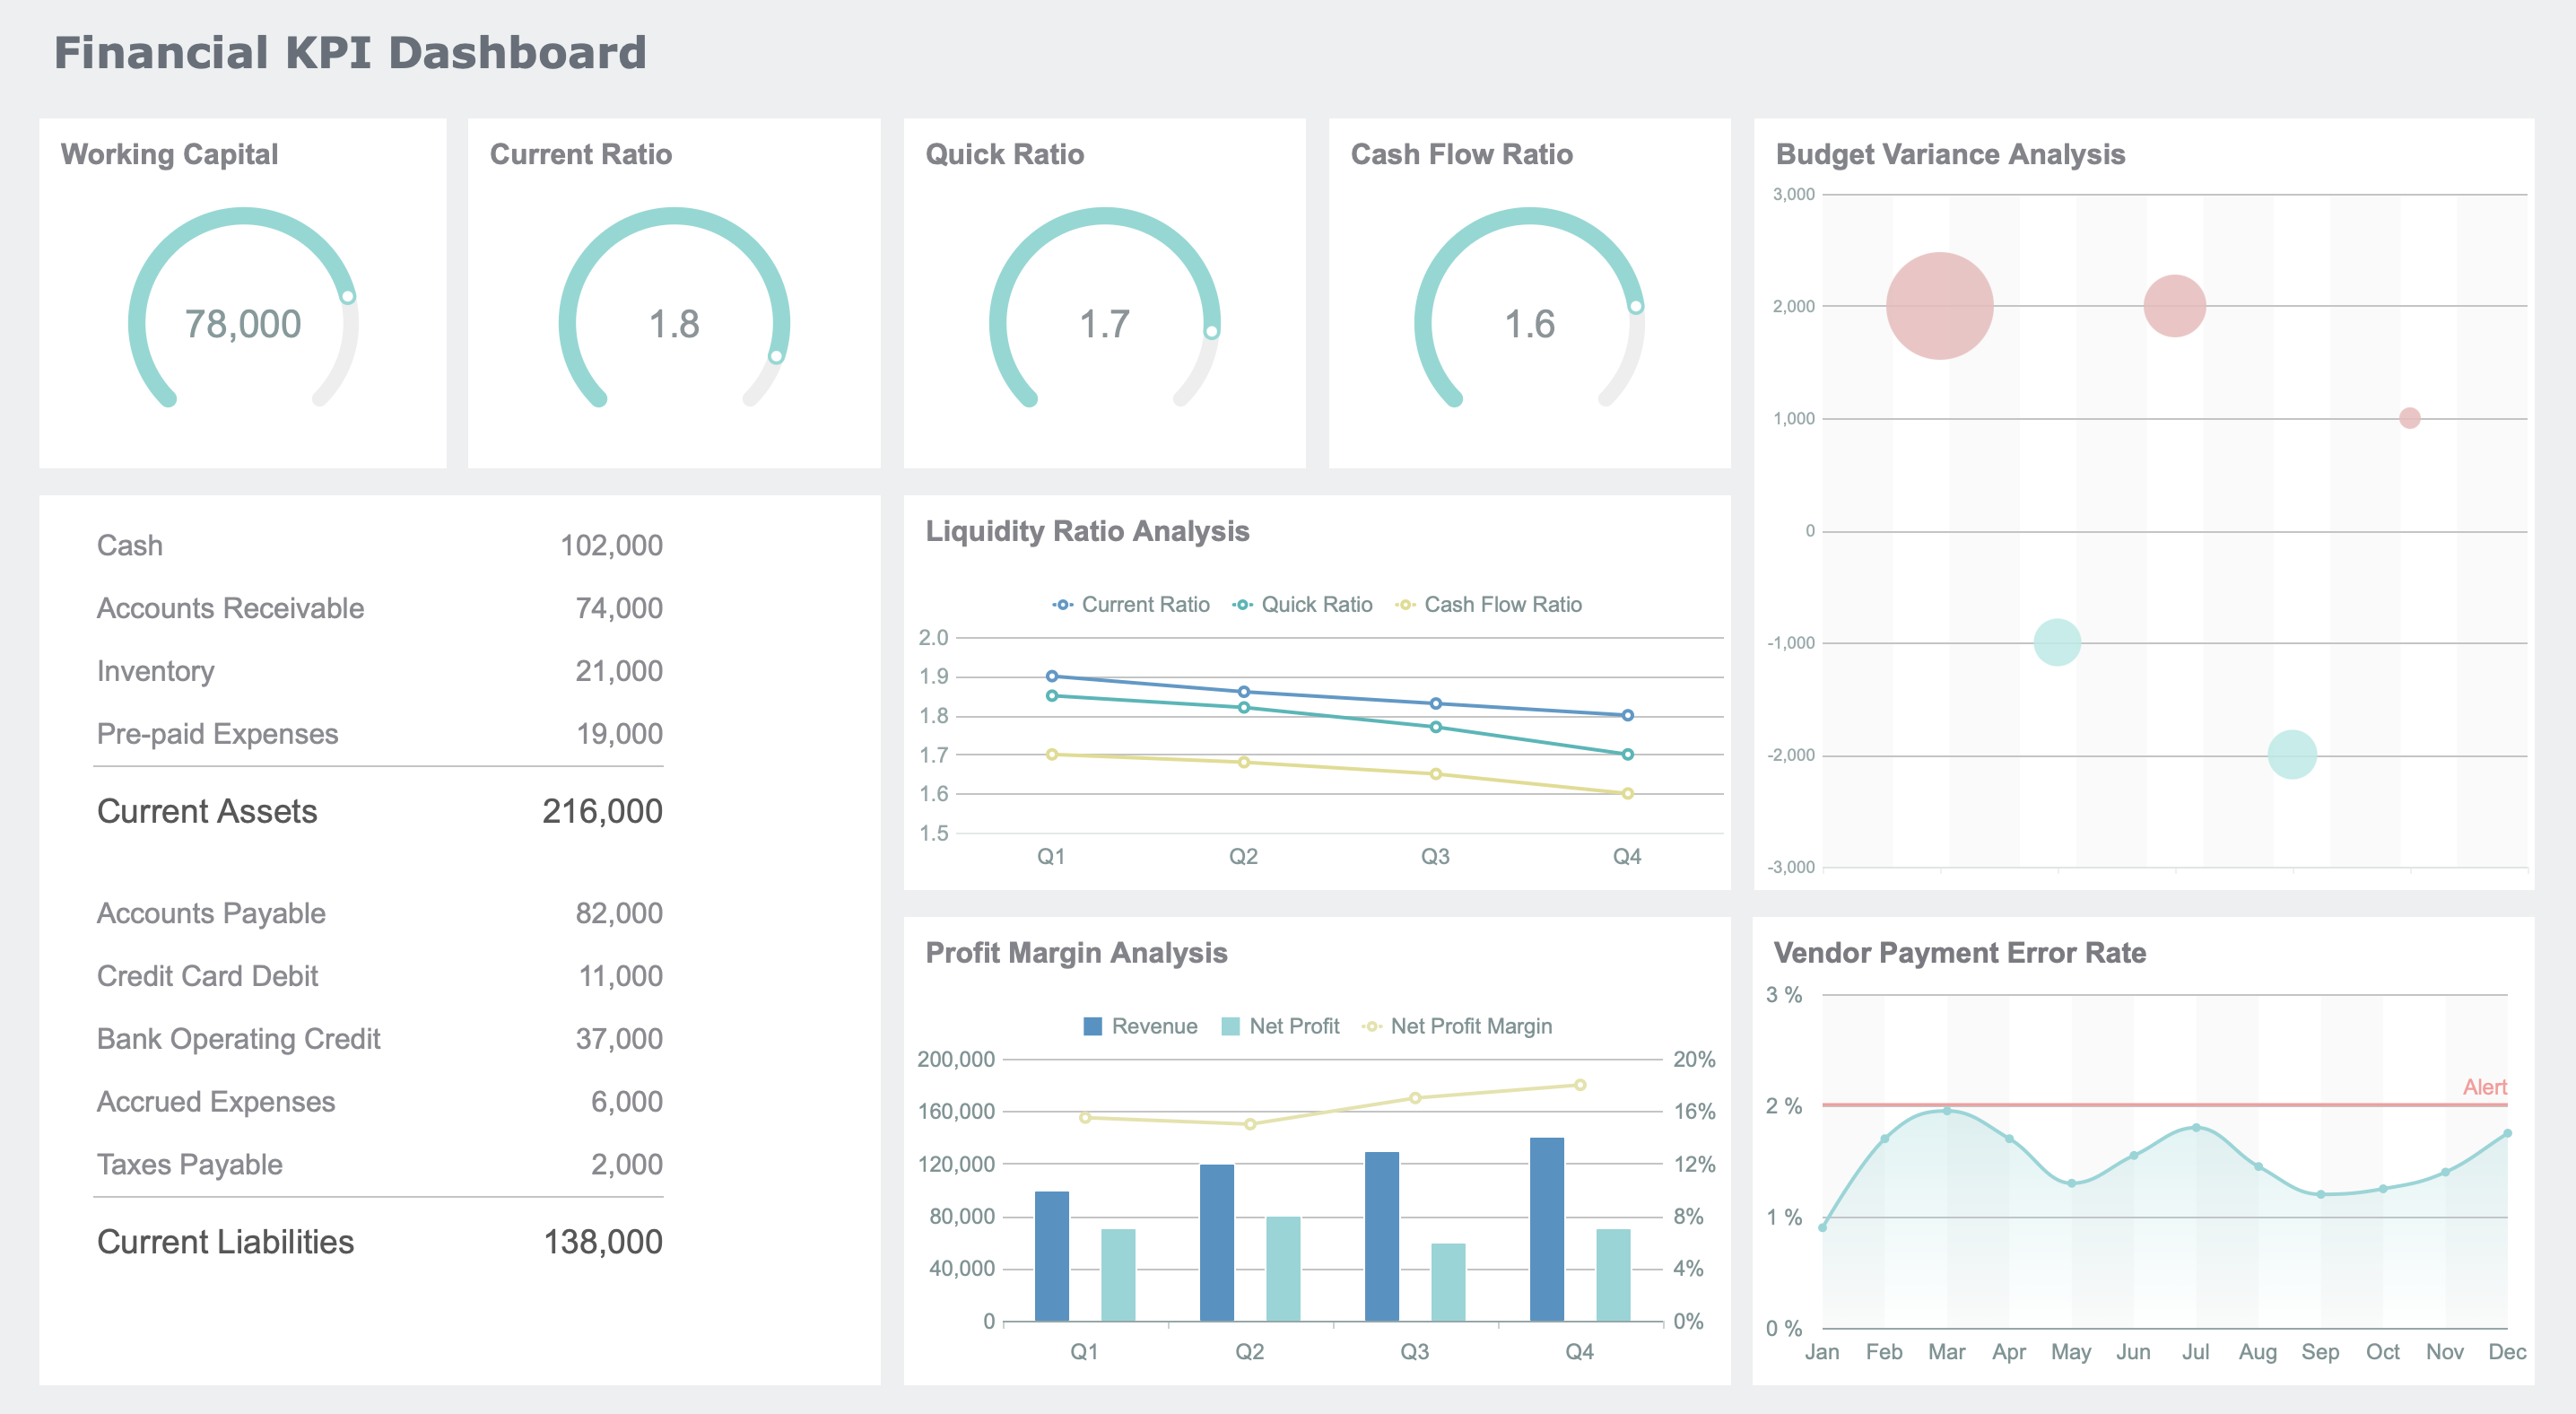
Understanding the difference between reporting and analytics helps you make smarter business choices. FanRuan and FineReport give you tools to boost growth and teamwork. See how organizations benefit:
| Benefit | Description |
|---|---|
| Enhanced Decision-Making | Make quick, informed choices with real-time insights. |
| Improved Productivity | Access data easily and speed up reporting. |
| Better Collaboration | Share information across teams for better results. |
| Real-Time Insights | Respond fast to market changes with up-to-date data. |
| Fewer Errors | Connect with ERP systems to reduce mistakes. |
To improve your own process:
Take time to review your reporting and analytics approach. Small changes can lead to big improvements.
Click the banner below to try FineReport for free and empower your enterprise to transform data into productivity!

The Author
Lewis
Senior Data Analyst at FanRuan
Related Articles

Self-Service Analytics Defined and Why You Need It
Self-service analytics lets you analyze data without IT help, empowering faster, data-driven decisions and boosting agility for your business.
Lewis
Jan 04, 2026

Best Self-Service Tools for Analytics You Should Know
See which self-service tools for analytics let business users access data, build dashboards, and make decisions faster—no IT help needed.
Lewis
Dec 29, 2025

Understanding Predictive Analytics Services in 2026
Predictive analytics services use data and AI to forecast trends, helping businesses make informed decisions, reduce risks, and improve efficiency in 2026.
Lewis
Dec 30, 2025