A ciso dashboard should help executives make better decisions about risk, investment, resilience, and accountability. Yet in many organizations, security leaders still present dashboards that are too technical, too crowded, or too disconnected from business priorities to influence action.
If you are a CISO, CIO, VP of Security, IT director, or risk leader, the problem is familiar: leadership wants clarity, not a data dump. They need to know what changed, what matters now, where the business is exposed, and what decisions are required this month or quarter. A dashboard that fails to answer those questions quickly will be ignored.
This guide explains how to design a ciso dashboard that executives actually use, what metrics matter most, how to structure the view for fast decision-making, and how to avoid the common reporting mistakes that destroy trust.
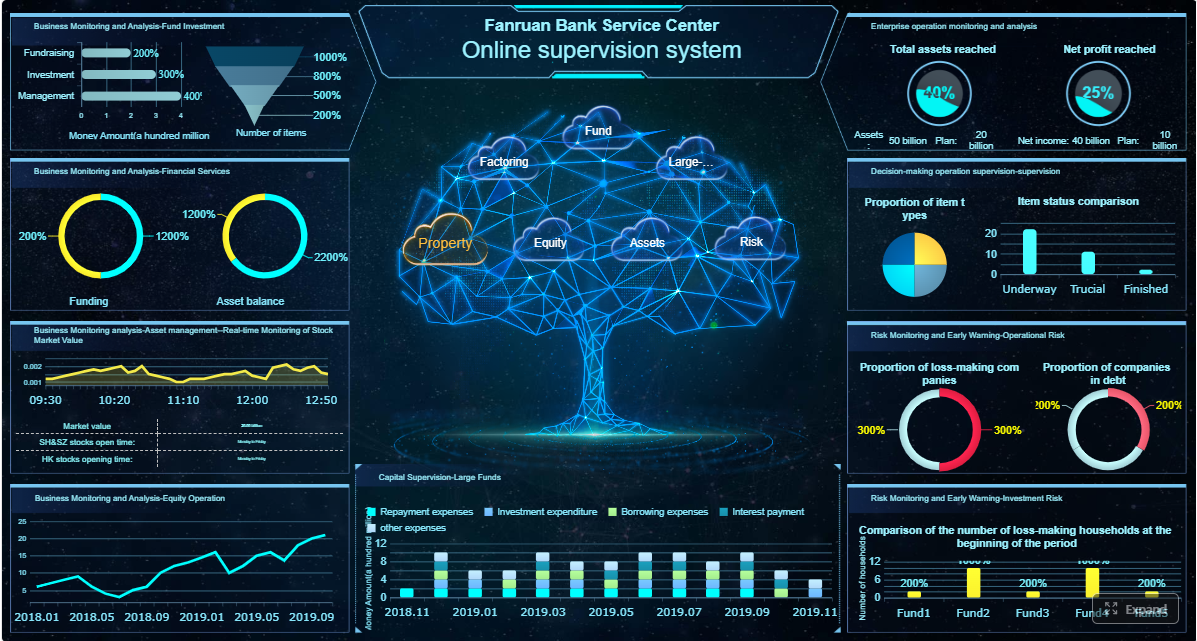
Click To Try The Dashboard
Why a CISO Dashboard Often Fails with Executives
The biggest reason a ciso dashboard fails is simple: most security reporting is built around what security teams can measure, not what executives need to decide.
Security teams naturally gravitate toward operational data: alert counts, scan results, severity distributions, patch volumes, or tool-specific outputs. But executives are not trying to run the SOC. They are trying to understand whether cyber risk is rising or falling, whether the organization is adequately protected, and whether management is taking the right actions.
When a dashboard leans too far into technical detail, three problems appear fast:
Overly technical metrics obscure the message. Terms like CVSS distributions, SIEM event volume, or endpoint telemetry may be useful operationally, but they rarely help a CFO or COO decide where to allocate resources.
Crowded visuals reduce confidence. A dashboard packed with charts, colors, and small widgets makes it harder to identify the few items that truly need executive attention.
Unclear ownership weakens accountability. If a risk is red but no one owns the remediation plan, the dashboard becomes a passive reporting artifact instead of a management tool.
Executives also lose trust when the dashboard feels static or disconnected from business context. Reporting that says “35 critical vulnerabilities remain open” is incomplete. Reporting that says “35 critical vulnerabilities remain open across two revenue-critical applications, both outside policy threshold, owned by the digital commerce and infrastructure teams, with remediation due in 14 days” is actionable.
What leaders actually need from a ciso dashboard is much narrower and much more strategic:
Priorities: What are the top risks right now?
Business impact: What could these risks affect in operations, revenue, compliance, or customer trust?
Risk movement: Is exposure improving, stable, or deteriorating over time?
Next actions: What decisions, approvals, or escalations are required?
If the dashboard does not answer those four questions in minutes, executives will stop using it.
What a CISO Dashboard Should Help Executives Do
A strong ciso dashboard is not just a status screen. It is a decision-support tool for leadership.
Its purpose is to help executives govern cyber risk in business terms. That means translating security posture into signals that support strategic oversight, budget prioritization, compliance readiness, and cross-functional accountability.
Used properly, the dashboard should help leadership:
Understand whether cyber risk is within tolerance
See whether major exposures are being reduced
Evaluate whether security investments are working
Identify where management attention is required
Track whether risk owners are delivering on commitments
This is why the best ciso dashboard is tied directly to a short list of recurring executive decisions. For most organizations, those decisions include:
Whether to fund or accelerate key remediation programs
Whether to accept, transfer, or reduce specific material risks
Whether a business unit or function is meeting required security obligations
Whether compliance readiness is on track
Whether leadership intervention is needed to unblock remediation
What is a CISO Cybersecurity Dashboard?
A CISO cybersecurity dashboard is an executive-level reporting view that brings together security, risk, identity, exposure, and compliance indicators into a clear picture of organizational cyber posture.
Its value is not in showing every available security metric. Its value is in making risk visible, showing movement over time, and pointing leaders toward specific actions.
It is different from operational SOC reporting or analyst dashboards in a few important ways:
Executive dashboards focus on business risk and decisions
SOC dashboards focus on detection, response, and workload
Analyst views focus on investigation detail and tool outputs
In other words, a SOC analyst may need to know which alerts fired in the last four hours. An executive needs to know whether incident frequency is increasing in a business-critical environment and whether response capability is performing within target.
Key Metrics (KPIs) Every Executive-Focused CISO Dashboard Should Consider
Below is a practical KPI set for a ciso dashboard. Not every organization needs all of them, but every metric should support a decision.
Enterprise Risk Posture: A summarized view of current cyber risk across critical business areas.
Risk Trend: Whether overall risk is increasing, stable, or declining over time.
Material Incidents: Security incidents with meaningful operational, financial, legal, or reputational impact.
Mean Time to Detect (MTTD): How quickly the organization identifies potential incidents.
Mean Time to Respond (MTTR): How quickly the organization contains and remediates incidents.
Critical Vulnerability Exposure: The number or rate of unresolved vulnerabilities in material assets or applications.
Remediation SLA Performance: The percentage of issues resolved within agreed timeframes.
Identity and Access Risk: Indicators such as privileged account sprawl, overdue access reviews, orphaned accounts, or excessive standing access.
Compliance Status: Readiness against required frameworks, audits, or regulatory obligations.
Control Health: Whether key preventive and detective controls are functioning as expected.
Policy Exceptions: Approved deviations that increase risk or require follow-up review.
Risk Ownership Coverage: The percentage of major risks with named owners, action plans, and due dates.
A useful rule: if a metric cannot trigger a discussion, a decision, or an action, it likely does not belong on the executive page.
9 Practical Tips to Build a Dashboard Executives Actually Use
1. Start with executive decisions, not security data
The most effective ciso dashboard starts with decision design, not data collection.
Before choosing a single metric, list the decisions executives need to make on a monthly or quarterly basis. For example:
Should we approve additional budget for identity modernization?
Is our current risk level acceptable in customer-facing systems?
Which unresolved issues require business owner escalation?
Are we prepared for the next audit or board review?
Then map each metric to a business question. If the metric does not help answer a question leaders care about, exclude it.
Consultant best practice: run a short stakeholder workshop with the CEO, CFO, CIO, legal, compliance, and major business unit leaders. Ask what they need to know, what they routinely ask for, and what would cause them to intervene. Build your first dashboard around those answers.
2. Limit the dashboard to a few high-value measures
Executives do not need exhaustive reporting. They need signal, not noise.
A better ciso dashboard emphasizes:
Trends over snapshots
Exceptions over totals
Material risks over broad inventories
Gaps that require action over background operational data
That means removing vanity metrics such as total blocked emails, raw alert volume, or long lists of closed tickets unless those figures directly support a strategic point.
A concise executive page often outperforms a sophisticated but overloaded one. In most cases, one page with 6 to 10 high-value indicators is enough.
Ask this question for every metric: Would leadership make a different decision if this number changed? If the answer is no, cut it.
3. Show business impact alongside cyber risk
Security metrics become meaningful to executives when they are connected to consequences.
Do not stop at reporting incidents, vulnerabilities, or control gaps. Explain what they could mean for the business:
Operational disruption
Revenue interruption
Regulatory exposure
Increased insurance pressure
Customer trust impact
Third-party or contractual risk
For example, instead of saying “privileged access review completion dropped to 71%,” say “privileged access review completion dropped to 71%, increasing the risk of unauthorized access across finance and ERP systems before quarter close.”
Use plain language. Avoid writing as if the dashboard is intended for practitioners only. If a non-technical executive cannot scan a note and understand the impact in seconds, rewrite it.
4. Make identity, access, and exposure visible
Identity is now one of the most important executive-level risk domains, yet many ciso dashboard designs still underrepresent it.
That is a mistake. Modern attacks often exploit credentials, excessive privileges, stale accounts, third-party access, and weak identity governance before they exploit deeper technical weaknesses.
Make identity and access posture visible with indicators such as:
Privileged accounts without current review
Orphaned or inactive accounts with elevated access
Standing privileged access versus just-in-time access
MFA coverage for high-risk users
Third-party access exceptions
Access certification completion rates
This matters because identity failures often have direct enterprise consequences. When executives can see access governance clearly, they can support policy enforcement, resourcing, and remediation across functions, not just inside security.
5. Use trends and thresholds instead of raw numbers alone
Raw numbers rarely tell leaders whether something is acceptable.
A ciso dashboard should show:
Current state
Previous period
Target
Tolerance or threshold
Direction of change
For example, “12 open critical findings” has limited value by itself. But “12 open critical findings, up from 7 last month, above threshold of 5, concentrated in two customer-facing applications” immediately communicates urgency.
Thresholds help executives focus. Trendlines help them judge progress. Together, they make it obvious where attention is needed now.
Use red, yellow, and green sparingly and consistently. A good rule is to reserve color for conditions tied to a defined threshold, not for decoration.
6. Simplify compliance reporting with real-time visibility
Compliance updates often become separate slide decks because leadership cannot quickly see audit readiness in the main dashboard.
A better approach is to make compliance visible in the ciso dashboard itself. Summarize:
Framework readiness status
Open audit gaps
Control testing health
Policy exceptions
Upcoming assessment milestones
Evidence collection status where relevant
This gives executives a single view of whether the organization is on track or drifting toward an avoidable compliance issue.
It also reduces reporting duplication across security, compliance, internal audit, and risk teams. Instead of rebuilding the same update repeatedly, leadership gets a live, shared view of posture and progress.
7. Separate strategic, operational, and technical views
One of the most common dashboard design failures is trying to satisfy every audience with one page.
That approach does not scale. Executives need a concise strategic view. Security managers need operational detail. Analysts need technical drill-downs.
The right model is layered reporting:
Strategic view: risk posture, business impact, compliance status, decisions required
Operational view: remediation pipelines, team performance, issue backlogs, control execution
This structure prevents executive meetings from being pulled into tactical detail while still allowing leaders to drill down when needed.
Think of the executive dashboard as the front door, not the entire building.
8. Assign owners and next steps for every red or yellow item
A dashboard without ownership creates awareness without action.
Every item marked red or yellow should include:
Named owner
Business or function responsible
Next action
Due date
Expected outcome
This turns the ciso dashboard into an operating mechanism for accountability. It also helps executives distinguish between known, managed risks and unmanaged drift.
A practical executive annotation might look like this:
Issue: Delayed privileged access reviews in finance systems
Owner: VP, Infrastructure and IAM Lead
Action: Complete reviews for top 50 privileged accounts
That level of clarity changes the conversation from “What is happening?” to “Are we on track?”
9. Review and refine the dashboard with executive feedback
No ciso dashboard is perfect on the first version. The only reliable way to improve adoption is to watch how leaders actually use it.
Test the dashboard with real stakeholders and ask:
Can you understand the page in under five minutes?
Which sections do you look at first?
Which metrics influence your decisions?
What feels unclear, unnecessary, or too technical?
What follow-up questions do you still need answered?
Then refine the wording, layout, thresholds, and annotations based on actual usage patterns, not internal assumptions.
Consultant best practice: track dashboard engagement over a few reporting cycles. If executives consistently skip a section or ask for the same clarification repeatedly, redesign that part. Executive reporting should evolve with the business, not remain fixed.
How to Structure the Dashboard for Clarity and Action
A ciso dashboard works best when it follows a simple, repeatable layout. Executives should be able to open the page and know exactly where to look first.
A practical structure looks like this:
Headline summary
Top risks
Trend indicators
Compliance status
Decisions needed
This order mirrors how leadership consumes information: overall status first, then material concerns, then direction, then obligations, then actions.
Example sections to include
Enterprise risk snapshot
Start with a compact summary of current cyber posture. This should communicate the overall state in one glance.
Include:
Overall risk rating or posture summary
Number of material risks above tolerance
Business units or environments most exposed
Short note on what changed since the last period
Use scorecards or a concise summary table here. Keep it high level.
Material incidents and exposure changes
This section should focus only on incidents or exposure shifts with executive relevance.
Include:
Significant incidents during the period
High-impact near misses
Changes in exposure in critical systems
Escalated third-party or concentration risks
A short annotated table often works better than multiple charts. The key is context: what happened, what it affected, and what management is doing next.
Identity and access posture
Because identity is a high-frequency attack path and a common control weakness, give it dedicated space.
Include:
Privileged access risk indicators
Access review completion
MFA or strong authentication coverage for sensitive groups
Orphaned or stale account exposure
Third-party access exceptions
A scorecard plus one trendline is often enough for the executive view.
Compliance and control status
This section should summarize audit readiness and control health without becoming a checklist.
Include:
Overall framework readiness
Open findings by severity or materiality
Controls operating outside tolerance
Policy exceptions and overdue remediation
Upcoming reporting or assessment deadlines
Heatmaps can be useful here if they are simple and clearly labeled. If the heatmap requires explanation, it is too complex for the top page.
Decisions, owners, and due dates
End with the most important operational governance block: what leaders need to approve, support, or escalate.
Include:
Decision required
Issue summary
Owner
Deadline
Status
This is where the dashboard becomes a tool for executive action, not just awareness.
When to use tables, scorecards, heatmaps, and annotations
Different visual forms serve different purposes. Choose the one that makes the point fastest.
Tables: Best for issues with owners, due dates, and comments
Scorecards: Best for headline KPIs and current status
Heatmaps: Best for simple risk concentration views across business units or categories
Trendlines: Best for showing movement over time
Annotations: Best for explaining why a metric changed and what it means
Do not over-visualize. In executive settings, one clear table often beats four decorative charts.
Common Mistakes to Avoid When Building Executive Security Dashboards
Even mature organizations fall into predictable traps when building a ciso dashboard.
Copying analyst dashboards directly into board or leadership reporting
Analyst dashboards are designed for investigation and control execution. Executives need synthesis, prioritization, and implications. Reusing operational layouts creates confusion and weakens executive engagement.
Including too many charts without a clear narrative
More charts do not create more value. Without a clear story, the dashboard becomes a collage of activity. Each section should answer a specific question and point toward a decision.
Reporting status without context, ownership, or recommended actions
A red indicator alone is not enough. Leaders need to know what caused it, who owns it, and what happens next. Otherwise the report triggers concern without enabling action.
Failing to update definitions and thresholds as the business changes
As the organization grows, enters new markets, changes architecture, or adopts new regulatory obligations, old thresholds may stop reflecting material risk. Review KPI definitions regularly so the dashboard stays aligned with current business reality.
Final Checklist for a Dashboard Leaders Will Revisit
Before finalizing your ciso dashboard, run this checklist:
Does every metric answer a decision-oriented question?
Can an executive understand the page in under five minutes?
Are risk, compliance, identity, and ownership all clearly visible?
Do trendlines and thresholds show where attention is needed now?
Is every red or yellow item paired with an owner and due date?
Are strategic, operational, and technical views separated?
Does the dashboard use plain business language rather than tool language?
Has executive feedback been incorporated into the latest version?
If you cannot answer yes to most of these, the dashboard is probably still too operational.
Build Faster and Smarter with FineReport
Designing an executive-ready ciso dashboard manually is possible, but it is rarely efficient. You have to unify data from security tools, compliance systems, IAM platforms, spreadsheets, and business records, then maintain layout logic, drill-downs, thresholds, and update cycles. That complexity is exactly why many dashboard efforts stall or become stale.
Building this manually is complex; use FineReport to utilize ready-made templates and automate this entire workflow.
FineReport helps security and risk leaders turn fragmented reporting into a structured executive dashboard that is easier to maintain and easier for leadership to trust. With FineReport, teams can:
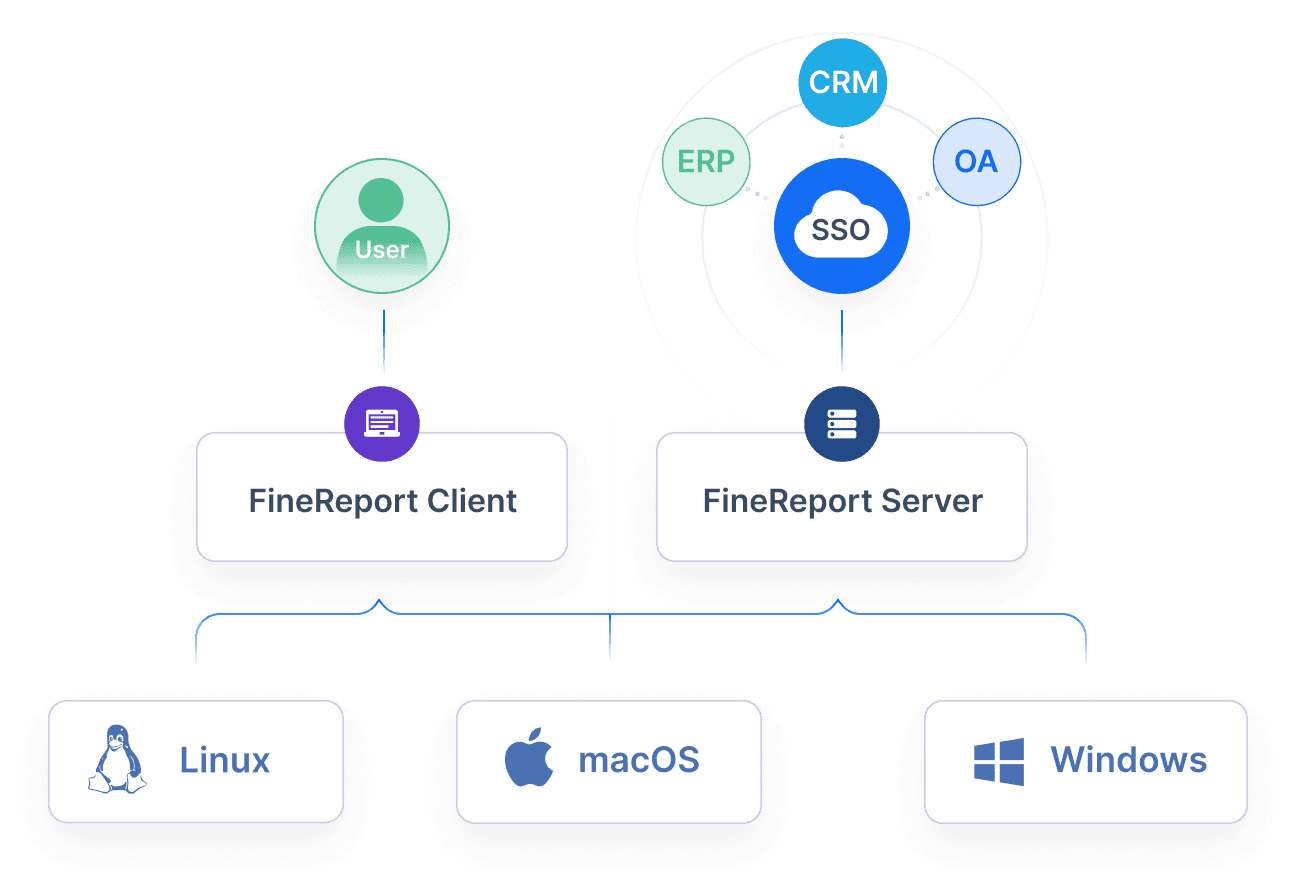
Connect data from multiple systems into one reporting layer
Build role-based views for executives, managers, and technical teams
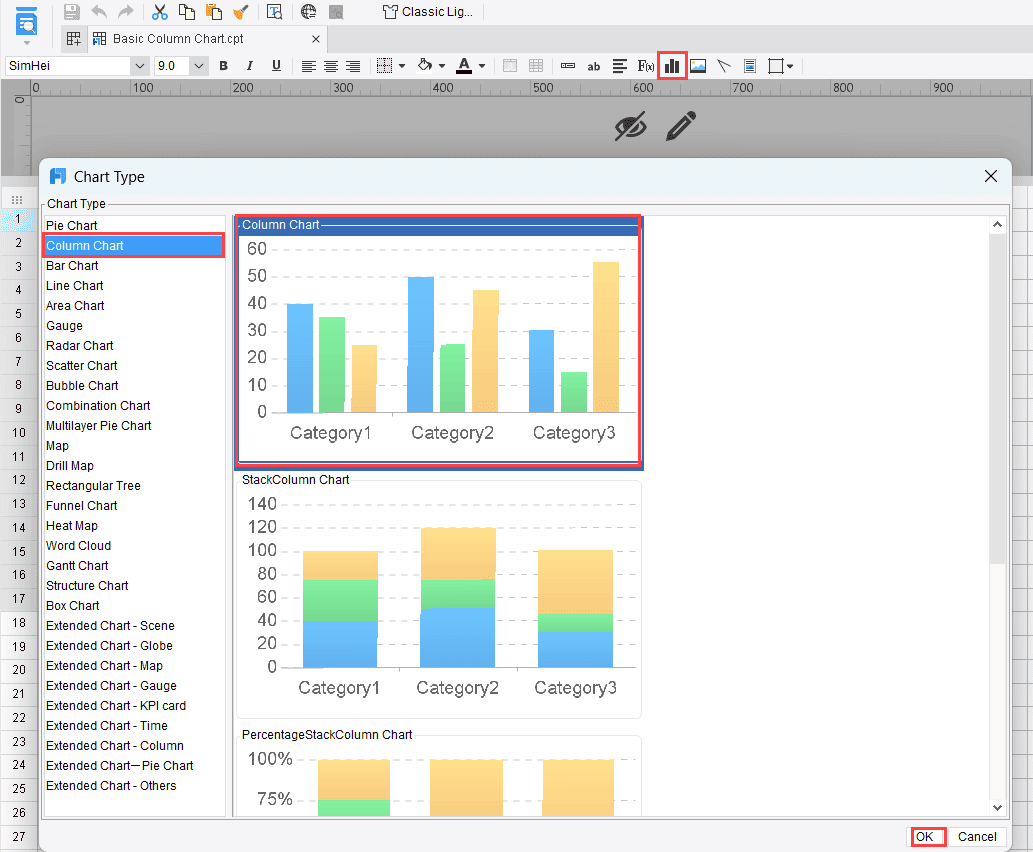
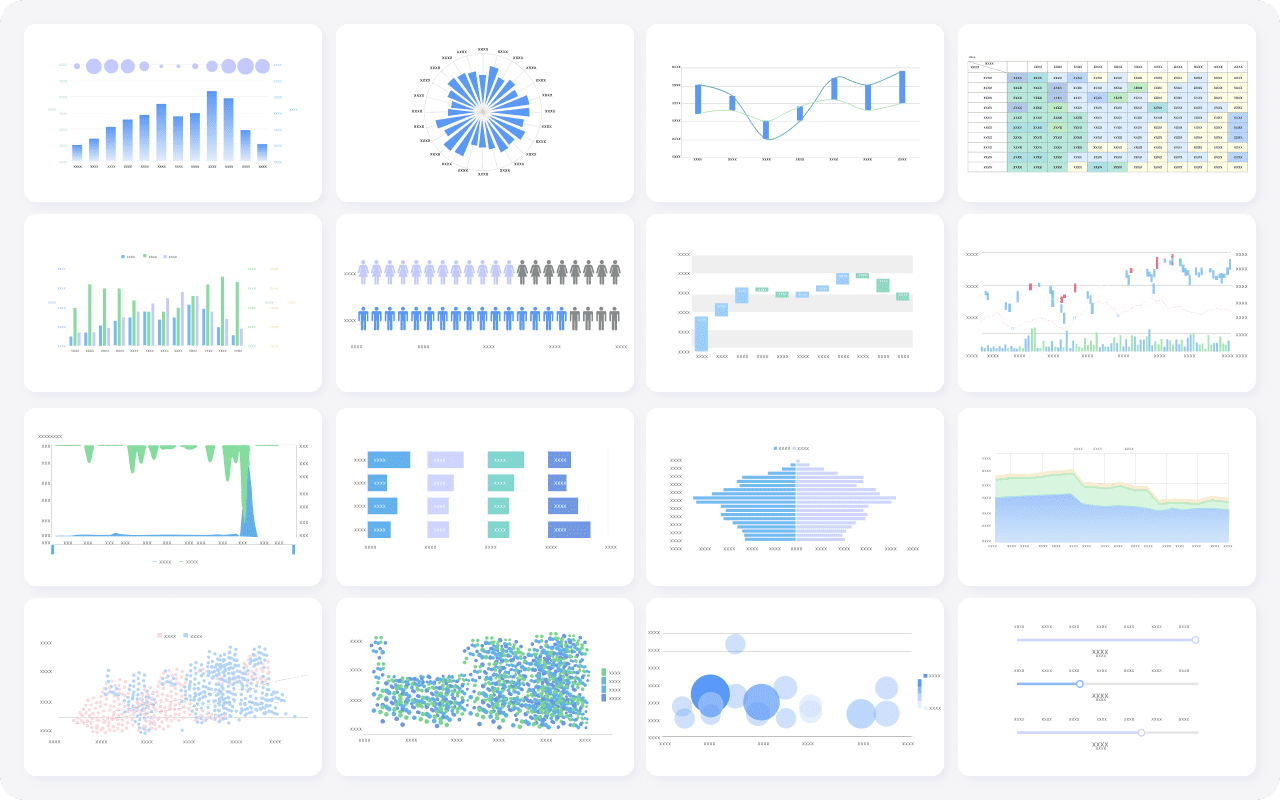
Use ready-made dashboard templates to accelerate design
Automate recurring updates and reduce manual slide creation
Add drill-down paths without cluttering the executive summary
Standardize KPI definitions, thresholds, and ownership fields
For enterprise teams, that means less time assembling reports and more time driving action. Instead of rebuilding the same ciso dashboard every reporting cycle, you can create a repeatable system that supports leadership oversight, compliance reporting, and risk accountability at scale.
If your goal is to create a ciso dashboard executives actually use, the winning formula is clear: fewer metrics, better business context, visible ownership, and a platform that makes the process sustainable. FineReport gives you the structure and automation to make that happen.
FAQs
It should show the top risks, their business impact, whether exposure is improving or worsening, and what decisions or escalations are needed. If leaders cannot grasp those points quickly, the dashboard is unlikely to drive action.
A CISO dashboard is built for executive oversight, risk governance, and investment decisions. A SOC dashboard is more operational and focuses on alerts, investigations, and analyst workload.
The most useful metrics are enterprise risk posture, risk trend, material incidents, MTTD, MTTR, critical vulnerability exposure, compliance status, and remediation ownership. The right set depends on which decisions leadership needs to make regularly.
They usually fail because they are too technical, too crowded, or disconnected from business priorities. Trust also drops when metrics lack context, trend data, or clear ownership for remediation.
It should be updated often enough to reflect meaningful change, typically monthly for executives and quarterly for boards, with faster refreshes for major incidents or material risks. The key is keeping the data timely, consistent, and decision-ready.
Product Trial
FineReport
Pixel-perfect reports · Interactive dashboards · Easy data entry · Digital twins