An effective asset management report is not a passive inventory export. It is a decision tool that helps IT leaders, finance teams, operations managers, and auditors control spend, reduce operational and compliance exposure, and prepare evidence faster when reviews happen. If your current reporting relies on spreadsheets, disconnected systems, or manual reconciliation, you are likely missing savings opportunities, carrying hidden risk, and wasting valuable time before every audit cycle.
Click To Try The Dashboard
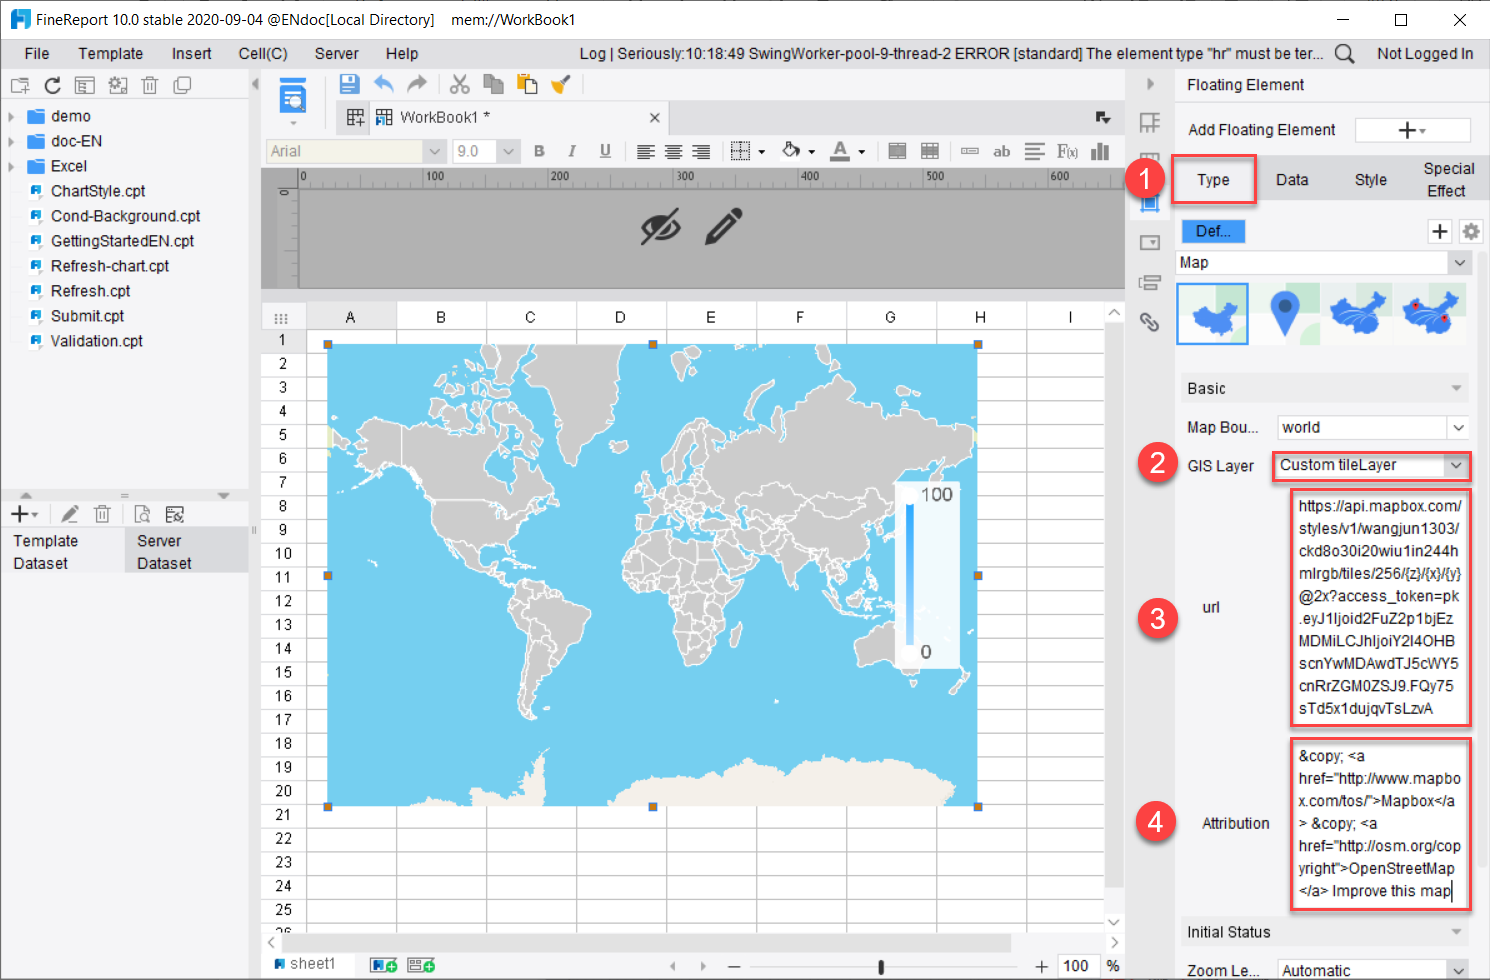
All reports in this article are built with FineReport
A strong asset management report should do four things well: support cost control, reduce risk, improve compliance readiness, and shorten audit preparation time. That means the report must go beyond raw asset listings and present information in a way that supports action.
Define the report’s purpose
Before designing a report, define exactly what business outcomes it should drive. In most organizations, the core purposes are:
Cost control: identify waste, duplicate purchases, and unnecessary renewals
Risk reduction: expose unsupported, unpatched, or poorly governed assets
Compliance readiness: maintain evidence for internal controls, license obligations, and regulatory reviews
Faster audit preparation: organize records so teams can respond quickly without manual scrambling
If the report tries to serve every purpose equally, it becomes bloated and unfocused. Start with the most urgent operational need, then build outward.
Clarify the audience
Different stakeholders need different views of the same data. A useful report should support at least these audiences:
IT leaders: need lifecycle, security, and operational status
Finance teams: need spend, depreciation, renewal exposure, and cost-center mapping
Operations managers: need availability, ownership, usage, and replacement priorities
Auditors and compliance teams: need traceability, control evidence, timestamps, and exception logs
This is where many reporting efforts fail. They produce one generic report for everyone. High-performing teams create role-based views from a shared data model.
List the core data categories
Every reliable asset management report should pull from a consistent set of data categories. At minimum, include:
Hardware assets: laptops, servers, mobile devices, network gear, peripherals
A report only stays valuable if it is reviewed on a useful cadence. Weekly reporting may make sense for fast-changing environments. Monthly or quarterly reviews are often better for executive decision-making and budget management.
Set clear goals such as:
reduce unused software licenses by 15%
cut renewal waste by 10%
lower unsupported asset count each quarter
reduce audit preparation time from two weeks to three days
Key Metrics (KPIs)
To make the report actionable, track a small set of high-value KPIs consistently.
Asset utilization rate: percentage of deployed assets actively used; helps uncover idle devices and unused licenses
Unused asset recovery value: estimated savings from reclaimed hardware, software, or subscriptions
End-of-life asset count: number of assets past support or nearing retirement; highlights refresh risk
Warranty expiration exposure: value or count of assets with expired or soon-to-expire coverage
License compliance position: gap between installed use and purchased entitlement
Total cost of ownership by asset class: acquisition, maintenance, support, and renewal costs combined
Renewal avoidance value: savings generated by canceling or consolidating contracts before renewal
Data accuracy rate: percentage of asset records that are complete, current, and validated
Audit prep time: time required to gather evidence and prepare reports for review
Exception closure rate: percentage of identified issues remediated within target timeframes
Build a Reliable Data Foundation
The quality of your asset management report depends entirely on the quality of the underlying data. If asset records are fragmented, duplicated, or outdated, the report will look polished but still drive poor decisions.
Identify the systems and records to pull from
Most organizations already have asset data, but it is spread across multiple systems. The goal is to bring those sources together into one reporting layer.
Common inputs include:
discovery and inventory tools
CMDB platforms
procurement and ERP records
software license management systems
service desk and ticketing platforms
spreadsheet trackers maintained by local teams
vendor contract and warranty databases
A consultant’s recommendation: do not start by chasing perfect completeness. Start by mapping your highest-value sources and identifying which system owns each critical field.
Once data is collected, clean it aggressively. This is the step that determines whether stakeholders trust the report.
Focus on these fixes first:
remove duplicate asset records
fill missing owner, location, and status fields
standardize device names and categories
align lifecycle definitions across departments
normalize vendor and product naming conventions
reconcile asset IDs across systems
For example, one team may label a device as "in use," another as "deployed," and another as "active." If you do not standardize status definitions, trend analysis becomes unreliable.
Create a reporting structure that supports decision-making
Do not organize the report around how the data was collected. Organize it around how decisions are made.
Useful dimensions include:
business unit
owner
criticality
lifecycle stage
cost center
location
vendor
contract renewal period
This structure makes it easy to answer practical questions such as:
Which business unit has the highest concentration of aging devices?
Which cost centers are carrying unused licenses?
Which critical assets are operating without warranty coverage?
Use the Report to Cut Costs and Improve Efficiency
The fastest way to prove the value of an asset management report is to show financial impact. Cost reduction does not come from reporting alone. It comes from surfacing waste clearly enough that managers act on it.
Highlight underused, redundant, and aging assets
Unused assets quietly drain budgets. That includes dormant laptops, overprovisioned software licenses, duplicate subscriptions, and aging equipment that costs more to support than replace.
Aging assets are especially important. They create a double burden: higher support cost and higher operational risk.
Track total cost and lifecycle spending
If your report only lists acquisition cost, it will miss the real economics of asset ownership. Mature reporting compares cost across the full lifecycle.
Track:
purchase cost
deployment cost
maintenance and support cost
warranty extension cost
renewal or subscription cost
repair and incident cost
disposal or decommissioning cost
This allows leaders to see when keeping an asset is more expensive than replacing it.
Prioritize actions with the highest financial impact
Not every recommendation should be treated equally. Rank findings by:
expected savings
urgency
implementation effort
risk if delayed
That creates a prioritized action list rather than a static report.
For example:
reclaim 120 unused SaaS licenses with immediate savings
retire duplicate endpoint tools at next renewal
replace unsupported servers in critical environments
consolidate low-usage device pools in regional offices
Reduce Risk and Strengthen Compliance
A mature asset management report is not just about saving money. It also protects the business from avoidable security, operational, and contractual failures.
Flag security, operational, and contractual risks
The report should clearly identify assets that introduce elevated exposure, including:
The most effective reports do not simply list risks. They classify them by severity, business impact, and remediation owner.
Connect asset visibility to governance and resilience
Good asset visibility strengthens governance because leaders can see what exists, who owns it, where it sits, and what condition it is in. That supports:
business continuity planning
financial oversight
policy enforcement
access and ownership accountability
incident response and recovery planning
When a disruption happens, incomplete asset reporting slows response. When reporting is accurate, teams can identify dependencies and act faster.
Prepare evidence for internal reviews and external requirements
Audit and compliance teams need evidence that is consistent, traceable, and easy to verify. Your report should organize key records in one repeatable format, including:
ownership assignments
change history
license positions
support status
approval records
exception logs
remediation status
This reduces the last-minute burden on IT, finance, procurement, and security teams.
Design the Report for Faster Audit Preparation
Audit preparation becomes painful when evidence is scattered across email threads, spreadsheets, ticket systems, and procurement files. A well-designed asset management report turns that chaos into a structured workflow.
Include the sections auditors look for first
Auditors typically want a fast way to validate scope, ownership, controls, and open issues. Make that easy by including summary sections for:
linked ticket, contract, or change record where relevant
This makes it easier for reviewers to test samples without asking your team to reconstruct history manually.
Turn the report into a repeatable audit workflow
The best audit-ready reporting process is operational, not one-off. Build a workflow that includes:
assigned owners for each data domain
scheduled update checkpoints
review and approval steps
version history for every reporting cycle
exception logging and closure tracking
This transforms audit prep from a fire drill into a repeatable control process.
Maintain and Improve the Reporting Process
A useful asset management report is never finished. As your environment changes, your reporting must evolve with it.
To keep the process relevant:
establish a monthly or quarterly review cadence based on asset volume and risk
track KPI trends, not just current-state snapshots
refine fields and logic as regulations, vendors, and technologies change
review lessons learned after audits, renewals, and lifecycle programs
share findings with finance, procurement, security, and operations teams
Best practices for implementation
If you want this reporting process to succeed in a real enterprise environment, follow these proven steps:
Start with one decision use case.
Choose a priority such as renewal optimization, end-of-life risk, or audit readiness. Build the first report around that outcome.
Establish data ownership early.
Assign responsibility for core fields such as owner, lifecycle stage, cost center, and contract status. Reports improve when accountability is clear.
Standardize definitions before automating.
Agree on terms like active, retired, unsupported, and unused. Automation only scales consistency if definitions are already aligned.
Design role-based views.
Executives need summaries, managers need trends, and auditors need traceability. One shared model can support multiple report views.
Close the loop with action tracking.
Every major finding should have an owner, due date, status, and expected impact. Reporting without follow-through delivers little business value.
Build the Asset Management Report Faster With FineReport
Building this manually is complex; use FineReport to utilize ready-made templates and automate this entire workflow.
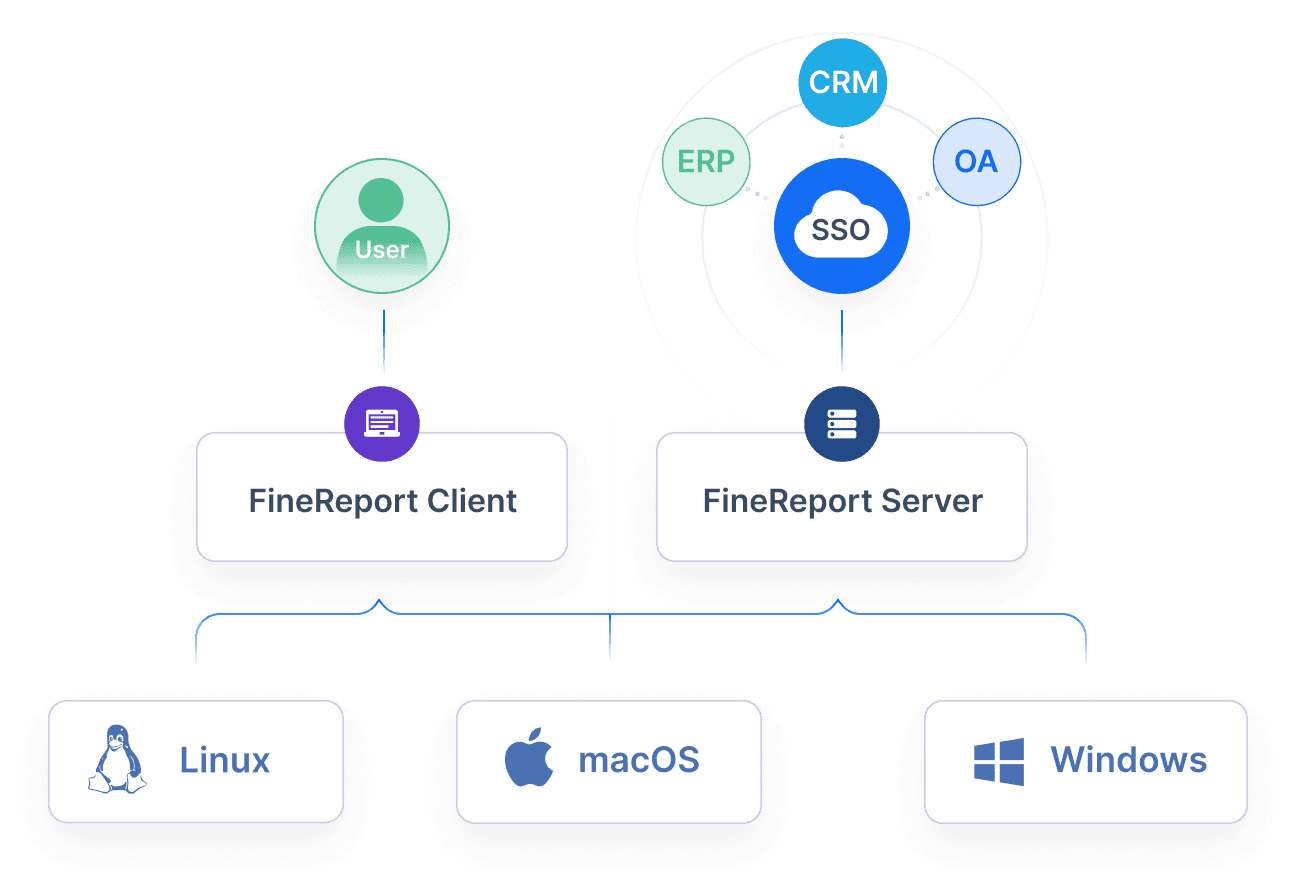
FineReport helps teams move from fragmented asset data to audit-ready, decision-oriented reporting without relying on endless spreadsheet maintenance or custom-coded dashboards. It is especially valuable when multiple departments need different views of the same asset data.
integrate data from CMDBs, ERP systems, service desks, and discovery tools
build role-based dashboards for IT, finance, operations, and auditors
automate recurring report generation on a monthly or quarterly cadence
visualize KPIs such as unused asset recovery, renewal exposure, lifecycle risk, and audit readiness
drill from executive summaries into asset-level detail
maintain version history and standardized output for review cycles
For enterprise teams, that means less time assembling data and more time acting on insights. Instead of chasing records across disconnected tools, you can centralize reporting logic, standardize metrics, and distribute trusted dashboards across the business.
If your goal is to cut costs, lower risk, and speed up audit prep, a modern reporting platform is no longer optional. It is the fastest route to turning asset data into measurable business outcomes.
A useful asset management report should include asset inventory, ownership, lifecycle stage, usage, location, warranty status, contract details, and a small set of KPIs tied to cost, risk, and compliance. The goal is to turn asset data into decisions, not just document what exists.
Review frequency depends on the decision cycle and how quickly your environment changes. Weekly works well for operational monitoring, while monthly or quarterly reviews are often better for budgeting, compliance, and executive oversight.
The most useful KPIs usually include asset utilization rate, unused asset recovery value, end-of-life asset count, warranty expiration exposure, license compliance position, and audit prep time. Choose metrics that directly support the business outcome you want to improve.
It centralizes records, timestamps, ownership details, and exception tracking so teams can produce evidence faster. This reduces manual reconciliation and helps auditors verify controls without last-minute scrambling.
Start with a clear objective, tailor views for each audience, and use current data from connected systems. The report should highlight exceptions, trends, and savings opportunities so each finding leads to a specific action.
Product Trial
FineReport
Pixel-perfect reports · Interactive dashboards · Easy data entry · Digital twins