An investment performance report should help executives make better decisions on capital allocation, manager oversight, and portfolio risk without forcing them to decode analyst-level detail. For CIOs, CFOs, investment committees, and operations leaders, trust comes down to four things: accuracy, consistency, relevance, and speed. If the report arrives late, changes definitions month to month, buries caveats, or overloads readers with data, it will not influence decisions no matter how sophisticated the analytics are.
Click To Try The Dashboard
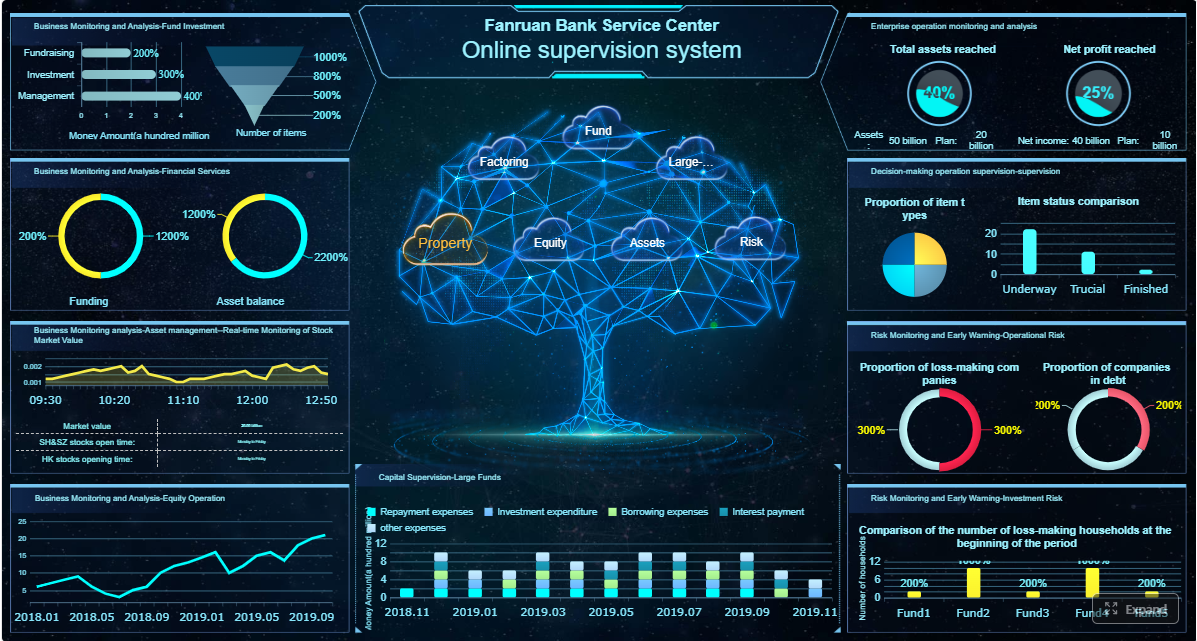
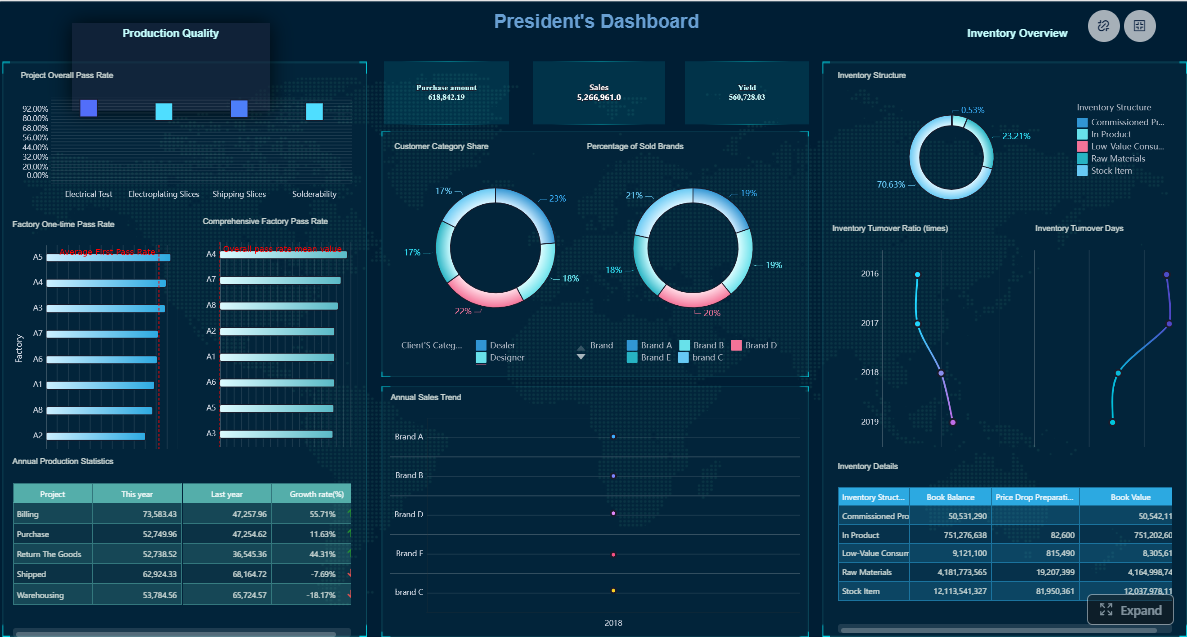
All reports in this article are built with FineReport
What executives expect from an investment performance report
Senior leaders do not want a reporting pack designed around how analysts calculate numbers. They want a decision tool. That means the report must clearly answer three questions: What happened? Why did it happen? What should we do next?
An executive-ready investment performance report should support decisions such as:
Capital allocation: Which asset classes, strategies, or managers deserve more or less capital?
Manager oversight: Who outperformed or underperformed, and was it skill, style, or market effect?
Risk review: Did the portfolio take the intended risks, and are exposures still aligned with policy?
Strategy validation: Are outcomes consistent with stated investment objectives and mandate constraints?
Governance and escalation: Are there issues that require committee action, rebalancing, or deeper review?
“Trustworthy” has a precise meaning in this context. Executives expect:
Accuracy: Reported returns, exposures, and benchmarks must reconcile to source systems.
Consistency: Definitions, periods, benchmarks, and grouping logic should not shift without explanation.
Relevance: The first page should focus on issues that change decisions, not everything available in the data warehouse.
Speed: Reporting must arrive in time to influence meetings, rebalances, and oversight actions.
The most common failure is building reports around internal workflows rather than executive priorities. Analysts often optimize for completeness. Executives optimize for clarity and action. A trusted investment performance report closes that gap.
Core elements of an investment performance report
A credible report needs more than performance tables. It must connect results, risk, attribution, and methodology in a format that can withstand executive scrutiny.
Performance summary at a glance
The opening view should present headline performance in a way that can be understood in seconds. Executives should not have to flip pages to compare portfolio returns with benchmarks or prior periods.
At minimum, the summary should include:
Total portfolio return: The primary performance figure for the selected period.
Benchmark return: The relevant comparator for mandate or strategy evaluation.
Excess return: Portfolio return minus benchmark return.
Period-over-period change: Direction and magnitude versus previous month, quarter, or year.
Net asset value or ending market value: Scale matters when assessing significance.
Top positive and negative contributors: Immediate insight into what moved the result.
A strong summary page prioritizes the few metrics that matter most. Everything else belongs in supporting sections.
Returns without context are not decision-grade. Executives need to understand whether the outcome came from market exposure, allocation choices, security selection, currency moves, or manager behavior.
A robust investment performance report should separate these drivers:
Market effect: Performance resulting from broad market movement.
Asset allocation effect: Impact of overweight or underweight positions versus policy or benchmark.
Manager or security selection effect: Contribution from choosing specific managers, funds, or securities.
Currency effect: Gain or loss driven by foreign exchange exposure.
Interaction effects: Combined effects where allocation and selection reinforce or offset each other.
Risk context is equally important. The report should show whether risk increased or decreased and whether that change was intentional.
Useful risk indicators include:
Volatility: How variable returns were over the reporting horizon.
Maximum drawdown: Largest peak-to-trough decline.
Tracking error: Degree of deviation from benchmark behavior.
Beta or market sensitivity: Exposure to broad market movement.
Concentration indicators: Exposure to top holdings, sectors, geographies, or managers.
Liquidity profile: Ability to rebalance or meet cash needs without disruption.
This is where trust is either reinforced or lost. Executives do not need a math lecture, but they do need confidence that numbers are grounded in a stable methodology.
Every report should clearly state:
Data sources: Custodians, administrators, portfolio systems, market data vendors, and benchmark providers.
Valuation timing: Cutoff time, stale price handling, and treatment of late adjustments.
Benchmark definitions: Index names, composite logic, and rebalancing rules.
Calculation methodology: Time-weighted return, money-weighted return, attribution model, net versus gross performance.
Assumptions and limitations: Pricing gaps, estimated valuations, illiquid assets, or pending corrections.
Restatements: Any revised figures from prior periods and why they changed.
When methodology is visible, revisions become manageable rather than credibility-damaging.
Key Metrics (KPIs)
Below are the essential KPIs most executives expect in an investment performance report:
Total Return: Overall portfolio gain or loss for the selected period.
Benchmark Return: Return of the agreed comparator index or custom benchmark.
Excess Return: Difference between total return and benchmark return.
Annualized Return: Standardized return across longer time periods for fair comparison.
Time-Weighted Return (TWR): Performance measure excluding the impact of external cash flows.
Money-Weighted Return (MWR/IRR): Investor-specific return reflecting timing of contributions and withdrawals.
Contribution to Return: How much each asset class, strategy, or manager added to total performance.
Allocation Effect: Return impact from deviating from benchmark weights.
Selection Effect: Return impact from choosing better or worse investments within a category.
Volatility: Degree of return fluctuation over time.
Maximum Drawdown: Largest observed decline from a prior peak.
Tracking Error: Variability of excess returns relative to the benchmark.
Sharpe Ratio: Risk-adjusted return relative to total volatility.
Beta: Sensitivity of portfolio returns to benchmark or market movements.
Exposure by Asset Class: Current distribution across equities, fixed income, alternatives, cash, and others.
Concentration Ratio: Share of portfolio held in top positions, sectors, or managers.
Liquidity Ratio: Portion of the portfolio that can be converted to cash within a defined timeframe.
Currency Exposure: Allocation and sensitivity by base and foreign currencies.
How to structure reporting so leaders can understand investment performance quickly
The structure of the report determines whether executives absorb it or ignore it. A clear reporting sequence reduces meeting time, accelerates decisions, and cuts clarification requests.
Start with an executive summary
The first page should not be a data dump. It should be a concise decision brief.
Lead with:
The most important performance outcome
The benchmark gap
The top two or three drivers
The most relevant risk change
Any action or escalation needed
Use plain language. Instead of writing, “Relative underperformance was driven by sector allocation misalignment,” say, “The portfolio lagged the benchmark mainly because we were underweight large-cap technology during the rally.”
This summary should help a board member or CFO understand the situation in under two minutes.
Build from summary to supporting detail
After the executive summary, move logically from high-level to granular analysis.
A practical sequence is:
Portfolio-level performance
Benchmark comparison
Asset class or strategy breakdown
Manager-level analysis
Risk and exposure review
Methodology, caveats, and appendices
This structure lets readers drill down only when needed. It also avoids the common mistake of forcing executives through pages of detail before they understand the headline conclusion.
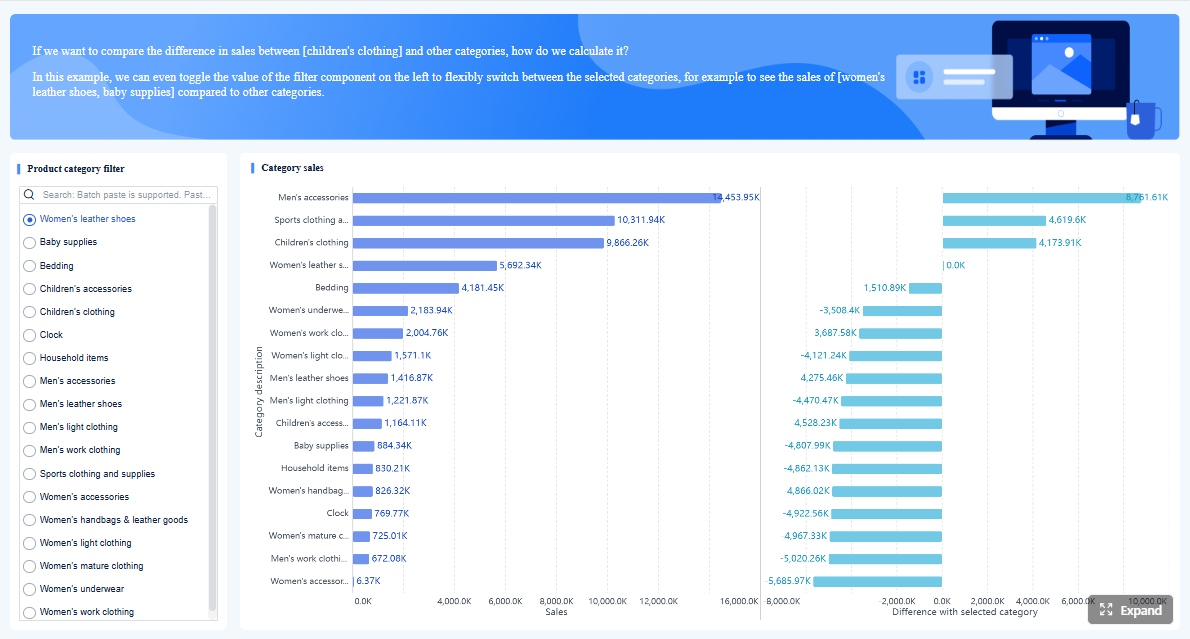
Use visuals that make comparisons obvious
Good visuals reduce cognitive load. Poor visuals create ambiguity.
Prioritize charts and tables that make comparison immediate:
Trend lines for returns over time
Bar charts for benchmark gaps across periods
Waterfall charts for attribution
Heatmaps for manager or asset class performance
Exposure tables for portfolio composition and concentration
Traffic-light indicators for policy breaches or watchlist items
Avoid decorative charts, excessive color variation, 3D effects, or visuals that hide scale differences. If a chart does not sharpen interpretation, remove it.
Common mistakes that weaken trust in investment performance reporting
Trust is easier to lose than to build. Most reporting problems are not caused by lack of data, but by lack of discipline in how the data is presented and governed.
Too much data, not enough interpretation
Many investment teams assume more detail signals rigor. Executives usually read that as noise.
Common symptoms include:
Too many tables with no narrative
Every metric shown at once
No prioritization of material issues
Technical language without business implications
A good investment performance report translates analysis into governance impact. For example: “Small-cap manager underperformance reduced portfolio return by 42 basis points and triggered a watchlist review under the oversight policy.”
Inconsistent definitions and benchmarks
Nothing damages credibility faster than numbers that cannot be compared from one cycle to the next.
Typical issues include:
Changing return periods without explanation
Renaming benchmarks or composites inconsistently
Reclassifying asset groups mid-year
Mixing net and gross figures in different sections
Standardization is non-negotiable. If methodology changes, document it prominently and show the effect on comparability.
Hidden caveats and delayed corrections
Executives can accept imperfect data. They do not accept surprises.
Weak reports often bury issues such as:
Estimated values for illiquid holdings
Late custodian files
Benchmark restatements
Reclassified transactions
Pending price challenges
Surface exceptions early. A short note on page one is better than a buried footnote on page twenty. Transparent revisions preserve trust even when figures change.
A practical performance report sample and template checklist
The easiest way to improve reporting quality is to standardize what a strong report must include. This reduces reinvention, shortens production time, and improves consistency across periods.
What a strong performance report sample includes
A practical executive-ready sample usually contains:
A concise first page: Headline returns, benchmark gap, top drivers, key risks, and decisions required
Benchmark-aware performance tables: MTD, QTD, YTD, 1Y, 3Y, 5Y, and since inception where applicable
Attribution commentary: Clear explanation of what drove gains and losses
Risk indicators: Drawdown, volatility, tracking error, concentration, and liquidity markers
Exposure analysis: Asset allocation, sector, geography, currency, and manager exposure
Action-oriented conclusions: Watchlist items, rebalancing implications, and governance notes
Section ownership: Named owners for data preparation, commentary, review, and approval
Use this checklist before approving any investment performance report:
Audience confirmed: CIO, CFO, board, investment committee, or client leadership
Decision purpose defined: Allocation, oversight, compliance, or strategy review
Reporting period validated: MTD, QTD, YTD, trailing, and since inception logic aligned
Benchmarks confirmed: Names, weights, and mapping reviewed
Data sources reconciled: Custodian, administrator, PMS, and market data all matched
Methodology documented: Return calculations, attribution model, and valuation rules stated
Exceptions surfaced: Estimates, restatements, and limitations disclosed clearly
Approval workflow assigned: Who prepares, reviews, signs off, and publishes
Distribution timing set: Delivery aligned to committee calendar and executive cadence
Question test passed: Every section answers a likely executive question
How to improve your reporting process over time
The best reporting teams treat every reporting cycle as a feedback loop. Trust improves when the process becomes more repeatable, auditable, and responsive to executive needs.
Here are four practical best practices I recommend as a consultant:
1. Define report purpose before you design the dashboard
Start by identifying the exact decisions the report must support. Do not build pages until you know:
Who will read the report
What actions they may take
Which metrics influence those actions
What level of detail they actually need
This keeps the report focused and prevents dashboard sprawl.
2. Standardize calculation logic and benchmark governance
Document one approved methodology for returns, attribution, benchmark mapping, and risk definitions. Then lock it into your reporting process.
Steps to implement:
Create a metric dictionary for all KPIs
Approve benchmark mapping by portfolio and strategy
Define change-control rules for methodology updates
Publish version notes whenever something changes
This is one of the fastest ways to improve trust.
3. Build exception reporting into the first page
Do not wait for executives to discover issues in the appendix. Create a visible exception block covering:
Late or missing source data
Estimated valuations
Restated periods
Policy breaches
Unusual exposure shifts
This improves governance and reduces last-minute meeting friction.
4. Use narrative commentary to connect numbers to action
Numbers alone rarely drive decisions. Each major section should include a short commentary that explains:
What changed
Why it changed
Whether it was expected
What action is recommended
This is especially important when performance is volatile or when attribution is mixed.
5. Measure the reporting process itself
High-quality investment performance reporting is also an operational process. Track internal performance metrics such as:
Report production cycle time
Number of manual adjustments
Reconciliation breaks
Late data inputs
Executive clarification requests
Post-publication corrections
Improvement becomes much easier when the process is measured like any other business workflow.
Build the reporting workflow with FineReport instead of doing it manually
Building a trusted investment performance report manually is possible, but it is rarely efficient. Most teams end up stitching together spreadsheets, market data feeds, PMS exports, benchmark files, and presentation decks. That creates version-control problems, inconsistent definitions, long review cycles, and unnecessary operational risk.
Building this manually is complex; use FineReport to utilize ready-made templates and automate this entire workflow.
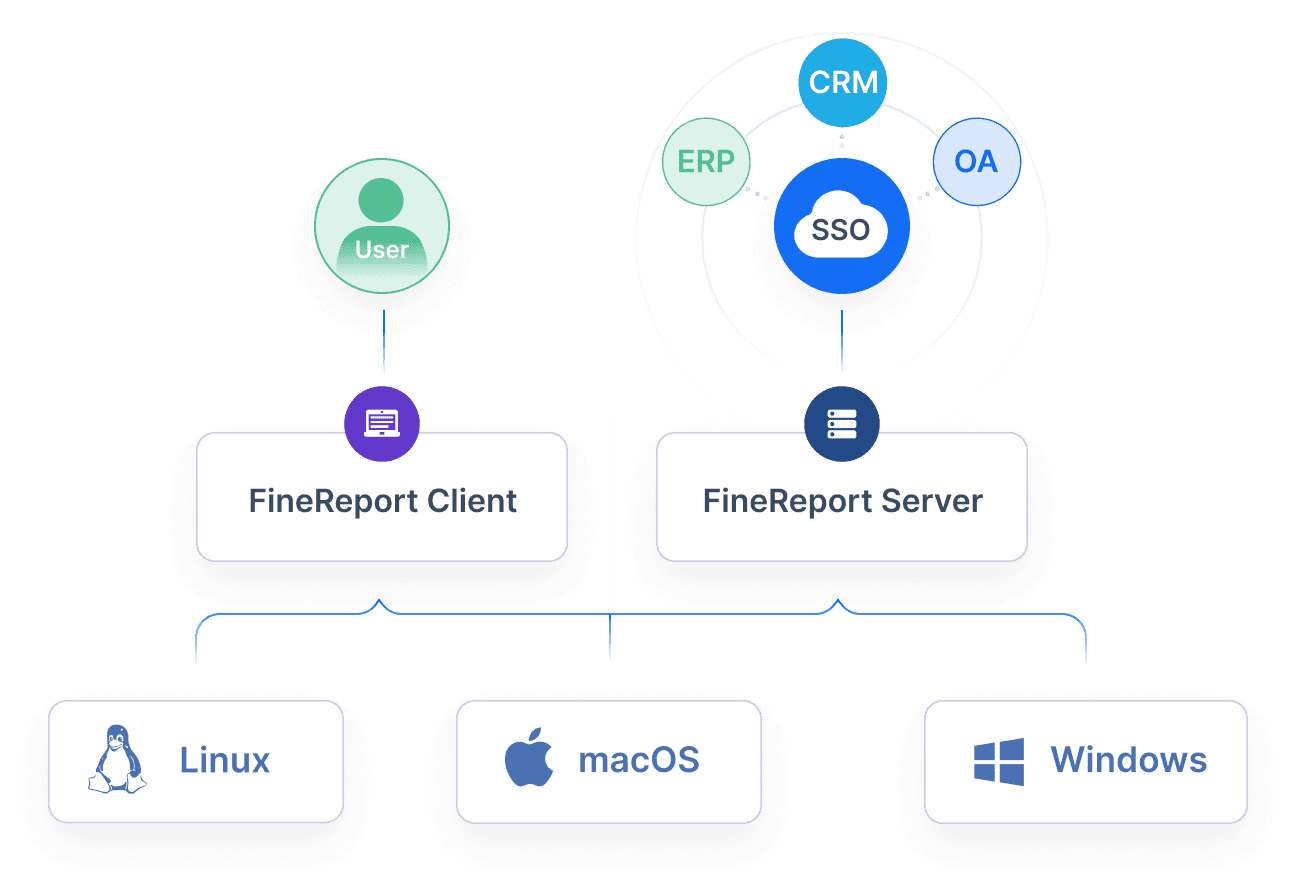
FineReport helps investment teams move from fragmented reporting to a scalable, executive-ready process by enabling you to:
Consolidate data sources from portfolio systems, custodians, databases, and spreadsheets
Standardize KPI logic so returns, benchmarks, and risk metrics stay consistent
Build executive dashboards with summary pages, attribution views, and drill-down analysis
Automate scheduled reporting to reduce cycle time and manual preparation
Apply templates that keep layouts, commentary structure, and governance sections consistent
Support approvals and distribution so stakeholders receive the right report at the right time
For enterprise decision-makers, the value is straightforward: faster reporting, fewer manual errors, clearer executive communication, and stronger confidence in the numbers.
If your current investment performance report still depends on spreadsheet stitching and slide reformatting, the process is already costing you credibility. A modern reporting workflow gives executives what they actually need: timely insight they can trust.
It should show total return, benchmark comparison, excess return, key contributors, major risk indicators, and the actions leadership should consider next. The goal is to answer what happened, why it happened, and what to do about it.
Trust comes from accurate data, consistent definitions, clear methodology, and timely delivery. Executives also need visible explanations for any benchmark changes, valuation cutoffs, or data limitations.
The most important metrics usually include portfolio return, benchmark return, excess return, attribution, volatility, drawdown, tracking error, and current asset allocation. These measures help executives judge both results and the risks taken to achieve them.
Benchmarking gives context to raw returns and shows whether performance was strong or weak relative to expectations. Without a relevant benchmark, executives cannot easily separate market-driven gains from manager or strategy skill.
Most executive teams need monthly or quarterly reporting, depending on portfolio complexity and governance needs. It should arrive early enough to inform committee reviews, rebalancing decisions, and manager oversight.
Product Trial
FineReport
Pixel-perfect reports · Interactive dashboards · Easy data entry · Digital twins