Getting your data ready is the first step to create data visualizations in Excel. You want your information to be clean and organized before you start making charts and graphs. Here’s a simple step-by-step guide:
Import your data into Excel. Open your file and check that everything loaded correctly.
Look over your dataset. Spot any missing values or strange entries.
Fill in missing values or decide how to handle them. Sometimes you can use averages or just leave blanks.
Remove duplicates. Double entries can mess up your visualizations.
Standardize your formats. Make sure dates, numbers, and text look the same throughout.
Validate your data. Check that numbers are in the right columns and text is spelled correctly.
Watch out for outliers. Decide if you want to keep or remove unusual data points.
Transform your data if needed. You might want to add calculated columns or use pivot tables for summaries.
Document your changes. Keep notes so you remember what you did.
Save your cleaned dataset. You’re ready to move on!
If you work in business or manufacturing, you might need more advanced tools for data cleaning and integration. FineReportmakes this process easier by connecting to multiple data sources and automating data validation. This is especially helpful for quality control in manufacturing, where accuracy matters.
Now you need to select the right data range for your visualizations. The range you choose will shape your charts and graphs, so pick carefully.
Click and drag to highlight the cells you want to visualize.
If you want to insert a chart, select a blank cell first, then right-click and choose "Select Data."
In the Select Data Source dialog, click "Add" to insert your values or cells.
Use "Edit" to add labels for your axes or categories.
Always check that your selection matches what you want to show. Too much data can clutter your visualizations, while too little can miss important trends.
Choosing the right data range helps you spot patterns, trends, and outliers. Think about your audience. Tailor your selection to what they need to see. In manufacturing, for example, you might focus on defect rates or production volumes. FineReportlets you bind data from different sources, making it easier to create data visualizations in Excel that show the full picture.
Picking the right chart type is key to effective data visualization in Excel. Each chart tells a different story, so match your choice to your data and goals.
Chart Type
Best Use Case
Line chart
Trend analysis, time series data, comparing multiple data series.
Bar chart
Comparing categories, ranking items, frequency distribution.
Stacked bar chart
Comparing categories, grouped by subdivisions.
Column chart
Comparing categories, ranking items, frequency distribution.
Visualizing stages in a process, spotting bottlenecks.
Combo chart
Combining chart types for deeper analysis.
Ask yourself: What do you want your audience to learn? Are you showing trends over time, comparing categories, or highlighting proportions? The best practices to create data visualizations in Excel suggest you match your chart type to your message. For business and manufacturing, combo charts and dashboards in FineReportcan help you analyze multiple metrics at once.
Ready to create data visualizations in Excel? Here’s how you insert a chart:
Decide which chart or graph fits your data.
Select the range of cells you want to visualize.
Go to the Insert tab at the top of Excel.
Click on the chart type you want. Excel will show you recommended charts based on your data.
Your chart appears in the spreadsheet. You can move it around or resize it.
Use the Chart Design tab to change the chart type, switch rows and columns, or add elements like legends and data labels.
Save your chart so you don’t lose your work.
Watch out for common mistakes. Don’t select non-contiguous data, or your chart might look messy. Customize your chart elements—titles, labels, and legends—to make your visualizations clear. Avoid overly complex designs that distract from your data.
FineReportmakes this process even smoother. You can drag and drop to create charts and dashboards, connect to large datasets, and automate report generation. This is perfect for manufacturing quality control, where you need to monitor multiple indicators in real time.
Customizing your charts and graphs brings clarity to your data visualizations in Excel. You want your visuals to be easy to read and understand.
Format your charts for visual appeal. Pick colors and styles that make your data stand out.
Use readable fonts. Make sure labels and titles are easy to see.
Add chart elements like titles, axis labels, and legends. These help viewers understand what they’re looking at.
Use consistent color schemes. Highlight key data points with contrasting colors, but don’t go overboard.
Conditional formatting can help you draw attention to important values.
Avoid clutter. Too many elements can overwhelm your audience.
Color schemes and labeling play a big role in clarity. Auditors use colored labels and backgrounds to organize information and highlight key points. Excel’s conditional formatting lets you automatically highlight cells based on rules, making your visualizations more accurate and easier to interpret.
If you need more customization, FineReportoffers over 70 chart styles, interactive dashboards, and advanced formatting options. You can tailor your visualizations for business presentations or manufacturing dashboards, ensuring clarity and impact.
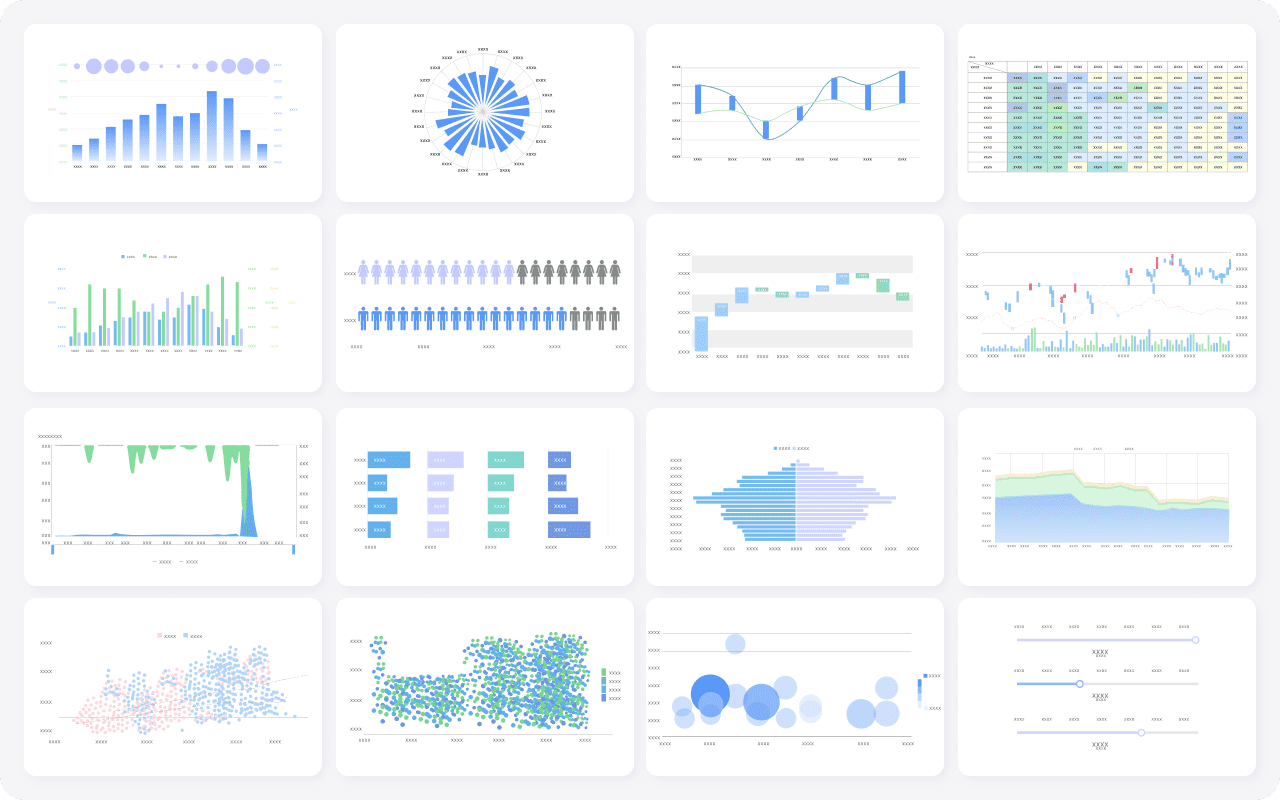
FineReport's Multiple Charts For Data Visualization
Tip: Always preview your charts and graphs before sharing them. Ask yourself if the message is clear and if viewers can easily spot trends or insights.
By following these steps and best practices to create data visualizations in Excel, you’ll make your data easy to understand and share. If you want to create data visualizations for complex business scenarios, FineReport gives you more power and flexibility.
Advanced Options and Best Practices in Data Visualization in Excel
Advanced Excel Features
When you want to take your visualizations in Excel to the next level, you have some powerful tools at your fingertips. Combo charts let you combine different chart types, making it easier to compare multiple data series in one view. This approach helps you spot trends and patterns that might not stand out in a single chart. Sparklines are another great feature. You can add these tiny charts inside cells to show trends right next to your data. Conditional formatting highlights important values, so you can quickly see patterns or outliers.
Feature
Description
Combo Charts
Combines different chart types for layered data representation, enhancing clarity in complex data.
Sparklines
Compact graphics within cells that show trends succinctly, improving data trend visualization.
Conditional Formatting
Highlights important data based on criteria, aiding in quick pattern recognition and trend analysis.
Combo charts and trendlines also help you dig deeper into your data. You can compare different data series, highlight trends, and make your visualizations more effective for decision-making.
FineReport for Data Visualizations
If you need to create visualizations with large datasets or from multiple sources, FineReport offers advanced options that go beyond Excel. FineReporthandles hundreds of thousands of records without slowing down, while Excel can struggle with big files. You can let multiple users access and manage visualizations at the same time, which is perfect for teams.
Feature
FineReport
Excel
Handling Large Datasets
Supports hundreds of thousands of records without crashing
Struggles with over 10,000 records, leading to slow performance and crashes
Multi-user Access
Allows simultaneous access and management by multiple users
Standalone program, limiting multi-user access
Data Submission
Directly submits data to the database, preventing data loss
Requires manual data handling, increasing risk of loss
Lacks centralized management, leading to potential mismatches
Parameter Filtering
Offers simple drag-and-drop for complex filtering
Limited filtering capabilities, requiring more complex setups
FineReport also supports multi-source data integration. You can combine data from different business systems with just one click. For manufacturing quality control dashboards, FineReportlets you visualize key metrics using over 60 chart types, including dynamic 3D effects. This makes it easy to monitor trends, spot issues, and improve your processes.
You’ve learned the basics of How to Create Data Visualizations in Excel for Beginners. Try different chart types, focus on clarity, and use color wisely. Advanced tools like FineReporthelp you handle complex data and create interactive dashboards. For deeper insights, check out resources and stay updated on new visualization trends.
Continue Reading About Data Visualization in Excel
Real-time insights to optimize production, logistics, and decisions.
FAQ
How do you start with How to Create Data Visualizations in Excel for Beginners?
You begin by cleaning your data, selecting the right range, and choosing a chart type that matches your goals. Excel guides you through each step.
Can you use How to Create Data Visualizations in Excel for Beginners for large datasets?
Excel works for small to medium datasets. For bigger data, you should try FineReport. It handles large volumes and offers advanced visualization options.
What chart types should you use in How to Create Data Visualizations in Excel for Beginners?
You can use line, bar, column, pie, and combo charts. Pick the chart that best shows your trends, comparisons, or proportions.