Profitability analysis lets you measure how much profit your business generates from different products, services, or departments. You gain a clear view of which areas drive profit and which ones need improvement. When you understand where profits come from, you can allocate resources more effectively and boost revenue growth. This analysis also helps you spot cost-saving opportunities in less profitable segments. Detailed insights from profitability analysis guide your decisions on investments, cost reduction, and market expansion, improving overall business performance.

Profitability analysis is the process you use to systematically examine the profits your business earns from different revenue streams. This analysis helps you understand where your revenue comes from and how much profit each area generates. You can use profitability analysis to reveal which products, projects, or business units contribute most to your financial success. By focusing on key financial metrics, you gain insights that guide your decisions and help you optimize your business strategy.
Profitability analysis gives you a clear picture of your revenue, costs, and profit margins. It supports your efforts to identify strengths and weaknesses across your operations.
Here is a table summarizing the main components included in a standard profitability analysis:
| Component | Description |
|---|---|
| Revenue Analysis | Evaluates trends in revenue, sources of revenue, and pricing strategies. |
| Cost Analysis | Focuses on fixed and variable costs, cost control, and break-even analysis. |
| Gross Profit Margin | Calculated by subtracting COGS from total revenue and dividing by total revenue. |
| Operating Profit Margin | Calculated by dividing operating income by total revenue, focusing on core business activities. |
| Net Profit Margin | Represents the portion of revenue remaining after all expenses, crucial for overall profitability. |
You can apply different types of profitability analysis to gain a deeper understanding of your business performance. Each type focuses on a specific area and delivers unique insights.
| Type of Analysis | Focus Area | Business Impact |
|---|---|---|
| Product Profitability Analysis | Financial gain from individual products | Helps manage inventory and optimize product offerings. |
| Project Profitability Analysis | Financial returns of specific projects | Ensures effective resource allocation in service-oriented organizations. |
| Segment Profitability Analysis | Comparison of different internal units or customer segments | Identifies which areas contribute most to overall profitability, guiding strategic decisions. |
Product profitability analysis lets you see which products or services deliver the highest margins. You can use this information to adjust your product mix or pricing. Project profitability analysis helps you evaluate the financial returns of individual projects, making sure your time and resources go to the most valuable activities. Segment profitability analysis compares different business units or customer groups, so you can focus on the most profitable segments.
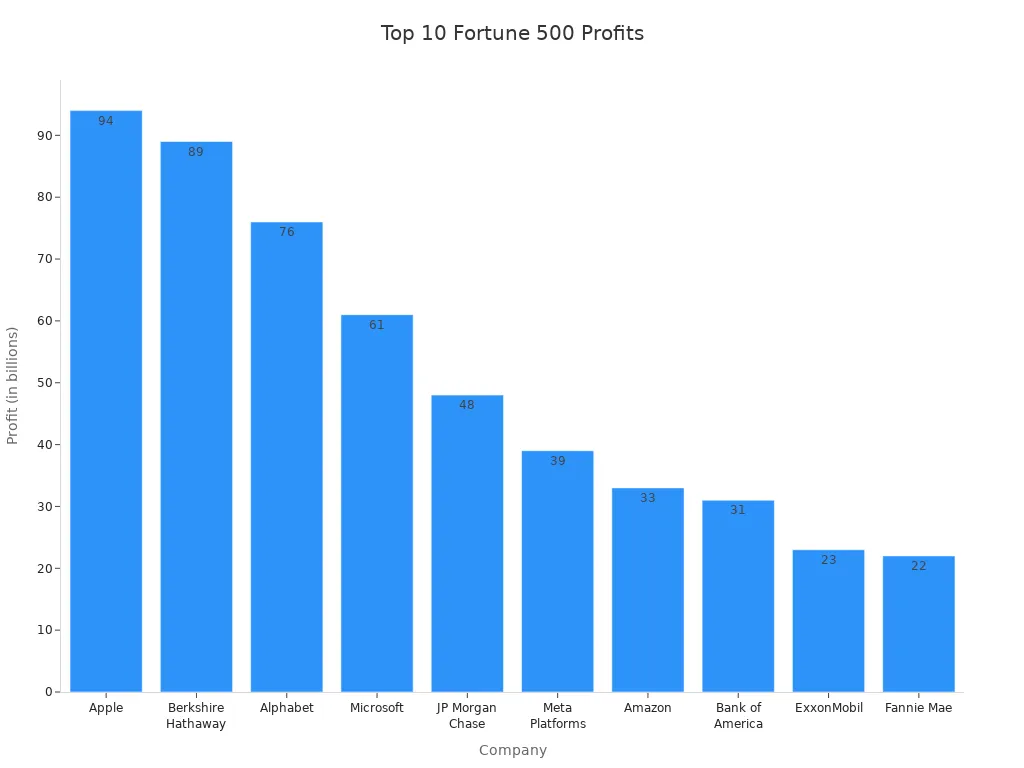
Many Fortune 500 companies use these types of profitability analysis to drive their business decisions. For example, the chart below shows the profits of the top 10 Fortune 500 companies, highlighting the importance of understanding revenue and profit sources:
By using profitability analysis, you can identify opportunities to increase revenue, reduce costs, and improve your overall profit. This foundation prepares you to explore the formulas and techniques that make profitability analysis even more powerful.
Profitability analysis gives you the power to understand your business’s financial health. You see exactly how revenue flows through your company and which products or services generate the most profit. This process helps you make smarter decisions and improve your business results. Many business leaders prioritize profitability analysis because it helps you:
Profitability analysis also supports customer profitability analysis. You can evaluate which customer segments bring the highest net profit and adjust your strategies to focus on those groups. This approach leads to better results and helps you forecast future financial performance.
When you use profitability analysis, you gain insights that drive financial stability and growth. You can pinpoint inefficiencies, refine product strategies, and maximize profitability. The table below shows how profitability analysis leads to improved business results:
| Evidence Point | Description |
|---|---|
| Identifying Inefficiencies | Profitability analysis helps businesses pinpoint areas where they are not operating efficiently, leading to cost savings and improved margins. |
| Refining Product Strategies | By understanding profitability across different products, companies can adjust their offerings to focus on more profitable items, enhancing overall performance. |
| Maximizing Profitability | The analysis aids in setting pricing strategies and optimizing resource allocation, which directly contributes to increased profitability and better financial outcomes. |
Profitability analysis gives you insights into revenue, costs, and net profit margins. These insights help you make informed decisions about pricing, resource allocation, and strategic planning. For medium-sized enterprises, profitability analysis helps you understand financial performance, identify areas for improvement, and optimize your product mix. You can use break-even analysis to make strategic decisions about product offerings and analyze margins to adjust pricing strategies.
Businesses often face challenges such as managing cash flow, planning strategically, and monitoring financial metrics. Profitability analysis addresses these challenges by providing clear insights into revenue streams and net profit. You can use these results to respond quickly to market changes and forecast future financial performance. FineBI supports this process by integrating data from multiple sources, automating analysis, and delivering actionable insights that improve your business results.

You need to understand the most important ratios when you conduct profitability analysis. These ratios help you measure how efficiently your business generates profit from sales, assets, and equity. You can use them to compare your performance over time or against competitors. Here is a table that summarizes the essential profitability ratios you should include in every profitability report:
| Profitability Ratio | Definition | Formula |
|---|---|---|
| Gross Profit Margin | Measures the profitability of production by comparing gross profit to revenue. | (Revenue - Cost of Goods Sold) / Revenue |
| Operating Profit Margin | Examines profitability after accounting for production and operating costs. | (Revenue - Direct costs - Operating costs) / Revenue |
| Net Profit Margin | Assesses overall profitability after all expenses are considered. | (Revenue - Expenses) / Revenue |
| Return on Assets (ROA) | Evaluates profit relative to total assets, showing capital efficiency. | Net income / Average total assets |
| Return on Equity (ROE) | Reveals the return generated for shareholders based on their invested capital. | Net income / Average total equity |
You should include these ratios in your profitability report to get a complete view of your business’s financial health. Each ratio highlights a different aspect of your profit structure. Gross profit margin shows how well you control production costs. Operating profit margin focuses on your core business activities. Net profit margin gives you the final picture after all expenses. ROA and ROE help you see how efficiently you use assets and equity to generate profit.
You can apply the profitability analysis formula in different ways, depending on your business model. Service-based businesses often focus on customer profitability analysis. You compare the revenue from each client to the direct costs, such as labor and overhead. Product-based businesses use product profitability analysis. You compare revenue from each product to both direct costs (materials, labor) and indirect costs (overhead). The cost structure and financial dynamics differ between these models, so you need to tailor your profitability report accordingly.
Let’s look at a real-world example. Watches of Switzerland, a multinational retailer, uses profitability analysis formulas to guide business decisions. The company reported £1,542.8 million in revenue, with variable costs of £966.5 million and fixed costs of £411.2 million. The average selling price was about £5,000, and they sold around 300,000 units. Their breakeven point was 231,271 units. This type of profitability report helps you forecast how many units you need to sell to cover costs and start making a profit.
You can use the following formulas in your profitability analysis:
(Revenue - Cost of Goods Sold) / Revenue(Operating Income) / Revenue(Net Profit) / RevenueNet Income / Average Total AssetsNet Income / Average Total EquityYou should include these calculations in your profitability report to track your financial performance and forecast future results. These formulas help you understand your profit margins and identify areas for improvement.
Tip: Use a profitability report to compare your results across different periods or business units. This approach helps you spot trends and make better decisions.
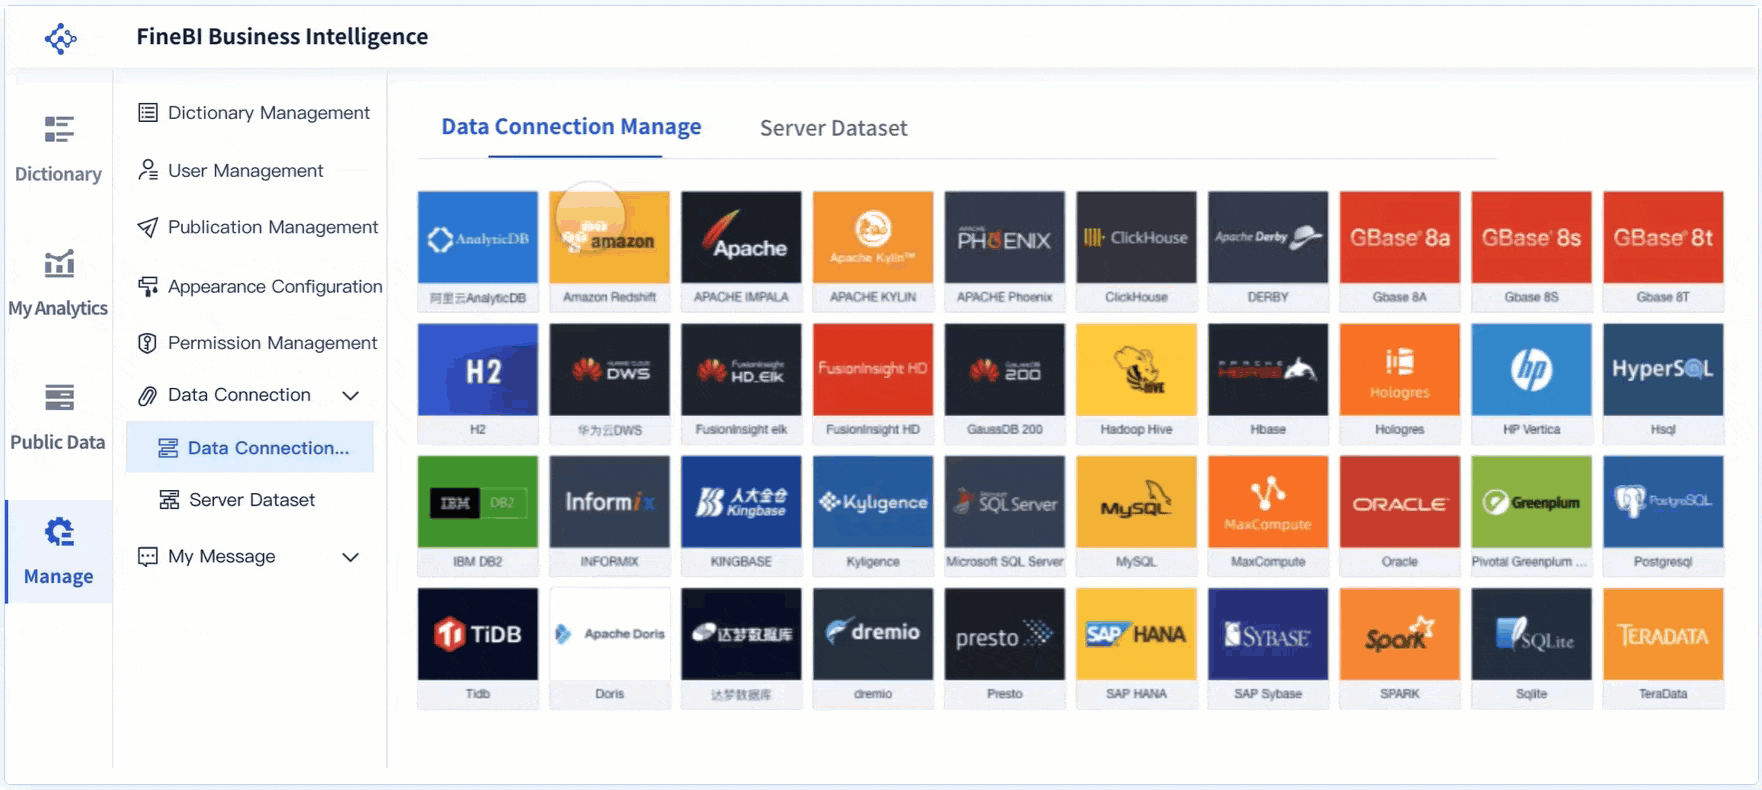
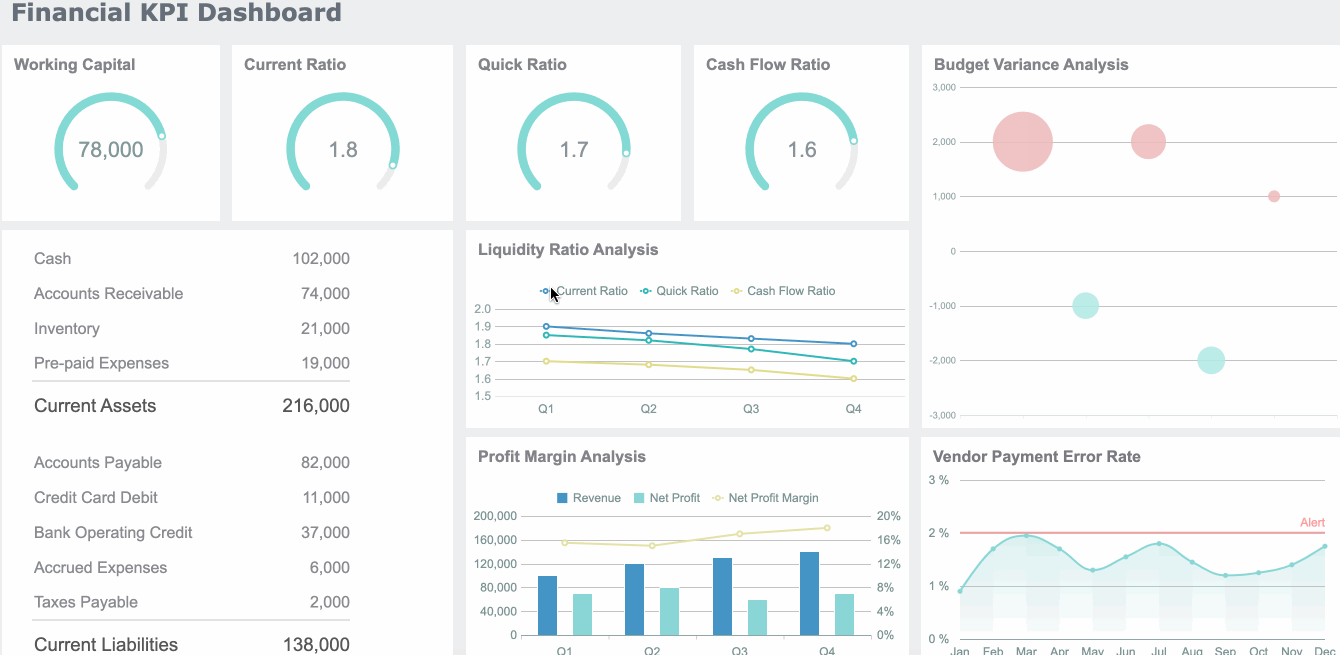
FineBI makes it easy to calculate and visualize profitability metrics. You can automate the profitability analysis formula and reduce manual errors. FineBI provides interactive dashboards, so you can see all your key ratios in one place. You can create custom charts for your profitability report and update them in real time. FineBI also supports advanced functions, such as IFERROR, to handle data issues smoothly.
Here is a comparison of FineBI and traditional spreadsheet methods:
| Feature | FineBI Benefits | Traditional Spreadsheet Methods |
|---|---|---|
| Data Visualization | Interactive and intuitive visualizations | Static tables and charts |
| Custom Chart Creation | Tailored charts for specific profitability reports | Limited flexibility |
| Dashboard Management | Centralized view of multiple metrics | Manual updates and separate sheets |
You can analyze profitability metrics more efficiently with FineBI than with Excel. FineBI automates calculations, so you spend less time on manual work and more time on analysis. You can forecast trends, monitor profit margins, and share your profitability report with your team instantly.
A well-structured profitability report gives you the insights you need to forecast growth, improve profit, and make data-driven decisions. FineBI empowers you to turn raw data into actionable insights, helping you stay ahead in a competitive market.
You can use several profitability analysis techniques to understand your business’s financial performance. These methods help you measure profit, identify trends, and make better decisions. Trend analysis is one of the most effective techniques. You compare financial statements over time to spot growth patterns, revenue changes, and cost drivers. This approach helps you predict future performance and catch issues like declining profit margins before they become serious.
Segment analysis lets you break down your results by product, category, or sales channel. You see which areas contribute most to profit and which need improvement. For retail businesses, you should track metrics such as foot traffic, average transaction value, GMROI, customer acquisition costs, customer lifetime value, and return rate. The table below shows how these metrics support profitability analysis:
| Profitability Metric | Description |
|---|---|
| Foot traffic | Measures the number of customers visiting your store, both online and in person. |
| Average Transaction Value (ATV) | Indicates how much, on average, each customer spends per purchase. |
| GMROI | Measures the profit made for every dollar invested in inventory. |
| Customer Acquisition Costs (CAC) | Reveals how much is spent to acquire a new customer. |
| Customer Lifetime Value (CLV) | Predicts the total revenue expected from a customer over their relationship. |
| Return Rate | Measures the percentage of purchased items that are returned by customers. |
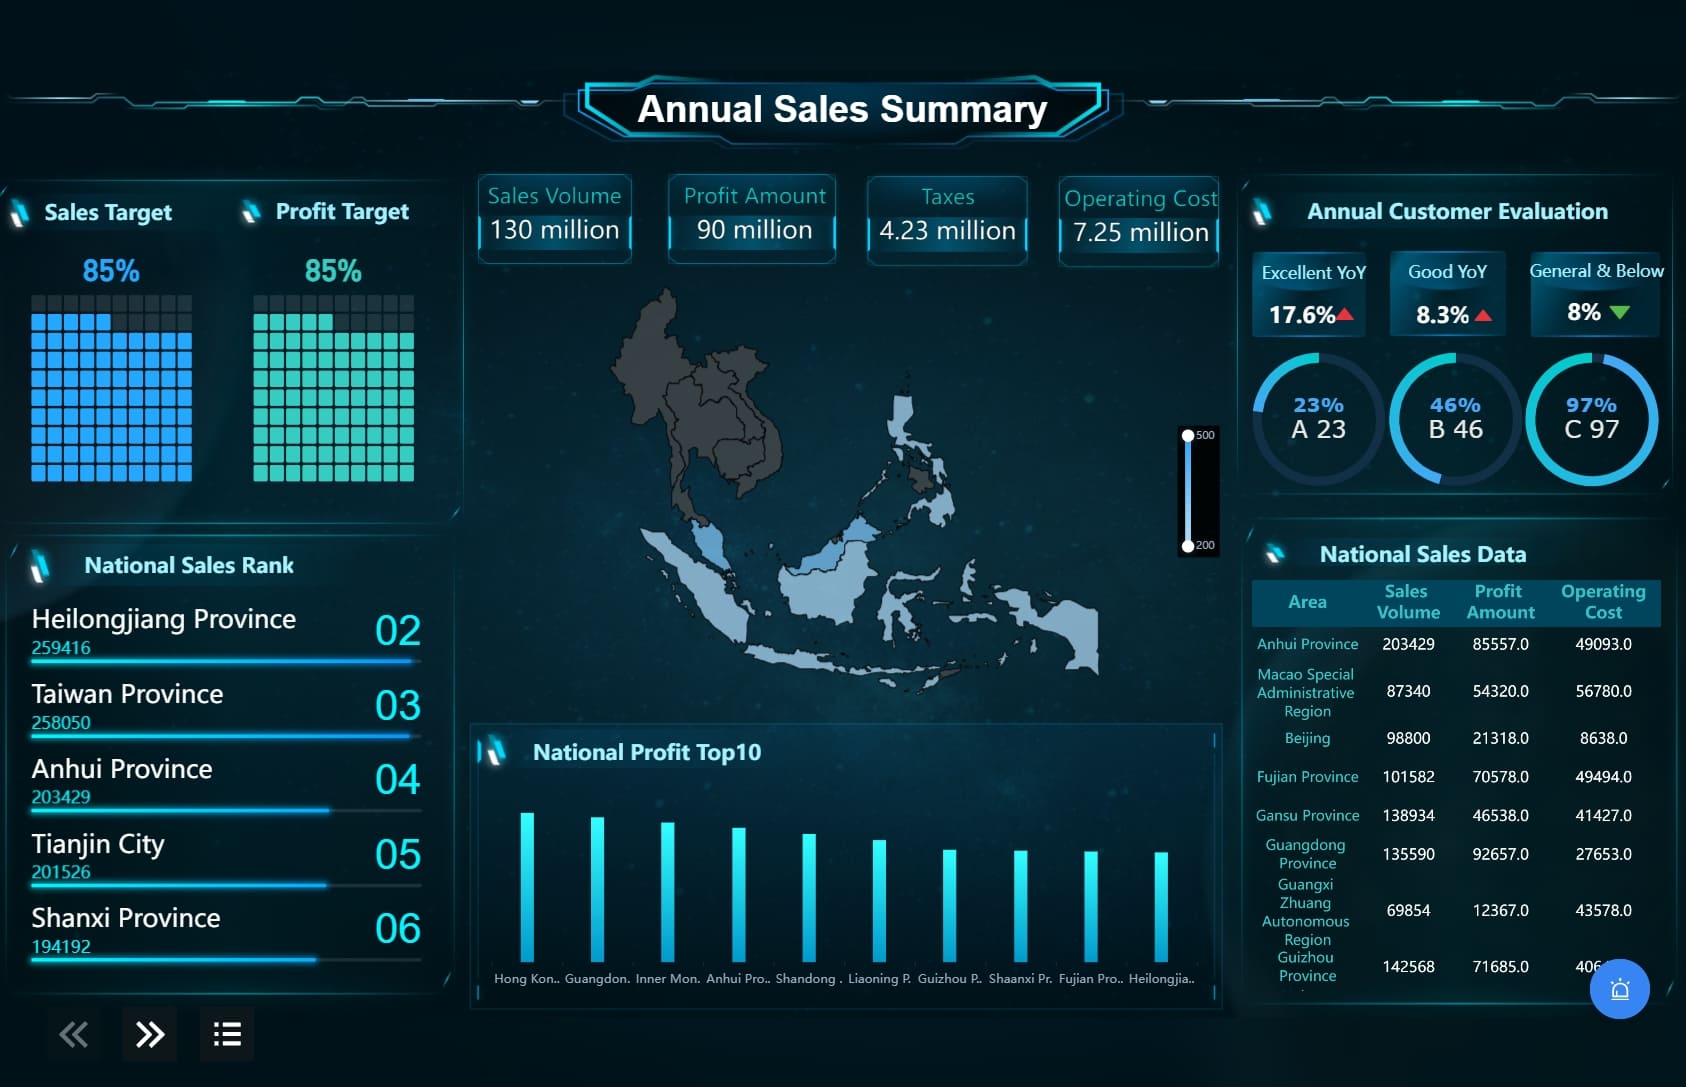
You can also use dashboarding to visualize your profitability analysis. Dashboards display key metrics in real time, making it easier to monitor profit and ROI. If you want to know how to perform profitability analysis, start by collecting data, analyzing trends, and comparing segments. These steps help you make informed decisions and improve your business results.
Tip: Trend analysis provides context for smarter decisions. You can predict future company performance and set realistic goals.
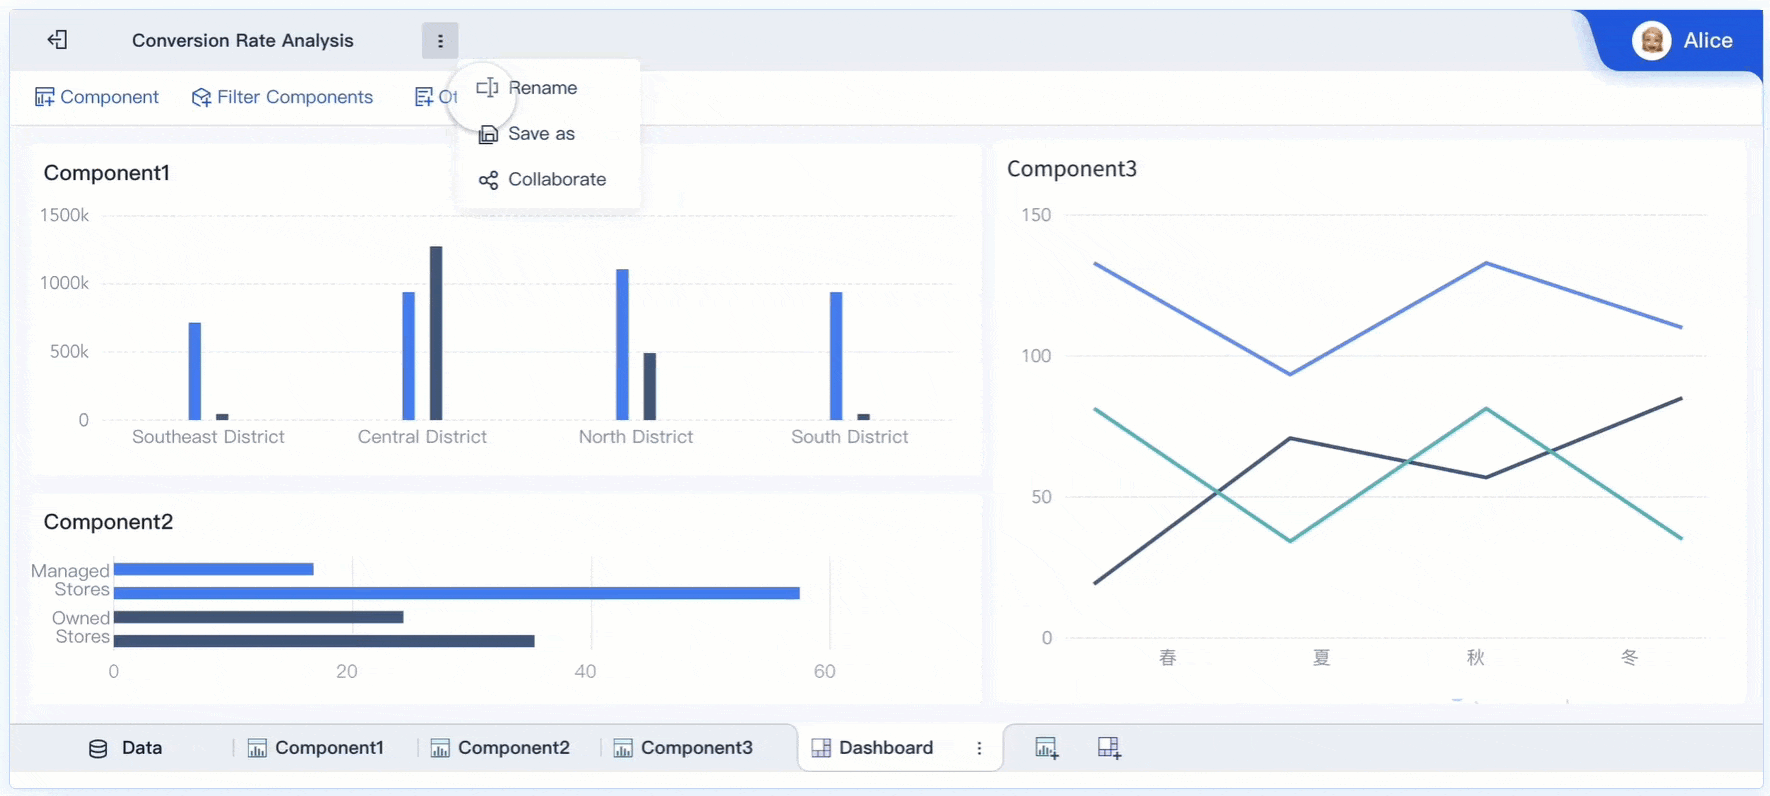
FineBI streamlines how to perform profitability analysis with a structured workflow. You start by integrating data from multiple sources. FineBI supports databases, cloud platforms, and file uploads, so you can bring all your information together. Next, you edit and prepare your data. You can join tables, create calculated fields, and apply filters to focus on what matters most.
After processing your data, you create visual components such as charts and tables. FineBI’s drag-and-drop interface makes this step simple. You then build dashboards to display your profitability analysis techniques. These dashboards update in real time, allowing you to track profit and ROI instantly.
Sharing your analysis is easy with FineBI. You can publish dashboards securely and collaborate with your team. Real-time updates and collaborative editing help distributed teams work together efficiently. A recent survey showed a 33% increase in collaborative efficiency for remote teams using FineBI. Integrated tools support fast decision-making, and the user-friendly design helps your team adapt quickly.
FineBI’s self-service features let you explore profitability analysis techniques without technical skills. You gain immediate insights, improve teamwork, and make better decisions. This approach helps you maximize profit and stay competitive in your industry.
You can use profitability analysis to drive real improvements in your business. Many companies have achieved significant gains by applying these methods. For example:
You can see how profitability analysis helps businesses focus on what works and adjust strategies for better results.
You can take practical steps to improve profit based on your analysis outcomes. Start by understanding your financial statements. Calculate project profitability to assess which initiatives deliver the best returns. Find efficiencies in your operations to reduce costs and increase margins. Conduct thorough profitability analysis to identify high and low-performing products or segments.
Here are common pitfalls you should avoid:
| Pitfall | Impact | How to Avoid It |
|---|---|---|
| Underpricing Products or Services | Low prices can lead to unsustainable operations and difficulty covering costs. | Conduct market research, focus on value, implement tiered pricing, reassess costs. |
| Overreliance on a Single Revenue Stream | Loss of a key customer can lead to financial instability. | Diversify offerings, expand customer base, explore new markets. |
| Neglecting Customer Retention | High churn rates can lead to wasted marketing spend and lower lifetime value. | Deliver exceptional service, create loyalty programs, stay engaged, request feedback. |
| Poor Inventory Management | Improper inventory management results in increased storage costs and dissatisfied customers. | Use inventory management software, adopt just-in-time inventory, analyze demand trends, conduct regular audits. |
| Ineffective Marketing Strategies | High customer acquisition costs and low conversion rates can hurt profitability. | Define target audience, utilize data analytics, embrace content marketing, retarget customers. |
| Ignoring Employee Productivity | Low productivity increases labor costs and decreases customer satisfaction. | Invest in training, set clear goals, offer incentives, foster a positive culture. |
| Failing to Monitor Key Metrics | Unmonitored issues can spiral out of control. | Track KPIs, use dashboards, schedule reviews. |
| Resistance to Change | Failure to innovate can result in lost opportunities and declining market share. | Stay informed, solicit feedback, experiment, be flexible. |
FineBI supports ongoing profitability analysis by providing real-time insights. You can respond quickly to market changes and operational challenges. FineBI consolidates data from multiple sources, giving you a complete view of business performance. Streamlined access to data enhances productivity and simplifies financial reporting. You can focus on high-value tasks and foster collaboration across teams. FineBI creates a shared platform for data access and analysis, aligning team efforts and breaking down silos.
Profitability analysis helps you monitor key metrics, avoid common pitfalls, and take confident actions to improve profit. You can use FineBI to track performance, optimize processes, and support continuous improvement.
Profitability analysis gives you the tools to drive business success. You use proven formulas and techniques to gain actionable insights. When you adopt solutions like FineBI, you measure return on investment with metrics such as DuPont Analysis, NPV, IRR, and Payback Period.
| Management Practices | Description | Impact on Business Success |
|---|---|---|
| Primary Practices | Strategy, Execution, Culture, Structure | Essential for outperforming peers |
| Secondary Practices | Talent, Innovation, Leadership, Mergers and Partnerships | Enhances primary practices for sustained performance |
| Overall Formula | 4+2 Formula | Over 90% chance of sustaining superior performance |
You improve decision-making, optimize resources, and anticipate future trends. To ensure continuous improvement, you should map processes, analyze root causes, reduce waste, and focus on value-added activities. Leaders build a culture of financial intelligence and business acumen. Start evaluating your profitability analysis regularly to achieve sustainable growth.
How to Do Retention Analysis for Business Success
What is Pareto Chart and How Does it Work
How DuPont Analysis Helps You Understand Your Business
What is Cost Analysis and Why Does It Matter in Business
Step-by-Step Guide to Setting Up a Data Analytics Framework


The Author
Lewis
Senior Data Analyst at FanRuan
Related Articles
Data Analyst Dashboard: A Scenario-Based Guide to KPI Views That Drive Better Business Decisions
Learn how data analyst dashboards turn raw data into actionable KPI views for operational, analytical, and strategic decisions. Drive better business outcomes.
Lewis Chou
May 03, 2026

Self-Service Analytics Defined and Why You Need It
Self-service analytics lets you analyze data without IT help, empowering faster, data-driven decisions and boosting agility for your business.
Lewis
Jan 04, 2026

Best Self-Service Tools for Analytics You Should Know
See which self-service tools for analytics let business users access data, build dashboards, and make decisions faster—no IT help needed.
Lewis
Dec 29, 2025


