If you need to understand whether a business is stable, profitable, and actually generating cash, you need to know how to read a financial report. For finance teams, operations leaders, investors, and business managers, this is not an academic skill. It is a practical way to spot risk early, evaluate performance accurately, and make better decisions on budgets, growth, lending, procurement, or investment. The challenge is that many readers focus on one statement in isolation and miss how the numbers connect. This guide shows you how to read a financial report as a complete business story, not just a stack of accounting tables.
All reports in this article are built with FineReport
What a financial report includes and why it matters
A financial report is a structured summary of a company’s financial position and performance over a defined period. In plain language, it tells you what the company owns, what it owes, how much it earned, what it spent, and whether real cash came in or went out. Different users rely on it for different reasons. Executives use it to guide strategy. lenders use it to assess repayment ability. Investors use it to judge value and risk. Department heads use it to understand whether operations are improving or deteriorating.
The three core statements in a financial report are the balance sheet, income statement, and cash flow statement. Together, they explain a company’s financial health from three angles:
The balance sheet shows financial position at a point in time
The income statement shows performance over a period
The cash flow statement shows actual cash movement over that period
These statements work together. A company may report strong profit on the income statement, but if receivables rise sharply and operating cash flow weakens, the quality of that profit may be poor. A business may also look safe on the balance sheet, but the cash flow statement can reveal heavy debt repayments ahead. Reading one statement without the others leads to incomplete conclusions.
Internal reporting, external reporting, and supporting notes also matter:
Internal reporting is built for management decision-making, often with more detail, dashboards, segment views, and KPIs
External reporting is prepared for investors, regulators, lenders, and other outside stakeholders
Supporting notes explain accounting policies, assumptions, unusual items, and breakdowns behind the headline numbers
Key Metrics (KPIs) to review in any financial report
When reviewing a financial report, focus on a short list of core metrics first:
Revenue: Total sales generated during the reporting period
Gross Profit: Revenue minus cost of goods sold; shows basic product or service economics
Operating Profit: Profit after operating expenses; reflects core business efficiency
Net Income: Bottom-line earnings after all expenses, interest, and taxes
Operating Cash Flow: Cash generated from normal business operations
Cash Balance: Cash and equivalents available at the reporting date
Current Ratio: Current assets divided by current liabilities; indicates short-term liquidity
Debt Level: Total borrowings outstanding; helps assess leverage and financial risk
Accounts Receivable: Money owed by customers; rising too fast can pressure cash flow
Inventory: Unsold goods; excess inventory may signal weak demand or operational inefficiency
Equity: Residual value for owners after liabilities are deducted from assets
Free Cash Flow: Cash from operations minus capital spending; useful for understanding financial flexibility
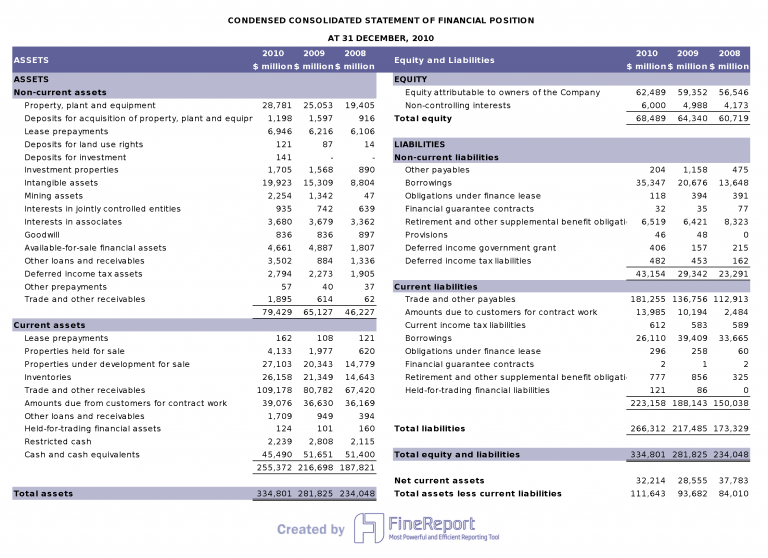
Start with the balance sheet
The balance sheet is the best place to begin because it provides the company’s financial position at a specific date. It tells you what resources the business controls, how those resources were funded, and how much cushion exists if conditions worsen.
Understand assets, liabilities, and equity
The balance sheet is built around three basic elements:
Assets: What the company owns or controls
Liabilities: What the company owes
Equity: The residual interest belonging to shareholders or owners
The core accounting equation is:
Assets = Liabilities + Equity
This matters because it keeps the report logically balanced. If total assets increase, the increase must come from either more liabilities, more equity, or both. When reading totals, always ask what caused the change. For example, if assets increased by 20%, did the business build that growth through retained earnings, new borrowing, or issuing new shares?
Assets typically include:
Cash
Accounts receivable
Inventory
Property and equipment
Investments
Intangible assets
Liabilities typically include:
Accounts payable
Short-term borrowings
Accrued expenses
Long-term debt
Lease obligations
Tax liabilities
Equity usually includes:
Share capital
Retained earnings
Other reserves
A practical reading tip: do not stop at the total asset number. Look at asset composition. A balance sheet heavy in cash is very different from one dominated by hard-to-sell inventory or intangible assets.
Review liquidity, debt, and capital structure
After understanding the categories, separate items into current and non-current. Current items are expected to be used, settled, or converted within one year. Non-current items are longer-term.
This distinction helps you evaluate:
Short-term financial strength: Can the company pay near-term obligations?
Long-term obligations: Is debt sustainable over time?
Capital structure: How much of the business is funded by debt versus equity?
Beginner-level balance sheet questions include:
Is cash rising or falling?
Are current liabilities growing faster than current assets?
Is debt increasing faster than equity?
Is receivables growth in line with revenue growth?
Is inventory building up unusually fast?
Common balance sheet warning signs include:
Shrinking cash balances
Rising short-term debt
Current liabilities outpacing current assets
Large increases in receivables without matching sales quality
Heavy dependence on borrowing to fund operations
A healthy balance sheet does not mean zero debt. It means the debt load, liquidity profile, and asset quality fit the company’s business model and cash-generation ability.
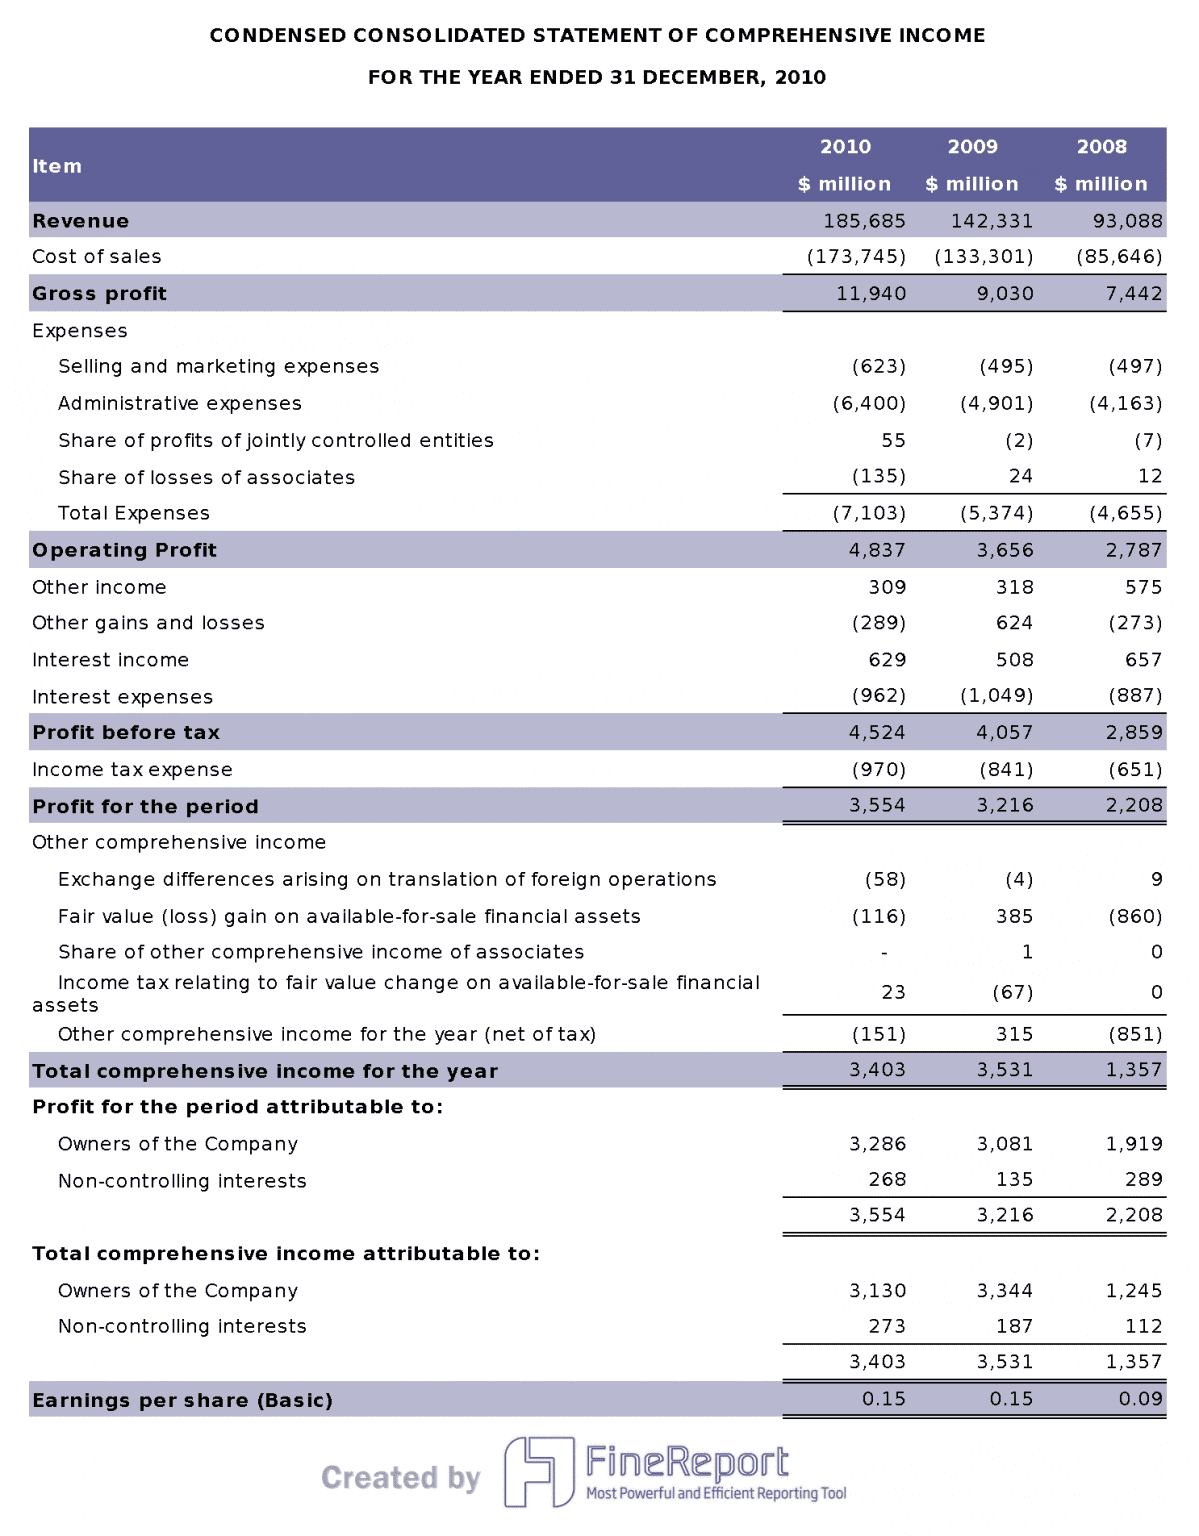
Read the income statement for performance
Once you understand the financial position, move to the income statement. This shows how the business performed during the reporting period and whether operations are producing acceptable returns.
Follow revenue, expenses, and profit
The income statement starts with revenue and subtracts different layers of cost to arrive at different profit measures.
Key components include:
Sales or Revenue: The total amount earned from delivering goods or services
Cost of Goods Sold (COGS): Direct costs tied to production or service delivery
Operating Expenses: Selling, administrative, marketing, and other overhead costs
Net Income: Final profit after all costs, interest, taxes, gains, and losses
You should distinguish between the main profit levels:
Gross Profit = Revenue - COGS
Shows how efficiently the company produces or sources what it sells
Operating Profit = Gross Profit - Operating Expenses
Shows how profitable the core business is before financing and tax effects
Net Income = Operating Profit adjusted for interest, taxes, and non-operating items
Shows the final reported earnings
This layered structure matters because headline earnings can hide operational weakness. A company may report positive net income because of a one-time gain, while operating profit is flat or declining.
Look beyond headline earnings
Strong financial report analysis goes beyond the top line and bottom line. Look for what is changing underneath.
Seasonality: Some businesses naturally peak in certain quarters
Margin trends: Revenue can grow while margins deteriorate
Expense mix: Rising selling or administrative costs may signal inefficiency or aggressive expansion
A practical rule: compare revenue growth, profit growth, and cash generation together. If profit rises but operating cash flow does not, something may be off. Common reasons include:
Slower customer collections
Inventory buildup
Revenue recognized before cash is collected
Capitalized costs that reduce current expense
Profit growth is useful, but it is not enough on its own. A financial report becomes much more reliable when earnings are backed by healthy and consistent cash generation.
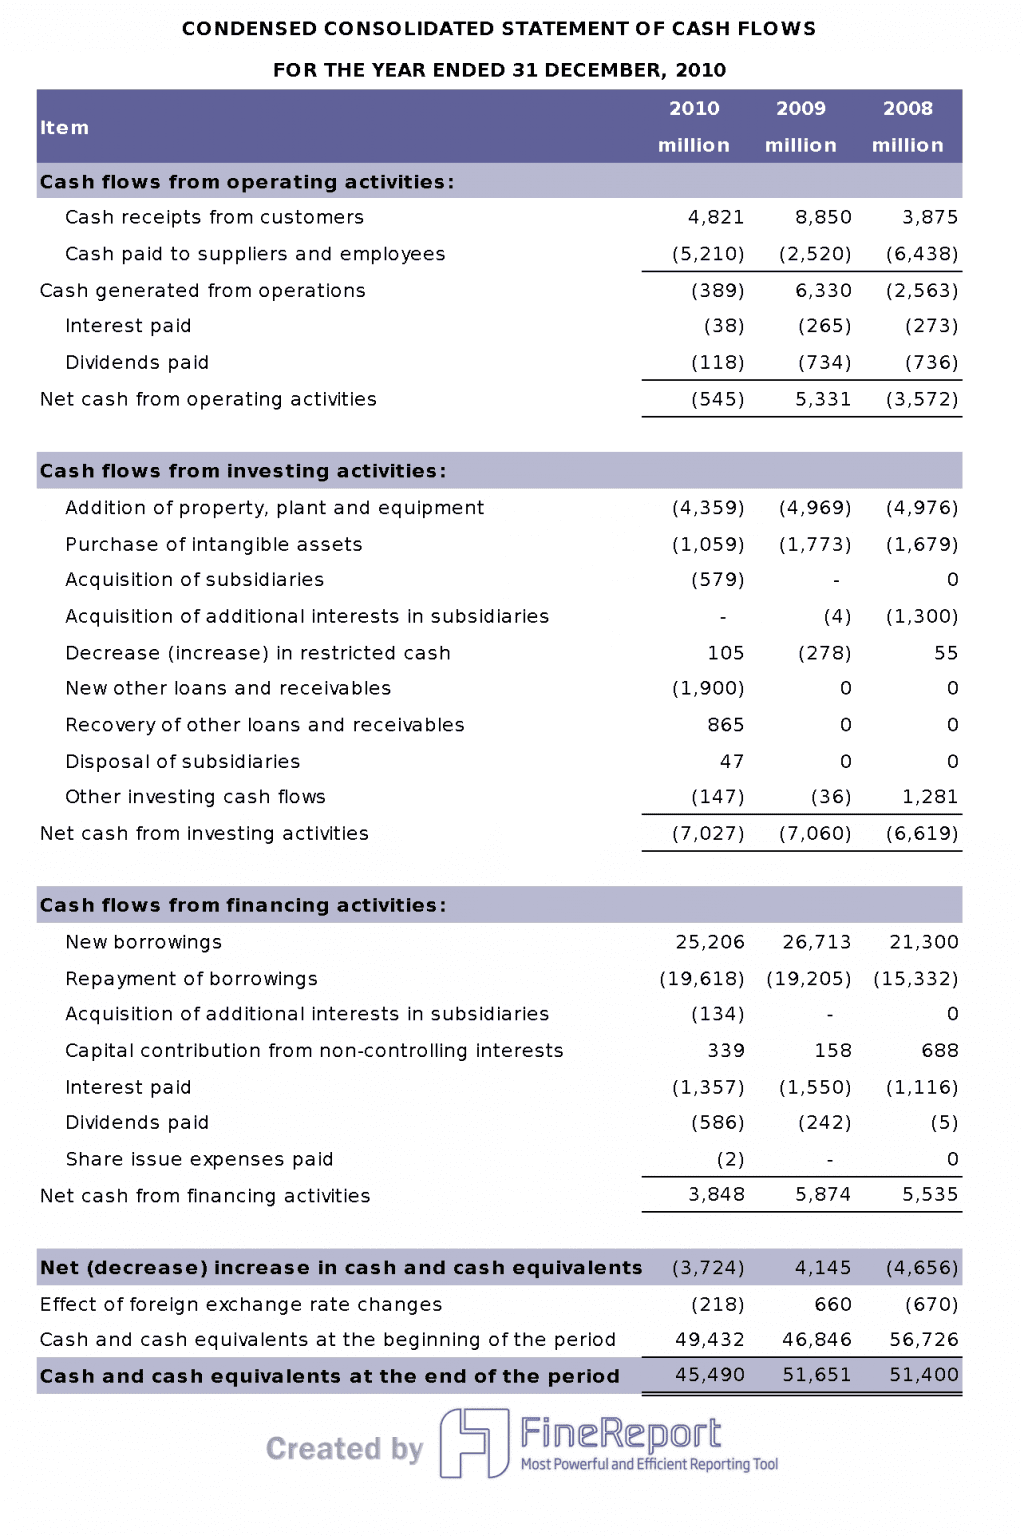
Use the cash flow statement to test reality
The cash flow statement is where many readers find the truth behind reported earnings. It shows how cash moved through the business and whether accounting profit translated into liquidity.
Break cash flow into operating, investing, and financing activities
The cash flow statement is divided into three sections:
Operating activities: Cash generated or used by the core business
Investing activities: Cash spent on or received from long-term assets and investments
Financing activities: Cash from debt, equity, dividends, and repayments
This breakdown shows where cash comes from and where it goes.
A simple interpretation framework:
Positive operating cash flow is usually a good sign
Negative investing cash flow may be normal if the company is investing for growth
Financing cash flow tells you whether the company relies on borrowing or external capital
Why does operating cash flow often give a clearer picture than profit alone? Because it reflects actual cash effects from operations, not just accounting recognition. A profitable company can still face liquidity stress if customers pay late or working capital expands too quickly.
Compare cash flow with profit and balance sheet changes
This is where true financial report reading becomes powerful. Connect the cash flow statement with balance sheet movements and income statement results.
Examples:
If receivables increase, revenue may be growing faster than collections
If inventory rises, cash is tied up in unsold goods
If debt increases, financing may be supporting operations or expansion
If capital spending is high, negative investing cash flow may be strategic rather than concerning
You can identify businesses that report profit but struggle to generate cash by watching for patterns like:
Net income rising while operating cash flow stays weak
Large working capital outflows
Frequent borrowing to support day-to-day liquidity
Persistent negative free cash flow without a clear growth payoff
In practice, cash flow helps answer the most important operational question: Is this business self-sustaining, or is it depending on external funding to keep going?
How to read financial reports together
The best analysts do not read these statements separately. They read them as connected evidence. That is how you turn a financial report into a decision-making tool.
Use a simple step-by-step review process
Here is a practical review process that works for beginners and busy managers alike:
Start with the business model and reporting period
Know what the company sells, how it makes money, and whether the report covers a quarter, full year, or trailing period.
Check the balance sheet first
Review cash, receivables, inventory, debt, and equity. Look for major changes from prior periods.
Move to the income statement
Evaluate revenue growth, margins, expense control, and net income quality.
Then review the cash flow statement
Confirm whether operating cash flow supports reported earnings.
Read notes, accounting policies, and management discussion
Use them to understand assumptions, unusual items, segment performance, and risks.
This process reduces the chance of being misled by one strong-looking number.
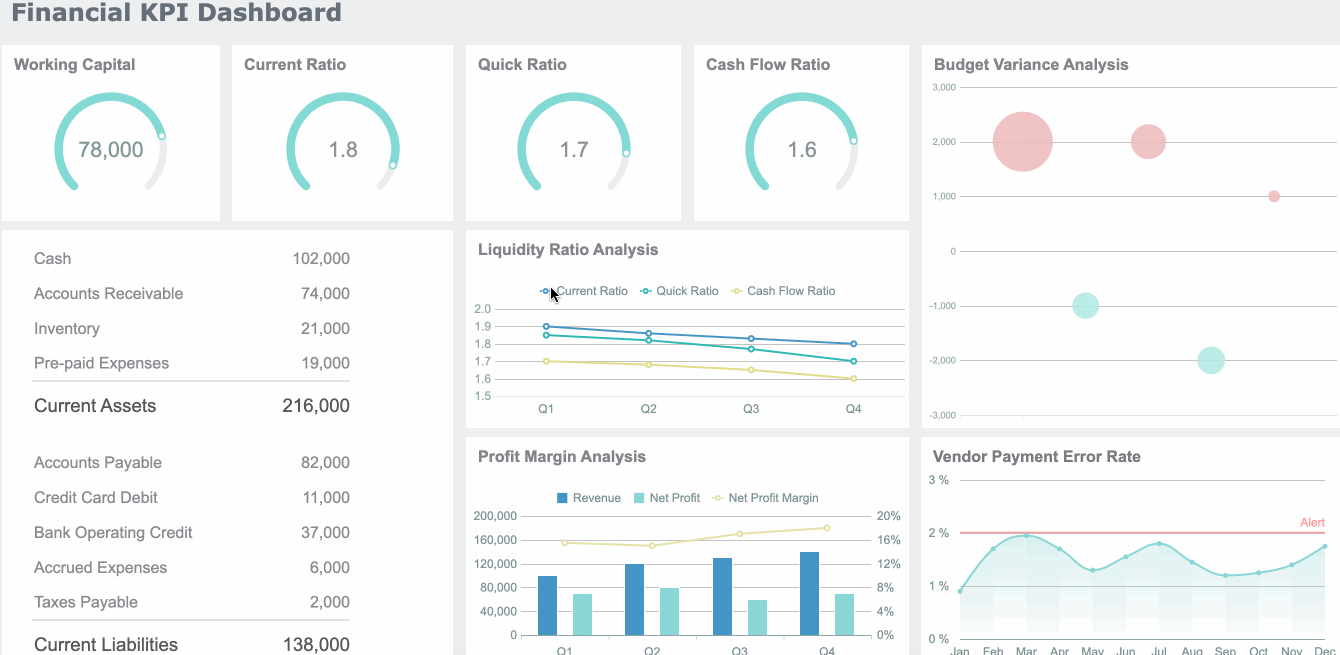
Apply basic ratio and trend analysis
You do not need advanced modeling to extract value from a financial report. A few basic ratios and trend checks go a long way.
Useful beginner-level ratios include:
Current Ratio = Current Assets / Current Liabilities
Measures short-term liquidity
Net Margin = Net Income / Revenue
Measures final earnings performance
Debt-to-Equity Ratio = Total Debt / Equity
Measures leverage
Operating Cash Flow to Net Income
Measures cash conversion quality
Trend analysis is just as important as ratios. Compare multiple periods rather than relying on one year alone. A single number can look acceptable in isolation while hiding deterioration over time.
A basic understanding of a company’s financial statements helps better decisions because it improves your ability to answer practical questions:
Is the business becoming stronger or weaker?
Is profit quality improving?
Can the company meet obligations without stress?
Are growth claims backed by cash?
Do reported results fit the underlying economics of the business?
Common reporting formats, special cases, and practical next steps
Not every financial report looks identical. Terminology, structure, and disclosure detail can vary across company types, industries, and public entities. The core logic remains the same, but context matters.
Recognize different types of financial statements and reports
You may encounter several reporting formats, including:
Annual reports: Broader, more complete, often including strategy, management commentary, and full-year audited financial statements
Quarterly reports: Shorter and more frequent, useful for tracking performance trends during the year
Management reports: Internal reports tailored to operational decision-making, often with dashboards and KPI views
Government financial reports: Public-sector reports with different terminology, fund structures, and compliance frameworks
Format and terminology may vary across companies, industries, and public entities. For example:
Retail businesses may emphasize inventory turnover
SaaS businesses may emphasize deferred revenue and recurring margins
Manufacturers may require closer attention to working capital and capital expenditure
Public entities may present financial information under different standards and reporting objectives
Read disclosures, policies, and red flags with care
Footnotes and accounting policies are not optional reading if you want to interpret a financial report correctly. They explain how numbers were prepared and what assumptions shaped them.
Pay particular attention to:
Revenue recognition policies
Inventory valuation methods
Depreciation and amortization assumptions
Impairment judgments
Debt terms and maturity schedules
Contingent liabilities
Segment disclosures
Non-recurring adjustments
Common red flags include:
Aggressive revenue recognition: Revenue grows faster than cash collections
Weak cash conversion: Profit looks strong, but operating cash flow does not follow
Unusual adjustments: Frequent “one-time” items that appear every year
Rapid debt growth: Borrowing increases without clear return on investment
Inventory buildup: Stock rises faster than sales
Receivables expansion: Customers may be paying slower, or sales quality may be weakening
Here is a practical checklist you can use when reviewing any financial report:
Confirm the reporting period and business model
Review cash, debt, receivables, inventory, and equity
Check revenue growth and margin direction
Compare net income with operating cash flow
Identify major changes from prior periods
Read notes for policies, assumptions, and unusual items
Look for patterns across several periods, not just one
Flag any mismatch between profit, liquidity, and leverage
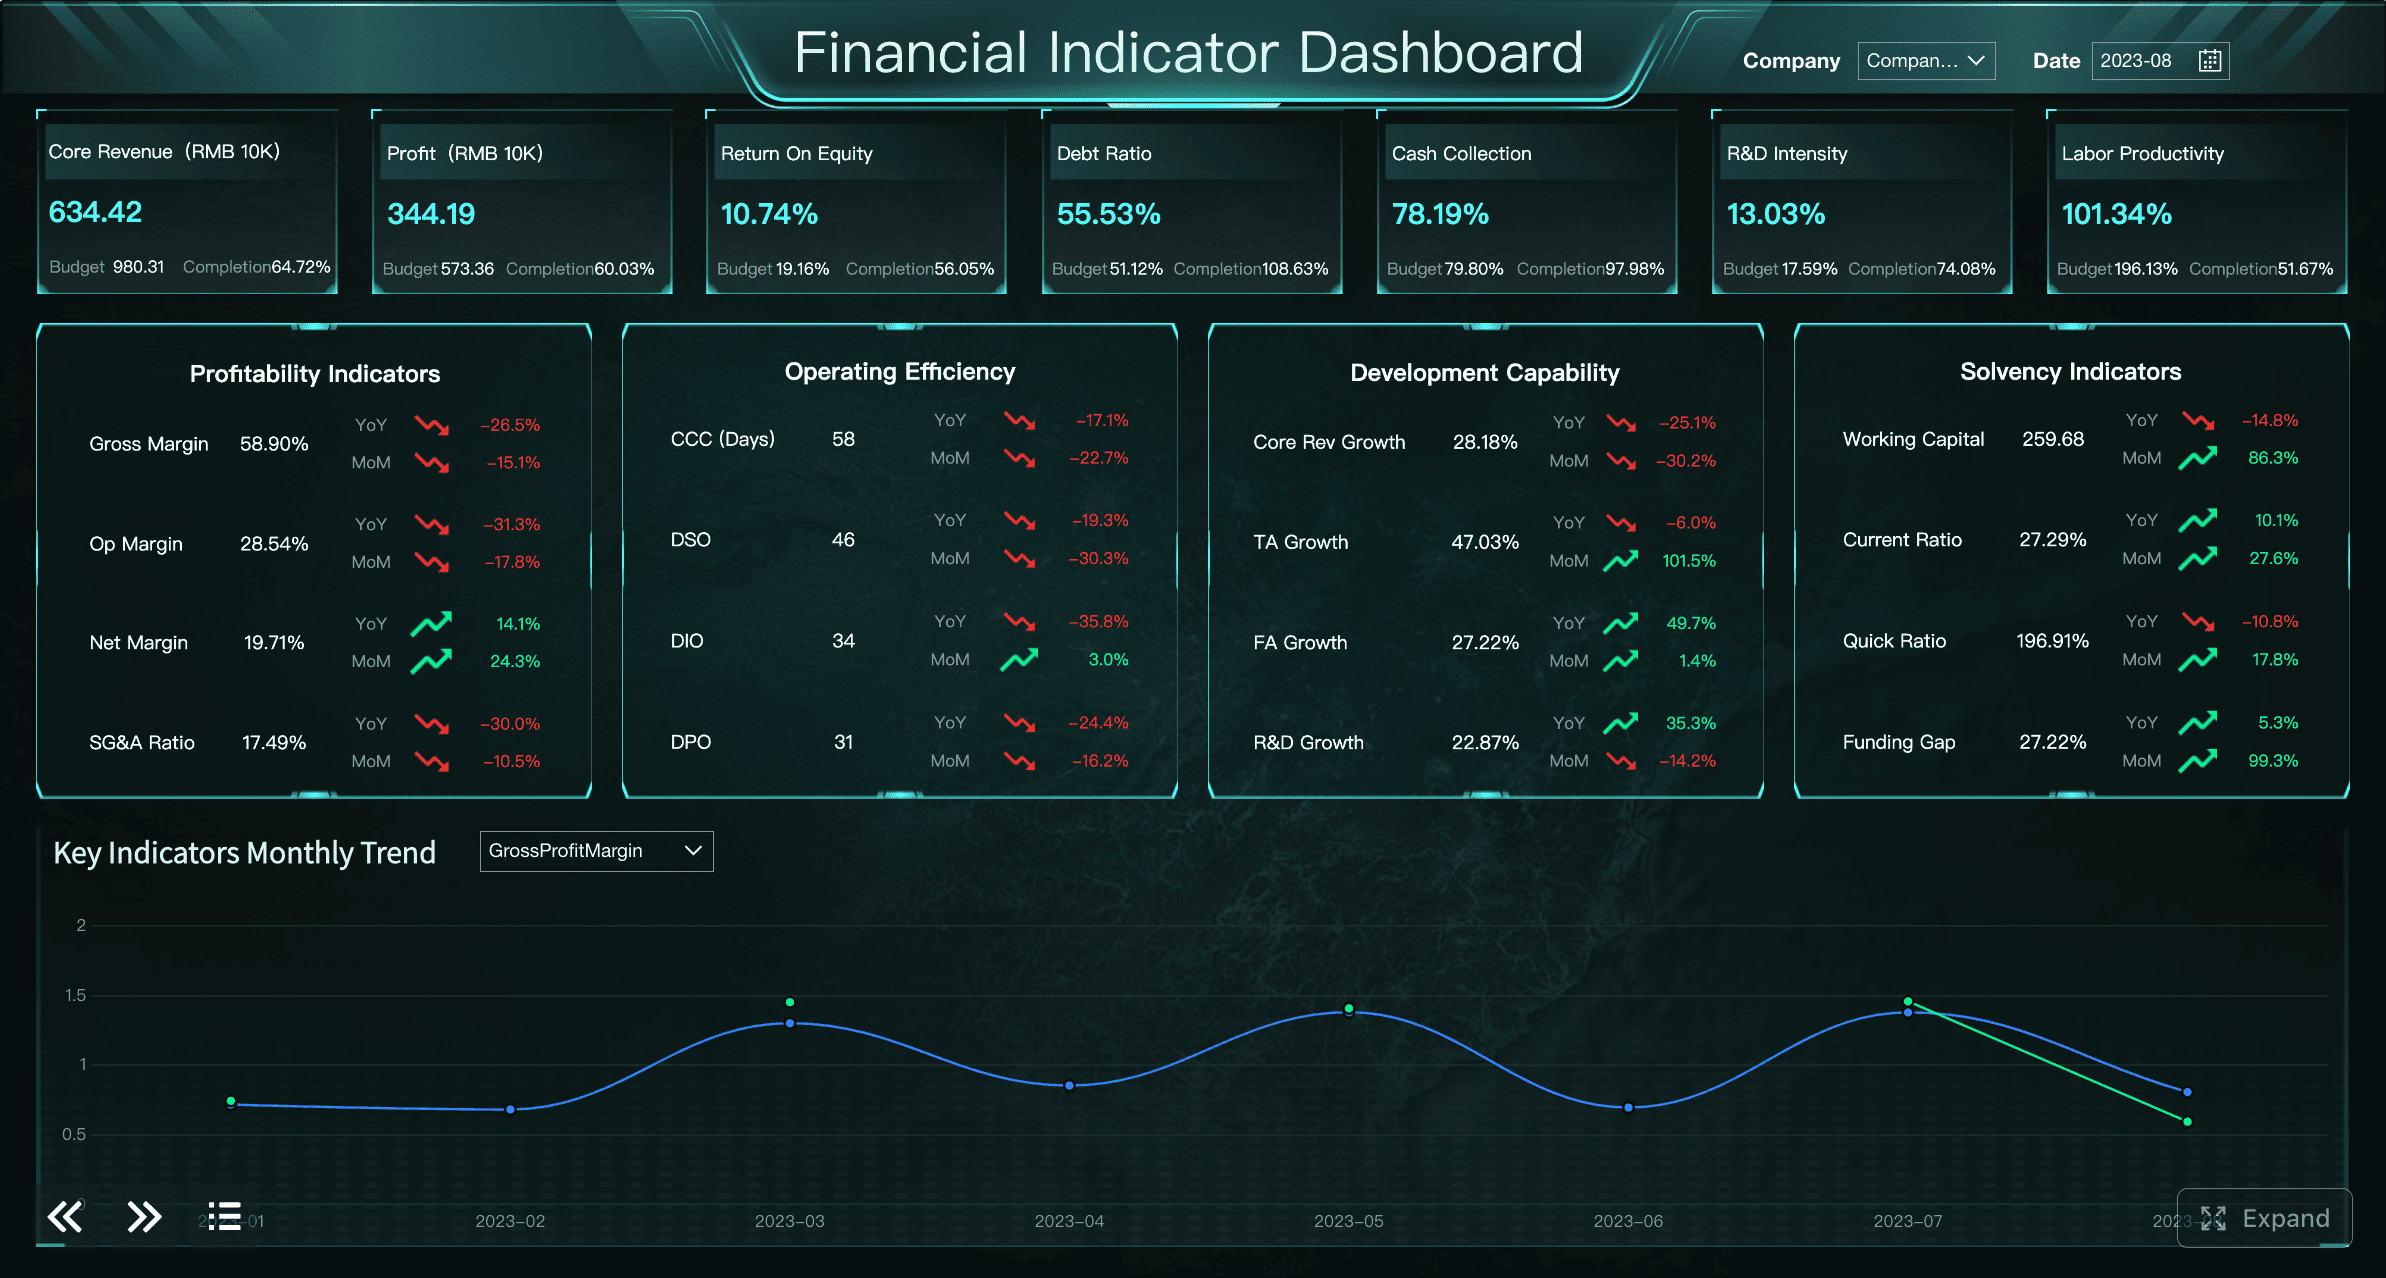
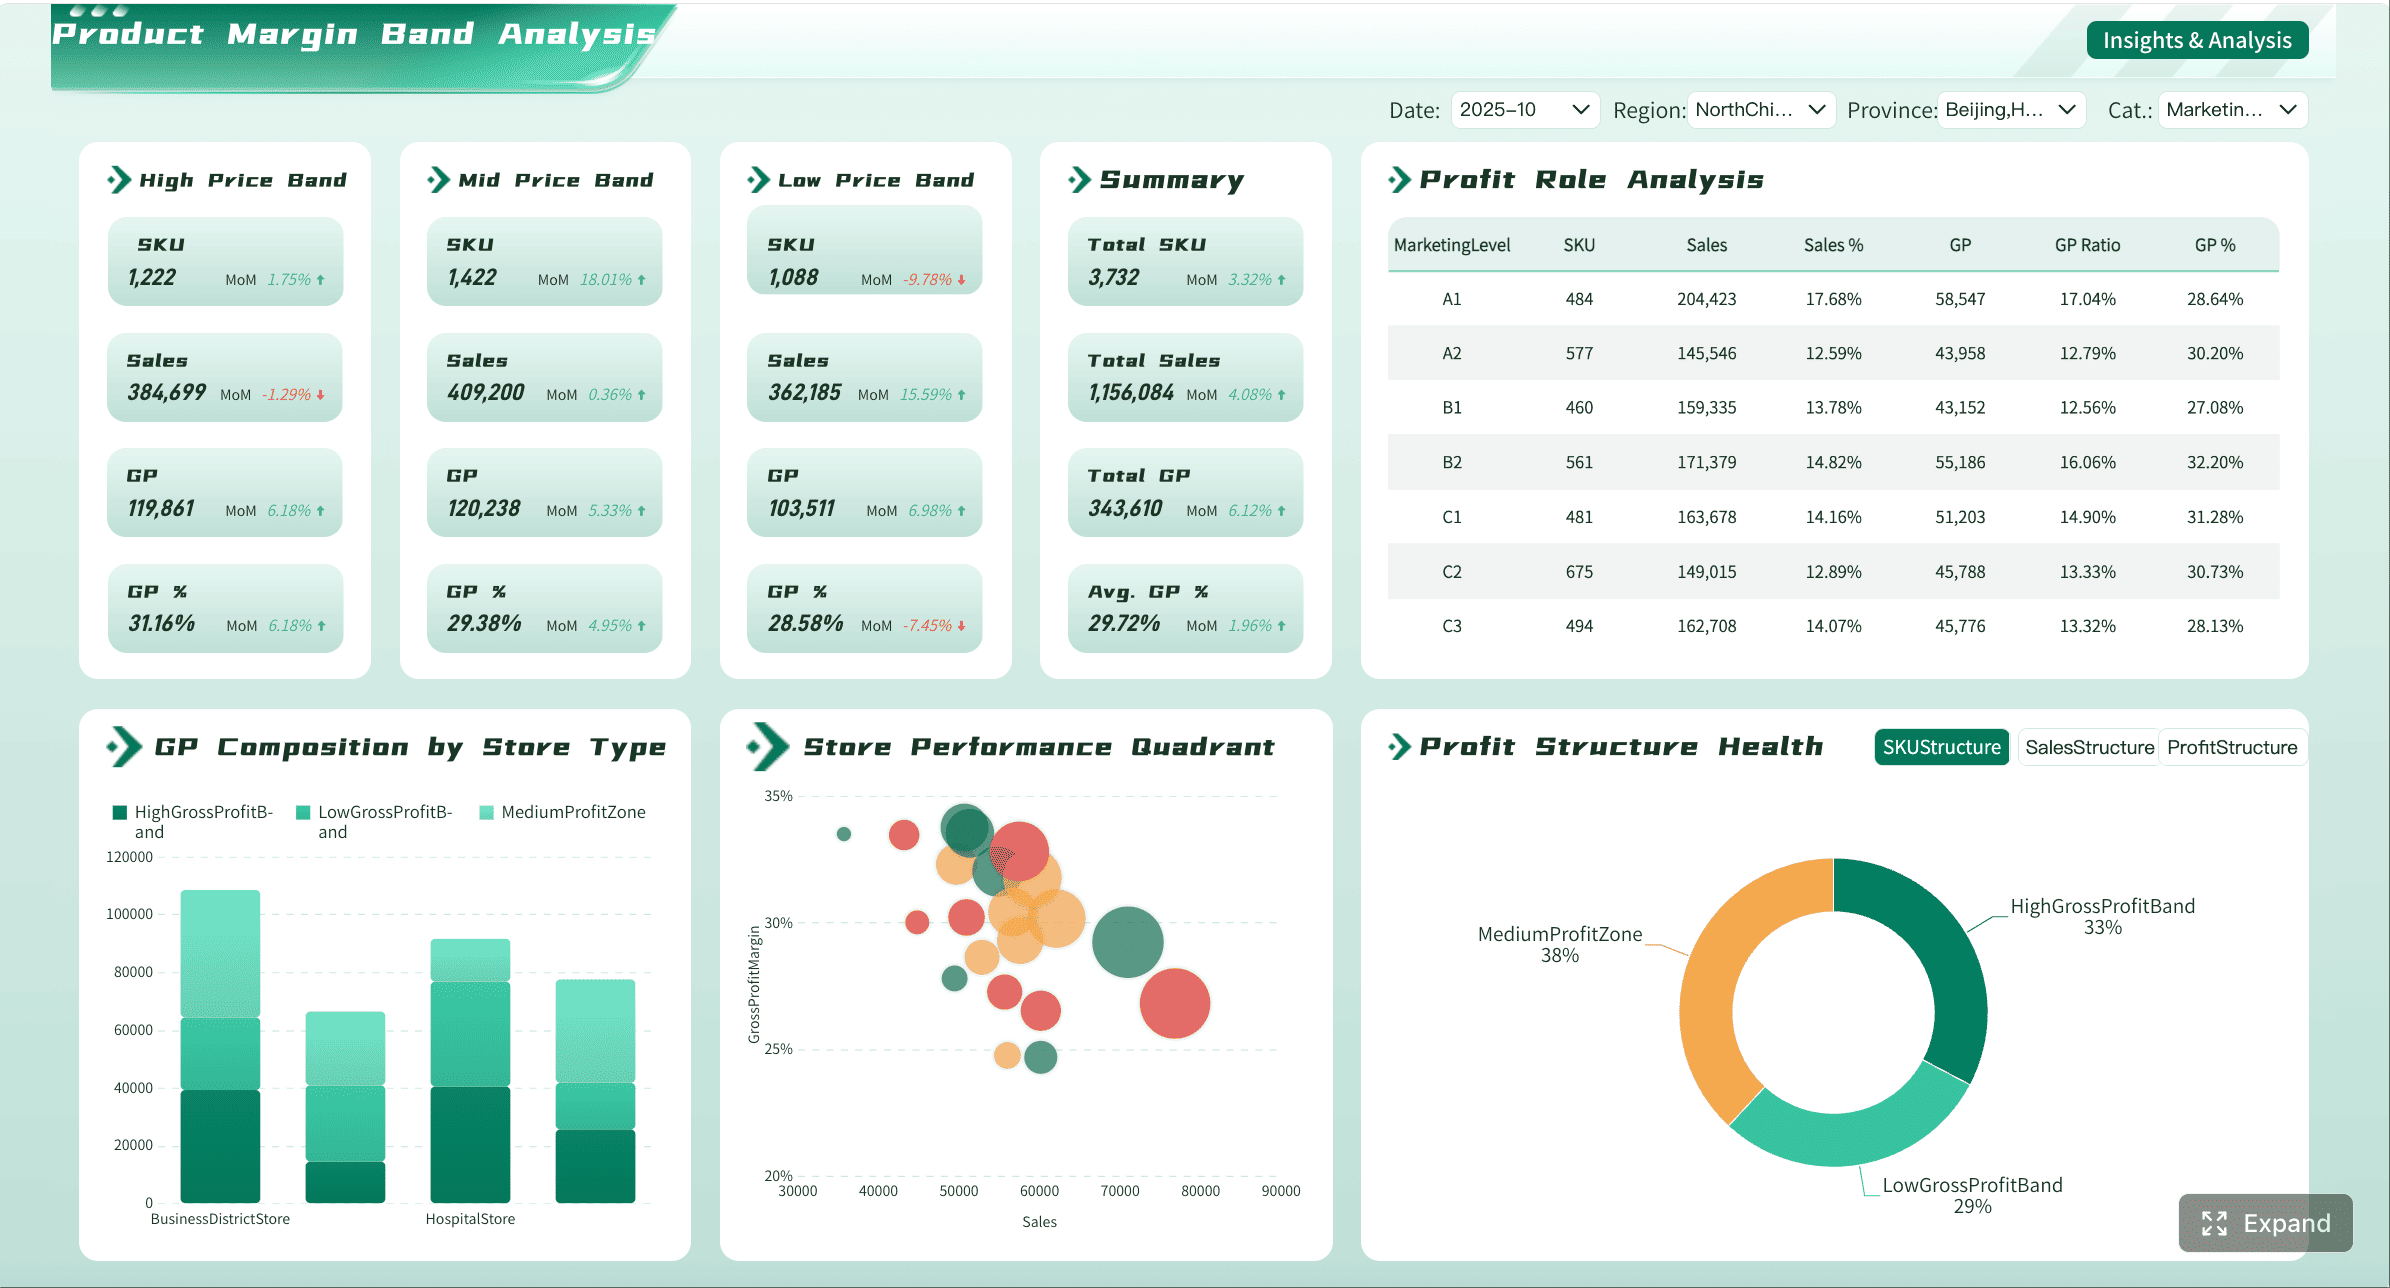
Build a clearer financial reporting workflow with FineReport
Reading a financial report is only the first step. In most organizations, the harder challenge is turning static statements into reliable, repeatable, decision-ready reporting. Building this manually is complex; use FineReport to utilize ready-made templates and automate this entire workflow.
Get Ready-to-Use Dashboard Templates in Fine Gallery
For enterprise teams, manual spreadsheet reporting creates familiar problems:
Disconnected data from ERP, accounting systems, and business platforms
Slow monthly close and reporting cycles
Inconsistent metric definitions across departments
Limited drill-down for managers who need answers fast
High maintenance and version-control risk
FineReport helps solve this by giving finance and operations teams a practical reporting platform for building:
Balance sheet, income statement, and cash flow dashboards
Automated management reporting packages
Multi-period financial trend analysis
Drill-down reports for receivables, expenses, margins, and cash flow
Executive dashboards with role-based access and scheduled distribution
Because FineReport supports complex enterprise reporting, low-code report design, dashboard visualization, scheduled output, and multi-source integration, it is well suited for teams that need more than static exports. It helps move finance from manual reporting to faster, more trustworthy decision support.
After you define the review process and KPI structure in this guide, the next logical step is to operationalize it in a system your team can actually use.
If your goal is to standardize financial report analysis, improve visibility, and reduce manual reporting effort, FineReport is a strong place to start. It enables finance teams to turn the balance sheet, income statement, and cash flow statement into one connected reporting experience for executives, analysts, and business leaders.
The three core statements are the balance sheet, income statement, and cash flow statement. Together, they show financial position, profitability over time, and actual cash movement.
Start with the balance sheet to understand assets, liabilities, and equity, then review the income statement for revenue and profit, and finish with the cash flow statement to see whether profit is turning into cash. This sequence helps you connect stability, performance, and liquidity.
A company can report profit without collecting cash quickly enough to pay bills, debt, or suppliers. Strong cash flow confirms whether earnings are supported by real cash generation.
Focus first on revenue, gross profit, operating profit, net income, operating cash flow, cash balance, current ratio, debt, accounts receivable, inventory, and equity. These metrics give a fast view of growth, profitability, liquidity, and risk.
Net income from the income statement affects equity on the balance sheet, while cash flow explains why cash changed during the period. Reading them together helps you see whether reported performance is backed by a healthy financial position and real cash inflows.
Product Trial
FineReport
Pixel-perfect reports · Interactive dashboards · Easy data entry · Digital twins