A strong retail sales report dashboard gives retail leaders one thing they rarely have enough of: clarity across every store, region, and channel. If you manage multiple locations, the real challenge is not collecting data—it is turning fragmented POS, ecommerce, inventory, and finance data into fast decisions on sales, margin, staffing, replenishment, and underperforming stores. Without a structured dashboard, regional managers chase spreadsheets, store leaders argue over numbers, and executives lose time trying to understand what actually changed.
All reports in this article are built with FineReport
1. Define the purpose of your retail sales report dashboard
Before choosing charts or KPIs, define what your dashboard must help the business do. A retail sales report is not just a scorecard. It should support operational decisions across stores, reveal exceptions early, and standardize how performance is reviewed.
Clarify which business decisions the dashboard should support across all stores
Start with the decisions, not the visuals. Your dashboard should answer questions such as:
Which stores are missing sales targets?
Is the issue traffic, conversion, basket size, or inventory availability?
Which regions need staffing, pricing, or merchandising intervention?
Are sales declines caused by internal execution or broader market conditions?
Which stores or brands should be expanded, optimized, or phased out?
If the dashboard cannot drive action, it becomes a reporting artifact instead of a management tool.
Identify the primary users, such as owners, regional managers, and store leaders
Different users need different levels of detail.
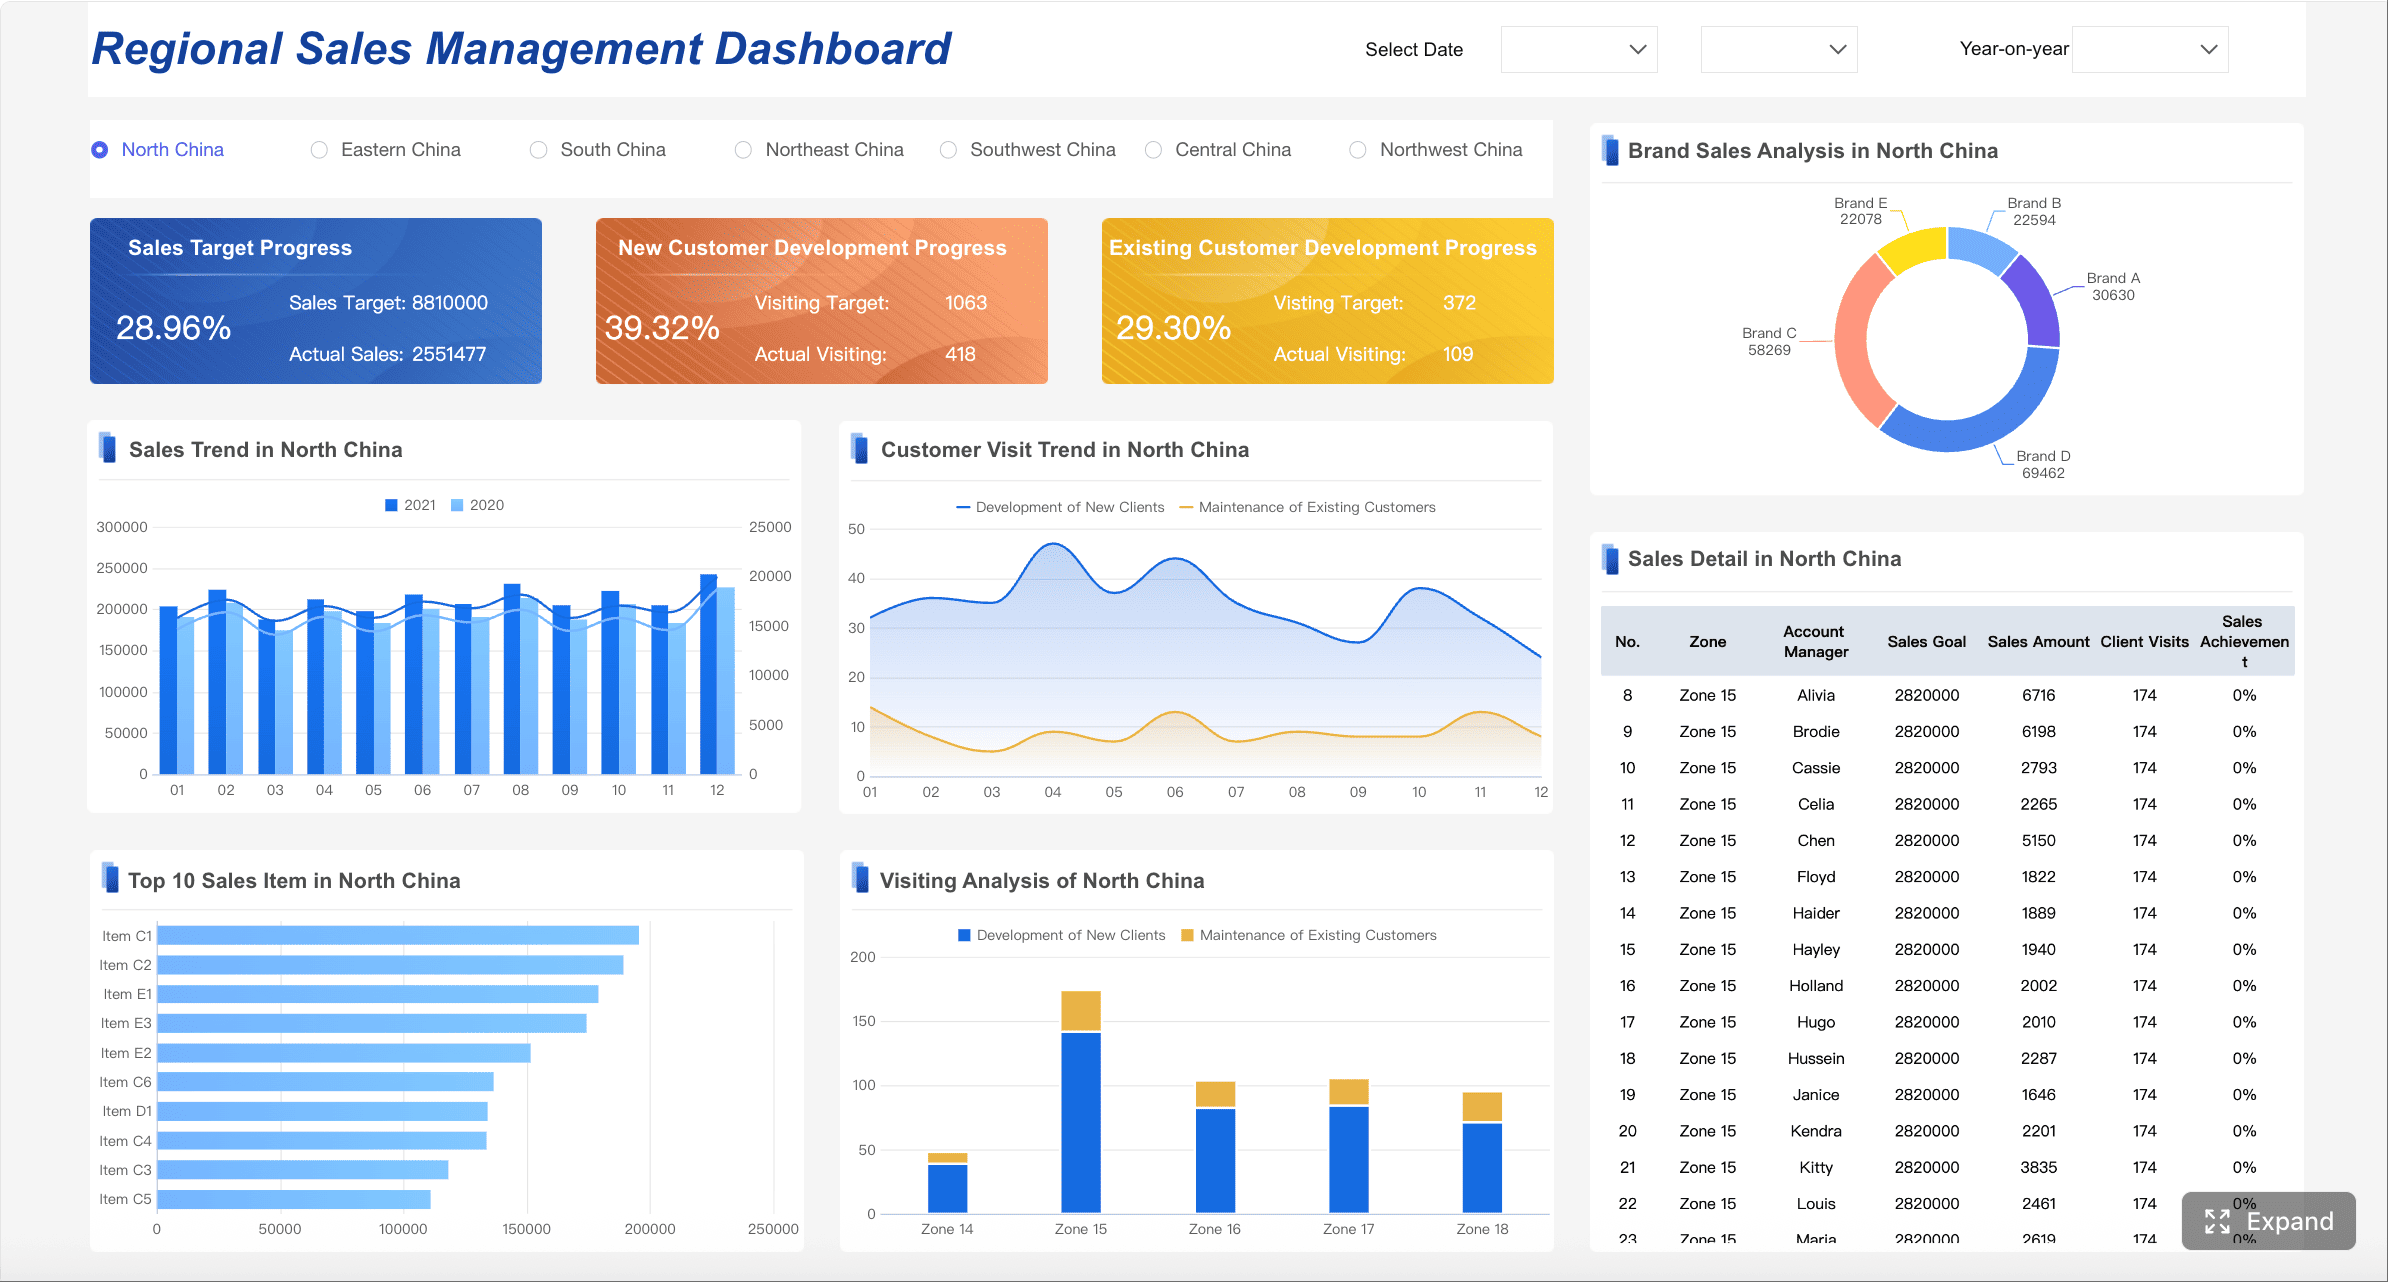
Owners and executives need a company-wide view, target attainment, margin health, and exception summaries.
Regional managers need store comparisons, district trends, ranking tables, and alert-driven follow-up.
Store leaders need daily sales, labor-related performance, conversion, returns, and stock-related causes.
A well-designed retail sales report dashboard should support summary-to-detail drilldown rather than forcing all users into the same view.
Decide how often data should refresh: daily, weekly, or monthly
Refresh frequency must match the decision cycle.
Daily for store operations, promotions, stockouts, and exception detection
Weekly for regional reviews, staffing, and tactical adjustments
Monthly for executive planning, trend review, and budget discussions
Many retailers fail here by refreshing too slowly for store action or too frequently for data that has not been validated.
Set a clear reporting scope for store, region, channel, and company-wide views
Define the reporting layers upfront so users always know what they are looking at.
Typical scopes include:
Store level: daily execution and issue detection
District or region level: comparative performance and intervention priorities
Channel level: in-store vs ecommerce vs omnichannel performance
Company-wide level: topline growth, profitability, and strategic direction
This structure prevents confusion and ensures your retail sales report supports both local action and executive oversight.
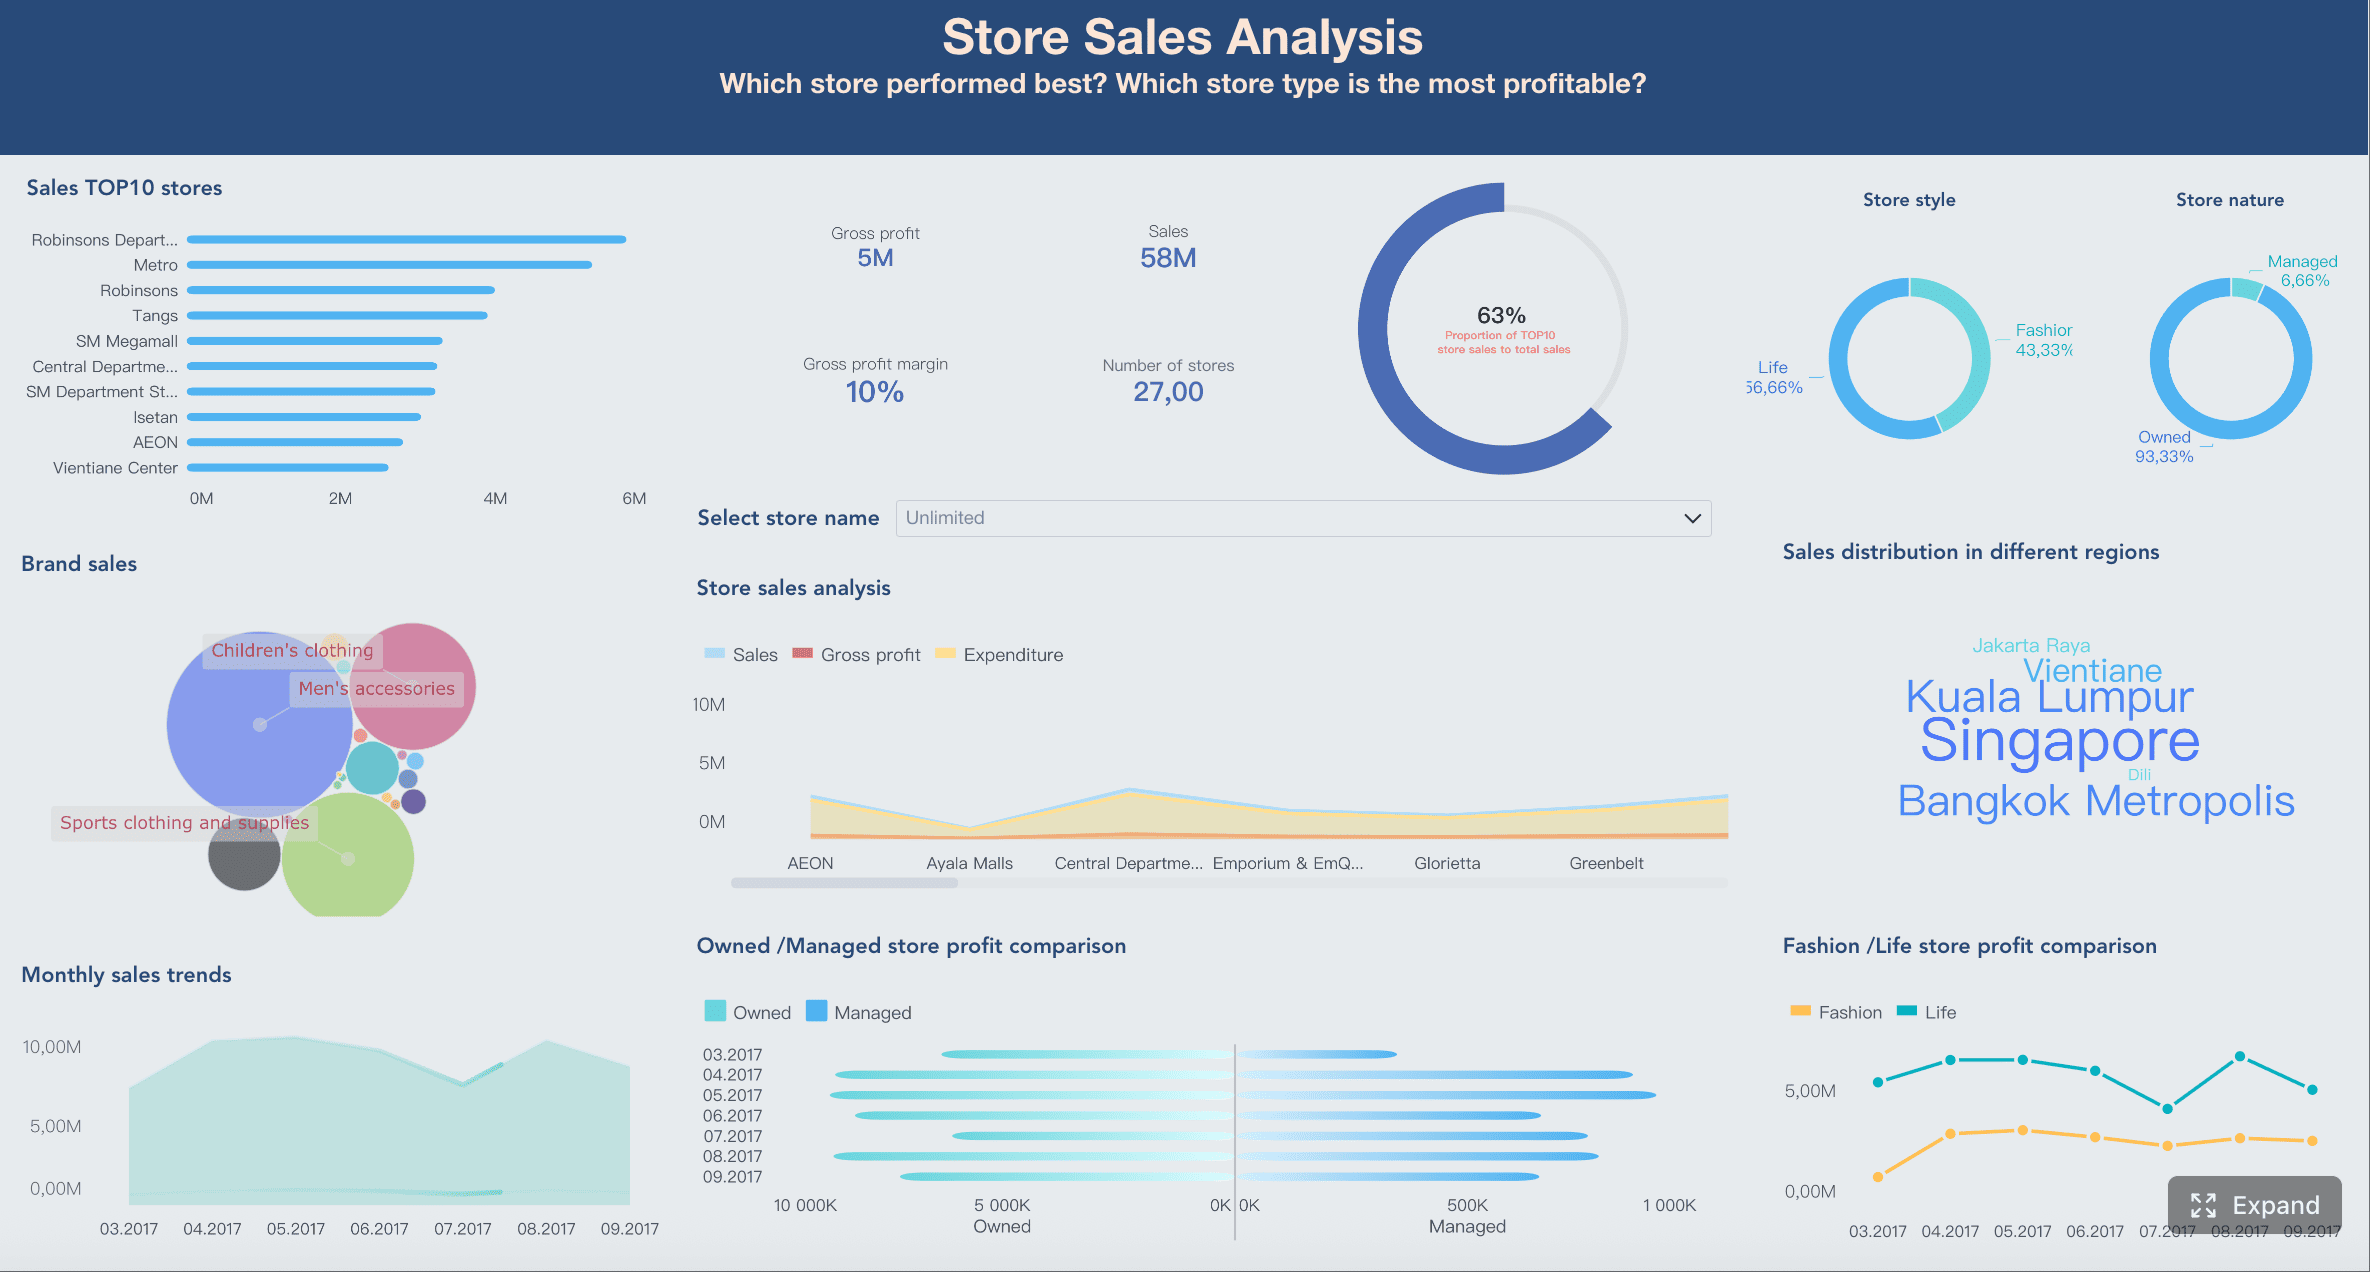
2. Choose the core metrics that matter most in retail sales report
The best dashboards are selective. They focus attention on the metrics that explain performance, not just describe it.
Key Metrics (KPIs)
Below is a practical KPI framework for a multi-store retail sales report dashboard:
Total Sales: The total revenue generated in a selected period. This is the primary topline performance metric.
Sales Growth: The percentage increase or decrease versus a prior period. Useful for trend direction and momentum.
Average Transaction Value (ATV): Average revenue per transaction. Helps identify upselling and basket-building effectiveness.
Units Per Transaction (UPT): Average number of items sold per transaction. Indicates cross-sell and merchandising impact.
Gross Margin: Sales minus cost of goods sold, shown as value or percentage. Critical for profitability tracking.
Target Attainment: Actual sales or margin versus plan. Shows whether stores are meeting expectations.
Same-Store Sales: Growth from comparable stores open across both reporting periods. Removes distortion from openings and closures.
Store Ranking: Relative performance of locations based on selected KPIs. Useful for coaching and intervention.
Regional Trend: Aggregated performance by district or region. Helps identify geographic patterns.
Conversion Rate: Percentage of visitors who made a purchase. Connects store traffic to sales outcomes.
Foot Traffic: Number of visitors entering the store. Helps separate demand issues from selling issues.
Stockout Rate: Frequency or percentage of unavailable items. A major driver of missed sales.
Return Rate: Percentage of sold items or revenue returned. Can reveal quality, service, or pricing issues.
Markdown Impact: Revenue or margin effect of discounting. Important for balancing sell-through and profitability.
Sales performance metrics
Your first dashboard layer should cover overall sales health. The most important measures are:
These metrics work best when shown with clear comparison logic:
Period-over-period for short-term movement
Year-over-year for seasonality-aware comparison
Plan vs actual for accountability
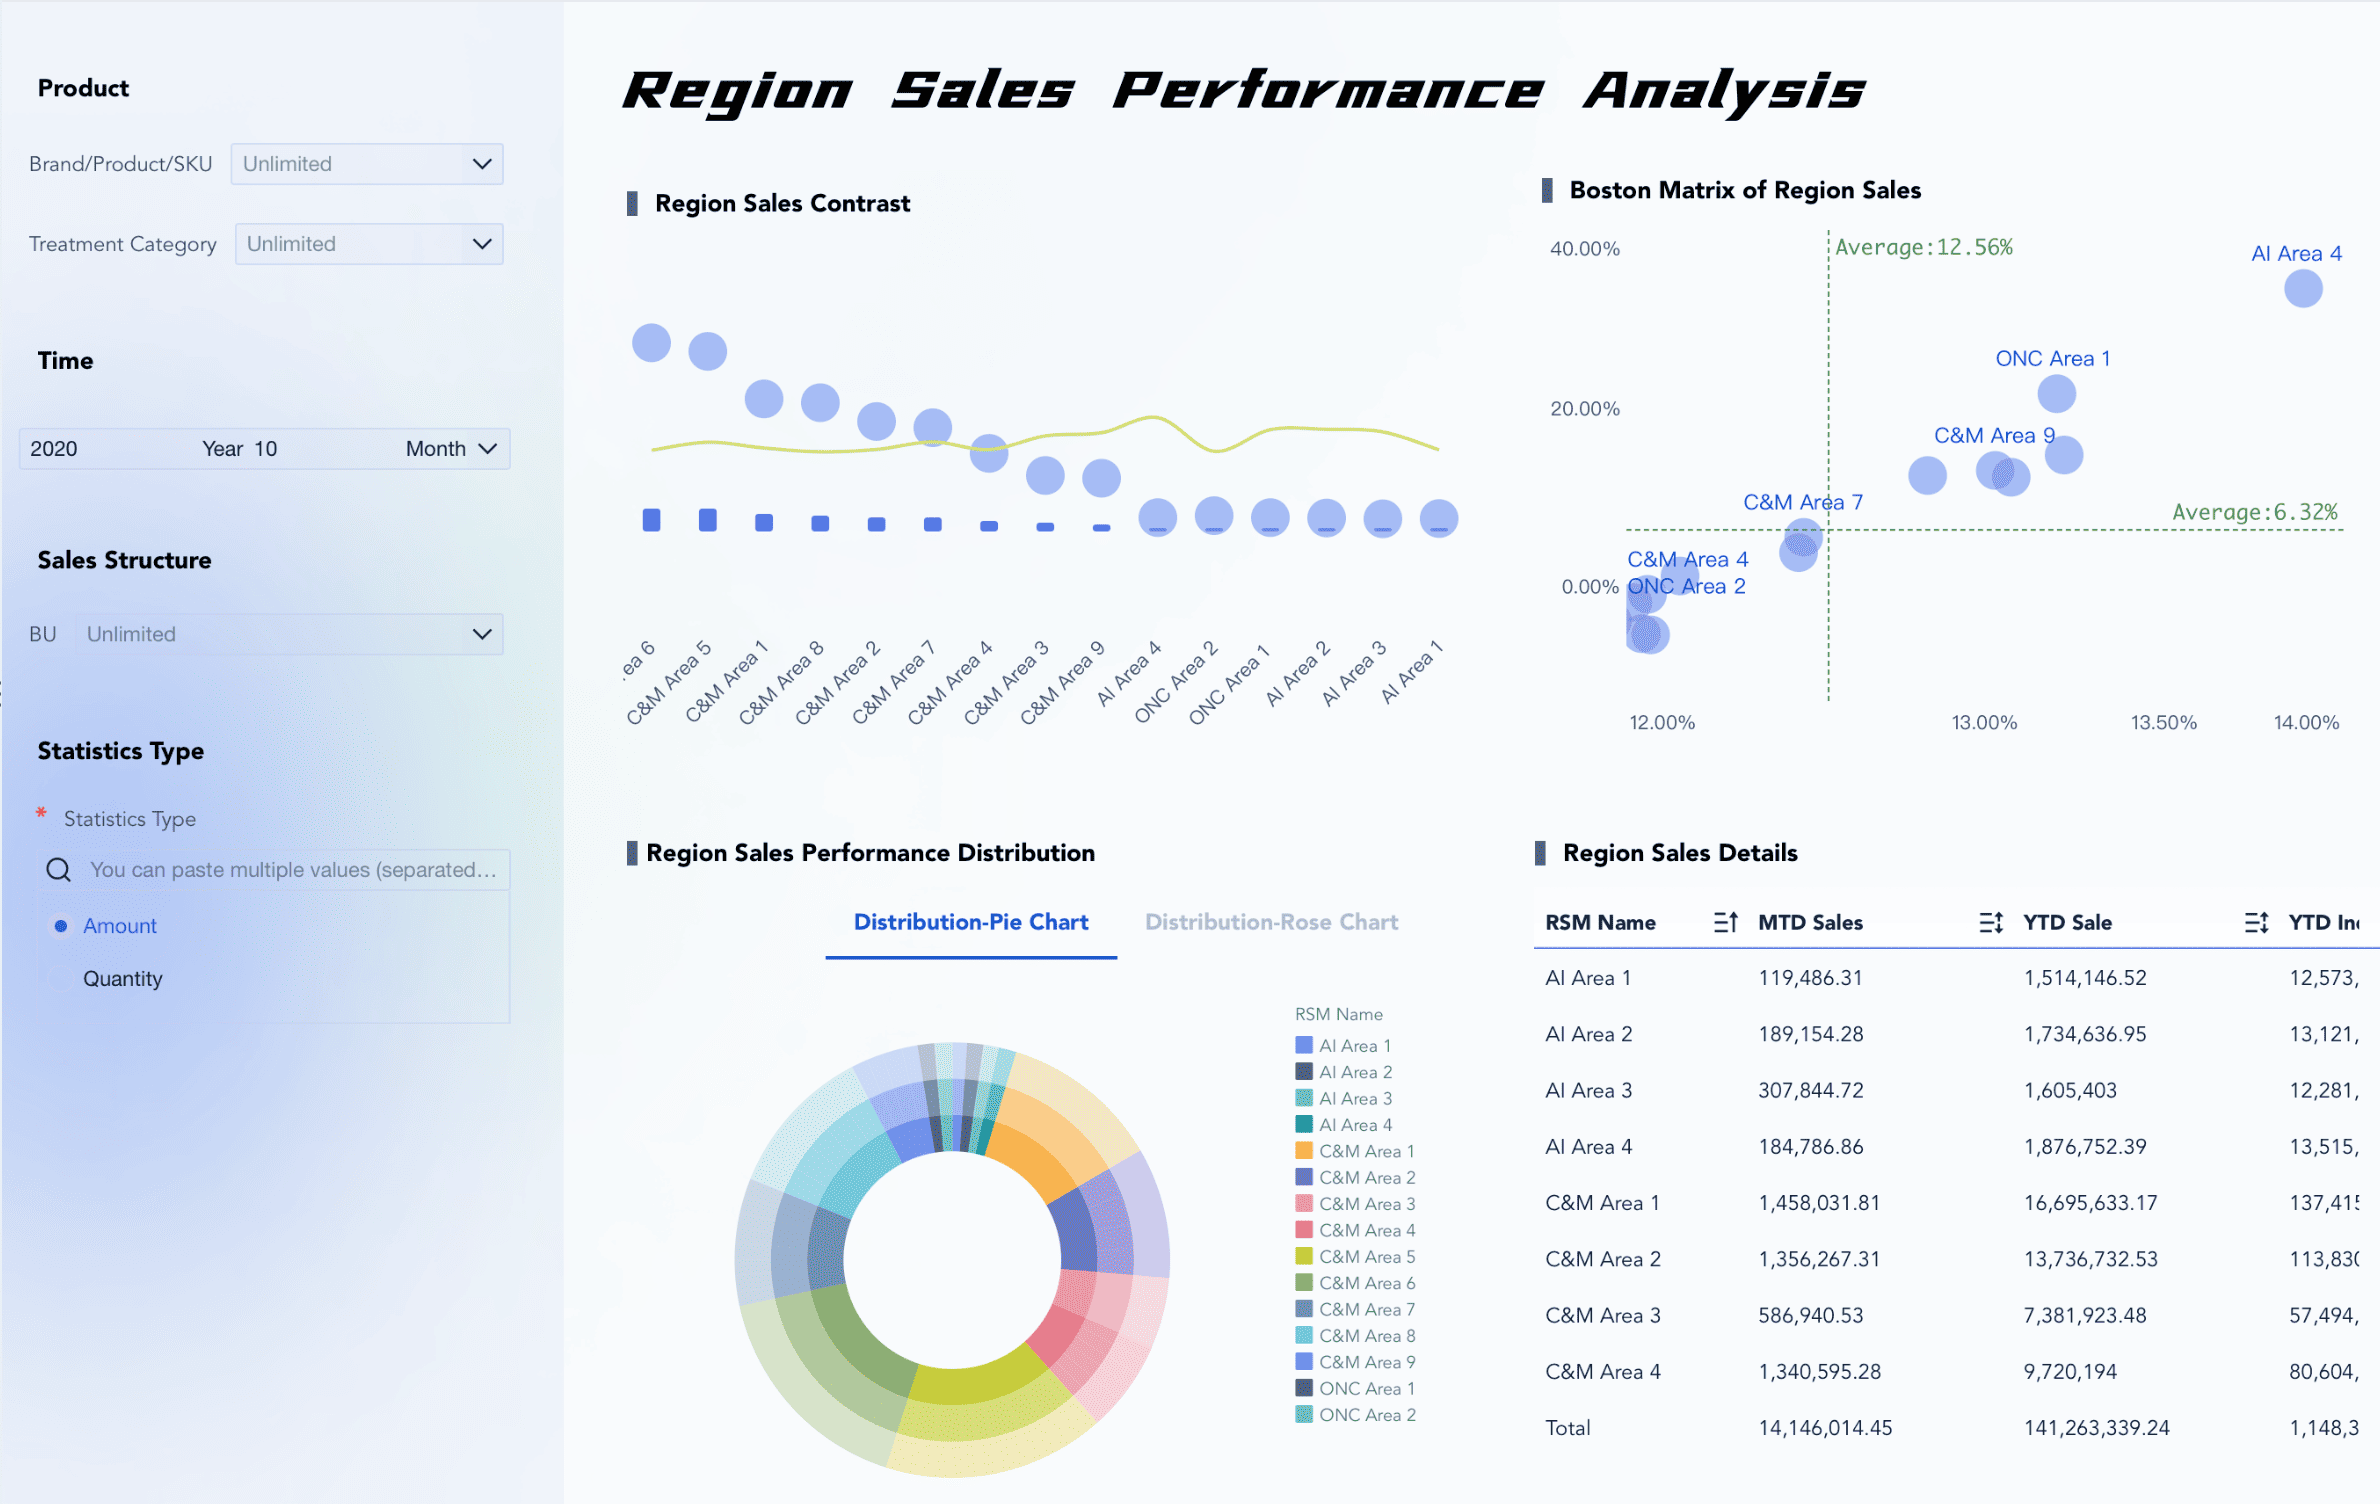
Store comparison metrics
Multi-store retailers need comparative visibility, not just totals. A store with rising sales may still be underperforming peers in a similar market.
Key comparison metrics include:
Same-store sales
Top-performing and bottom-performing stores
Regional trend comparisons
Exception-based outlier detection
Ranking by sales, growth, or margin
This helps leadership prioritize where to investigate first instead of reviewing every location equally.
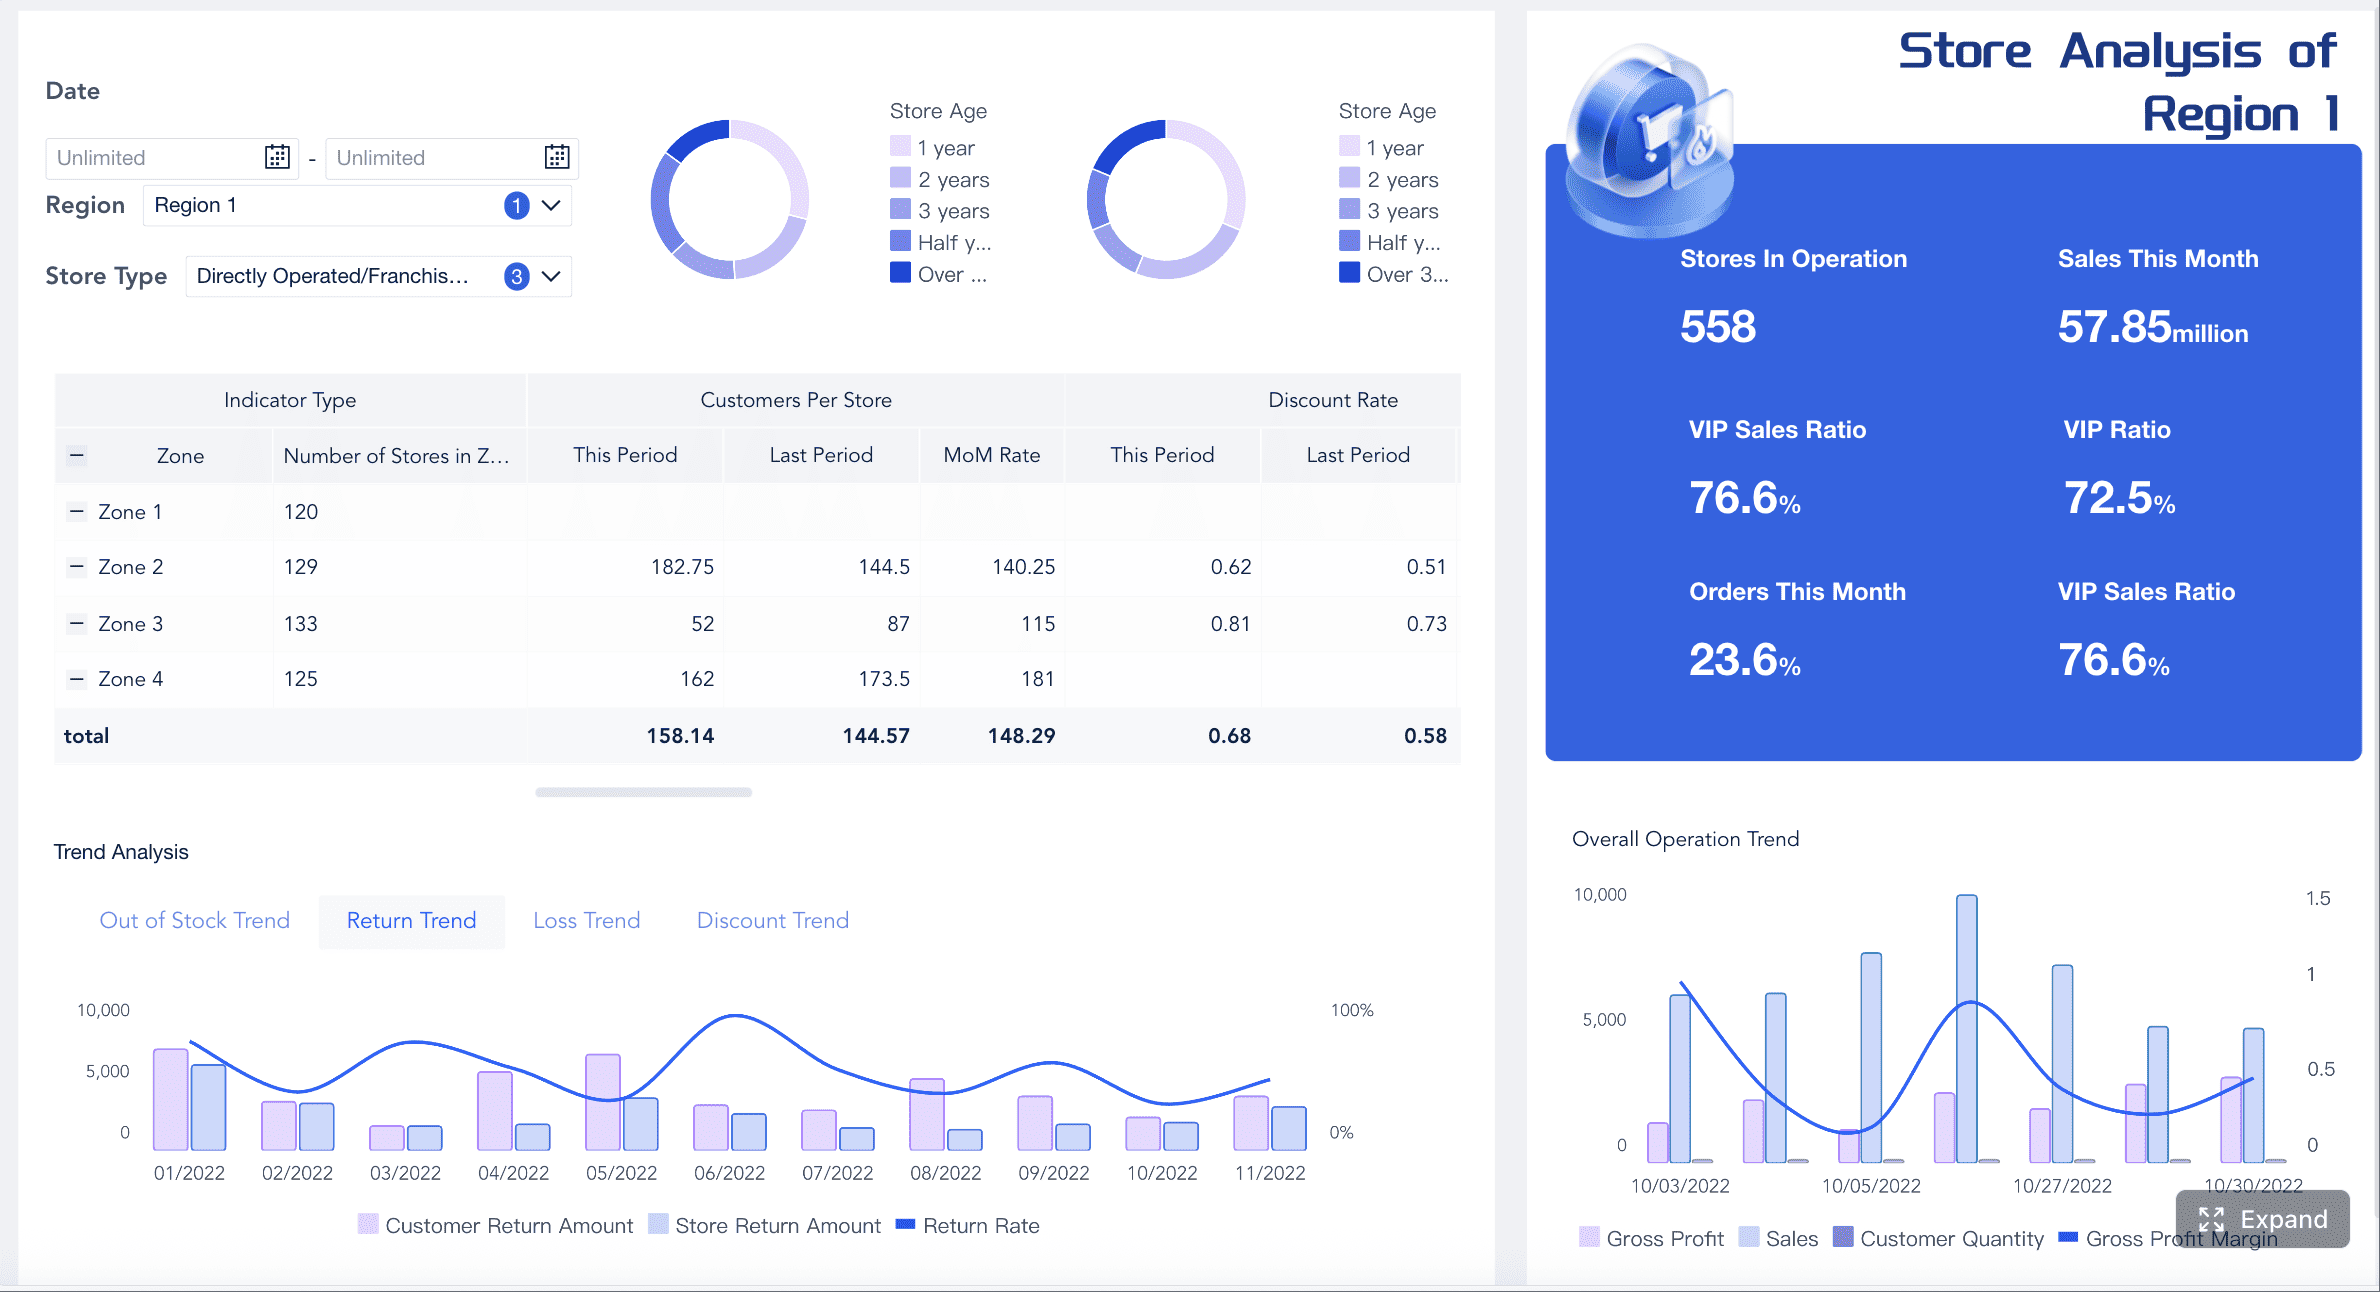
Customer and inventory signals
Sales outcomes are often symptoms. To diagnose root causes, your retail sales report should include operational signals.
Monitor:
Conversion rate
Foot traffic
Stockouts
Return rate
Markdown impact
These metrics connect commercial performance to operational execution. For example:
High traffic + low conversion may point to staffing or product fit issues
Strong demand + high stockouts may explain lost revenue
Rising sales + falling margin may signal over-discounting
Elevated returns may indicate product or service problems
3. Structure data sources for multi-store reporting
A dashboard is only as reliable as its data model. In multi-store retail, the biggest reporting failures usually come from inconsistent store mappings, disconnected systems, and conflicting calendar logic.
Internal data to connect
For a complete retail sales report, connect the systems that directly affect store performance:
POS systems
Ecommerce platforms
Inventory and replenishment tools
Finance or ERP records
Promotion and pricing systems
Footfall or traffic counters, if available
Then standardize the core dimensions:
Store IDs
Store names
Region and district hierarchy
Product categories
Reporting periods
Channel definitions
Without this standardization, one store may appear under multiple names, regional totals may not reconcile, and period comparisons may break.
A strong enterprise setup often uses a layered approach: raw source ingestion, cleaned detail tables, summarized reporting tables, and application-ready dashboard views. That structure keeps metric definitions consistent across daily, weekly, and monthly reporting.
External benchmarks to reference
Internal performance alone does not tell the whole story. Executives often want to know whether performance changes are caused by company execution or by broader retail conditions.
Useful external context may include:
Public retail sales indicators
Category-level market trends
Regional economic signals
Consumer spending trends
Industry association benchmarks
Benchmark context is especially useful when leadership asks questions like:
Are weak results specific to our stores or affecting the whole market?
Is category softness temporary or structural?
Are regional declines tied to local economic pressure?
This added context makes your retail sales report more credible in executive reviews and board-level discussions.
4. Design retail sales report views that make trends easy to spot
Good dashboard design reduces time to insight. Great dashboard design reduces time to action. Your layout should guide users from summary to diagnosis.
Executive summary view
The first screen should work for a fast weekly review. Keep it simple, high-signal, and action-oriented.
6. Avoid common dashboard mistakes and improve adoption
Even well-funded retail reporting projects fail when usability and governance are ignored.
Common reporting mistakes
The most common mistakes I see are:
Overloading the dashboard with too many charts and vanity metrics
More visuals do not create more insight. They create slower decisions.
Mixing inconsistent date ranges or definitions across stores
If one region uses fiscal weeks and another uses calendar months, comparison breaks immediately.
Presenting data without action-oriented commentary
Numbers alone rarely drive change. Managers need context on why a metric matters and what to check next.
Hiding root causes behind summary views only
If users cannot drill into store, category, or period detail, they will return to spreadsheets.
Ignoring alerting and automated distribution
A dashboard people must remember to open is less effective than one that actively pushes critical exceptions.
Best practices for long-term use
To keep your retail sales report useful as the business grows:
Document metric definitions, formulas, and refresh schedules
Train store and regional managers on how to use the dashboard in real review routines
Standardize filters and drill paths so all users interpret data consistently
Revisit layout and KPIs as new stores, brands, and channels are added
Use mobile access for leaders who need daily visibility outside the office
Automate daily, weekly, and monthly reporting outputs to reduce manual work
7. Build faster with FineReport instead of managing this manually
Building a reliable multi-store retail sales report manually is complex. You need data integration, standardized KPI logic, drilldown design, permission control, alerting, mobile access, and recurring report distribution. That is a lot to maintain with spreadsheets or fragmented BI tools.
Building this manually is complex; use FineReport to utilize ready-made templates and automate this entire workflow.
FineReport helps retailers move from manual reporting to a scalable operating system for performance tracking. It is especially effective when you need to unify multiple systems, support different management roles, and automate recurring reporting.
Connect data from POS, ecommerce, ERP, finance, Excel, and other business systems
Build dashboard views for executives, regional managers, and store leaders
Support drilldown, linked analysis, and multi-condition filtering
Set threshold-based alerts for sales, margin, returns, and inventory exceptions
Automate daily and monthly report generation and distribution
Enable mobile access for leadership on the go
Manage permissions by role, department, or data scope
For enterprise retail environments, this matters because speed alone is not enough. You also need governance, consistency, and long-term maintainability.
[Insert Dashboard Demo Here: FineReport retail dashboard template with executive summary, regional drilldown, automated alerts, and scheduled report delivery]
If your current process still depends on manual spreadsheets, delayed monthly packs, or inconsistent store reporting, now is the right time to standardize your dashboard architecture and reporting workflow.
It should include core KPIs such as total sales, sales growth, gross margin, target attainment, same-store sales, store ranking, conversion rate, and stockout rate. The dashboard should also support drilldowns by store, region, and channel so managers can act quickly.
The right refresh cycle depends on the decisions it supports. Daily updates work best for store operations and stock issues, while weekly or monthly views are better for regional reviews and executive planning.
The most useful metrics are the ones that explain performance, not just summarize it. Retailers usually focus on sales, growth, margin, average transaction value, units per transaction, same-store sales, conversion, returns, and inventory-related indicators.
A strong dashboard connects outcomes to drivers like foot traffic, conversion, basket size, markdowns, and stock availability. This helps teams see whether the problem is demand, selling execution, pricing, or inventory.
Total sales measure all revenue in the selected period across included locations or channels. Same-store sales compare only locations that were open in both periods, making trend analysis more accurate when stores open or close.
Product Trial
FineReport
Pixel-perfect reports · Interactive dashboards · Easy data entry · Digital twins