A procurement savings dashboard gives you a real-time view of how your procurement activities impact your company’s finance performance. You can track spending, monitor supplier costs, and uncover savings opportunities. By centralizing procurement and finance data, you gain better control over budgets and make smarter finance decisions that support your company’s finance goals.

A procurement savings dashboard gives you a clear view of how your procurement activities affect your company's finance goals. You see the total cost savings, track key performance indicators, and visualize your progress toward targets. The dashboard displays important components in a simple format, making it easy for you to understand the impact of your procurement decisions.
| Component | Description |
|---|---|
| Cost Savings | Tracks total savings realized and cost avoidance. |
| KPIs | Metrics like savings against target goals. |
| Visuals | Bar charts for savings by category, line charts for savings over time. Visual cues for targets. |
| Purpose | Demonstrates the ROI of procurement efforts. |
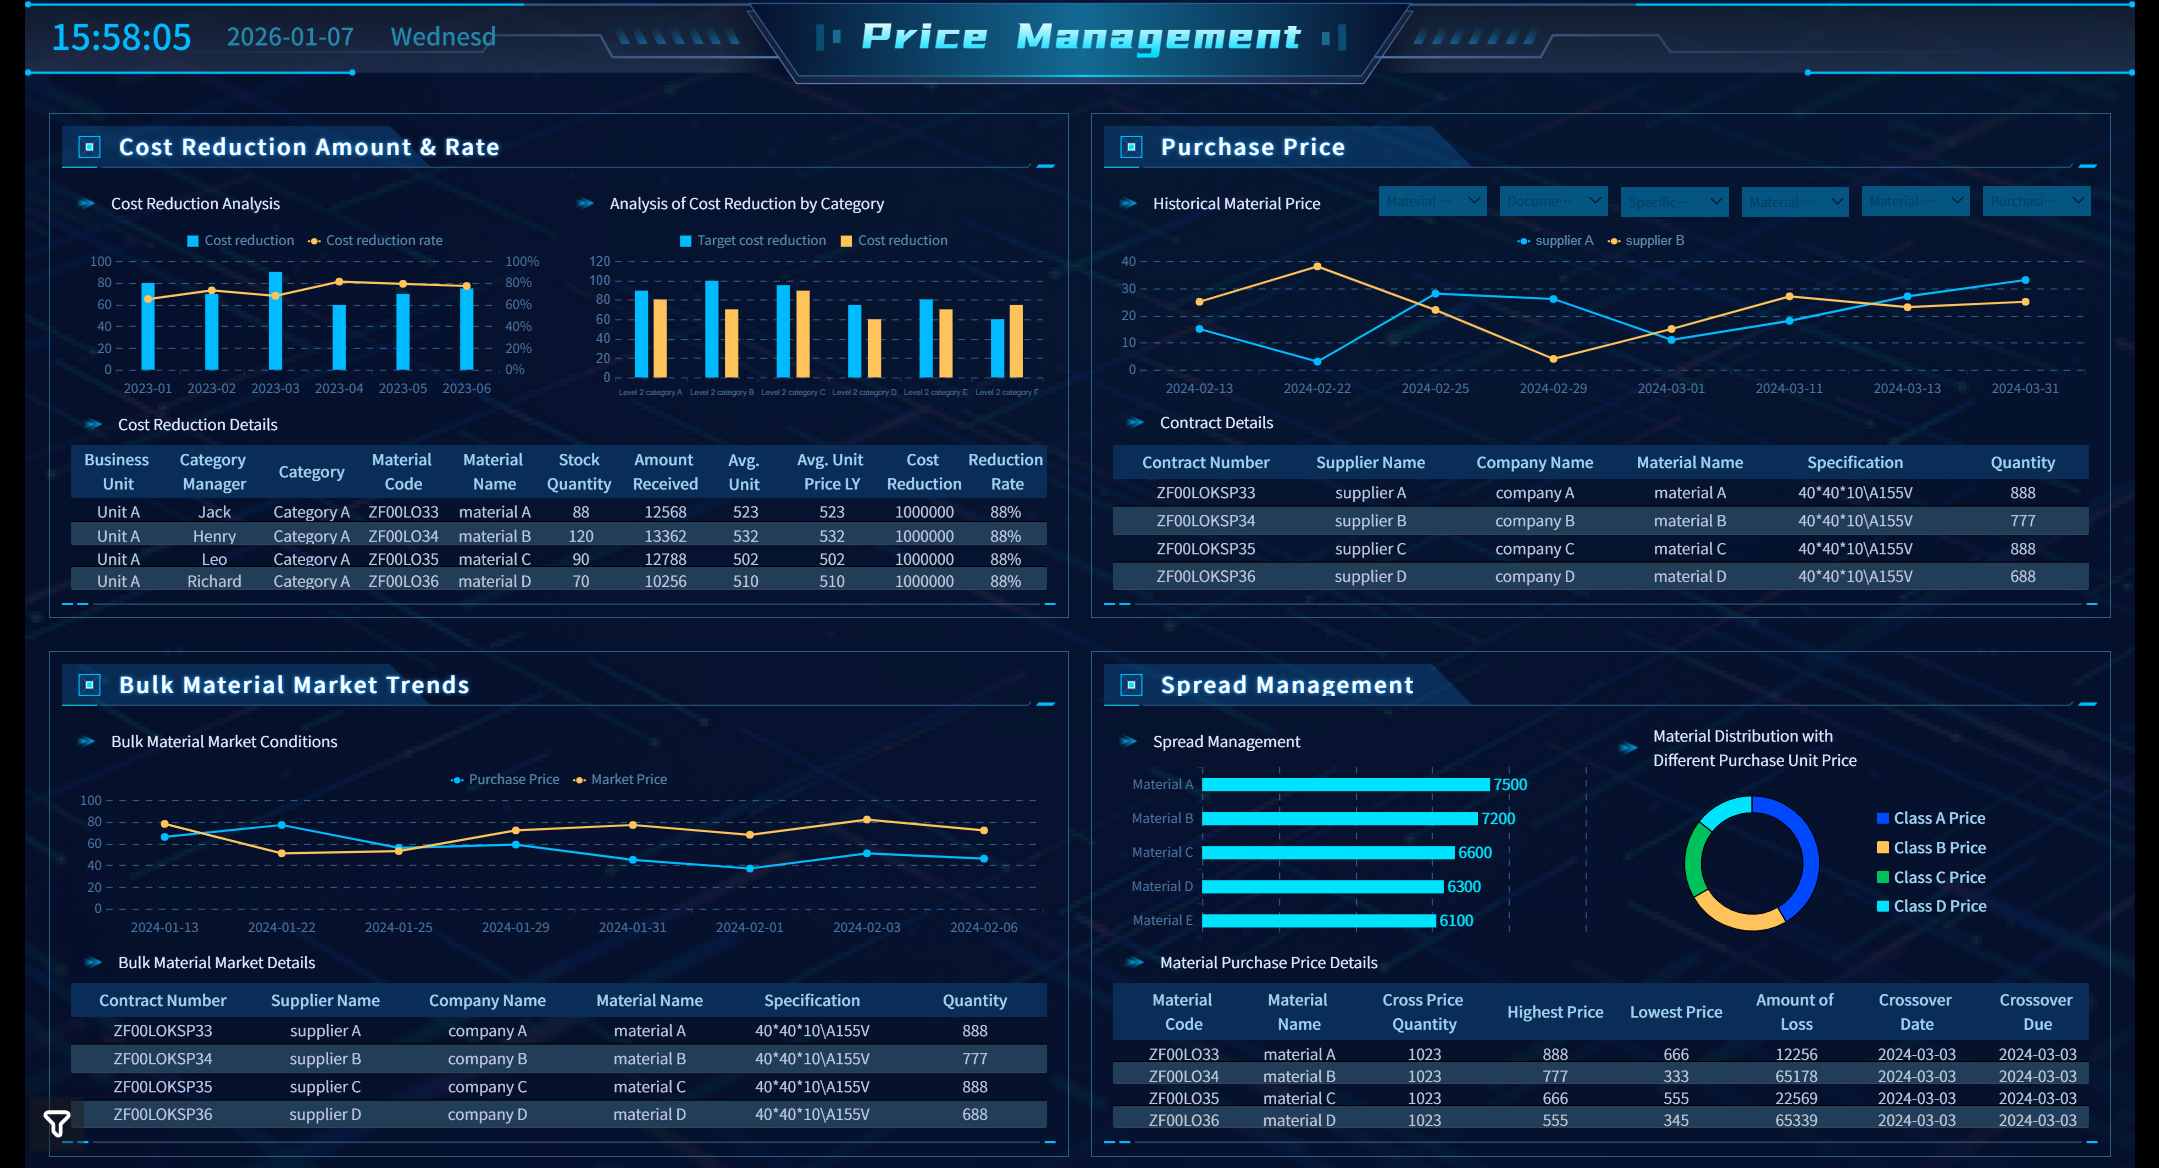
Manufacturing companies use procurement savings dashboards to identify top vendors, analyze spending categories, and highlight vendor discounts. For example, you can see which suppliers offer the best deals and when those discounts apply. This helps you make better finance decisions and improve your company's bottom line.
| Feature | Description |
|---|---|
| Top Vendors | Identifies the leading vendors used by the company. |
| Spending Categories | Analyzes which categories incur the highest spending. |
| Vendor Discounts | Highlights which vendors offer the best discounts and when. |
Procurement dashboards centralize data from multiple sources, creating a single source of truth for your procurement and finance teams. You can quickly assess budget statuses, observe spending trends, and identify major suppliers. This centralization enhances visibility and control over procurement activities.
Procurement dashboards serve as a visual tool that consolidates essential metrics and performance indicators. You get real-time insights into spending, supplier performance, and compliance. This allows you to monitor and respond to critical trends as they happen.
In manufacturing, you often face challenges like fluctuating raw material prices and supply chain disruptions. A procurement dashboard helps you manage these risks by giving you instant access to the data you need. You can see which suppliers are reliable, which contracts are up for renewal, and where you can cut costs. This leads to smarter finance decisions and better procurement outcomes.
FineReport enhances your procurement dashboard by integrating data from ERP, MES, and SRM systems into one unified platform. You get real-time insights that improve your decision-making. FineReport allows you to interact with your data, explore trends, and analyze procurement activities through a single dashboard.
| Feature | Description |
|---|---|
| Data Integration | Consolidates data from ERP, MES, and SRM systems into a unified platform. |
| Real-time Insights | Provides real-time insights that enhance decision-making capabilities. |
| Comprehensive Data Visualization | Allows users to interact, explore, and analyze data effectively through a single dashboard. |

FineReport supports manufacturing companies by providing advanced visualization tools. You can create bar charts, line charts, and tables that make complex data easy to understand. The dashboard updates automatically, so you always have the latest information. This helps you stay ahead of changes in the market and respond quickly to new opportunities.
Tip: With FineReport, you can customize your procurement dashboard to focus on the metrics that matter most to your finance and procurement teams. This flexibility ensures you get the insights you need to drive savings and improve efficiency.
FineReport empowers you to make data-driven decisions, reduce procurement costs, and strengthen supplier relationships. You gain a competitive edge by using a procurement savings dashboard that delivers accurate, actionable insights.

When you use a procurement dashboard, you gain spend visibility across your entire procurement process. Leading organizations track a range of procurement reporting metrics to measure efficiency, cost savings, and supplier performance. These metrics help you align procurement activities with your finance goals and support better decision-making.
Some of the most common procurement metrics include:
Tracking these metrics gives you real-time visibility into your procurement operations. You can see how much you spend, how quickly you process orders, and how well your suppliers perform. This level of spend visibility helps you identify trends, manage risks, and improve procurement reporting.
Savings KPIs play a key role in procurement reporting. You use these KPIs to measure how much you save and how well you control costs. A well-designed procurement dashboard lets you track both financial and operational KPIs.
Here are some important savings KPIs you should monitor:
You can use these KPIs to benchmark your procurement reporting against industry standards. For example, top performers achieve savings of 8–12% of total spend through effective procurement analytics.
| Metric Type | Calculation Example |
|---|---|
| Cost Savings | Initial proposed cost - actual cost = cost savings |
| Cost Savings Percentage | Cost savings / initial proposed cost = cost savings % |
| Year-over-Year Comparison | Compare current year’s spend with previous year’s spend |
| Market Price Comparison | Compare price paid with average market price |
FineReport makes procurement reporting more powerful by supporting multi-source data integration. You can connect your procurement dashboard to multiple databases, ERP systems, and finance platforms. This ensures you always work with accurate, real-time metrics and real-time insights.
| Feature | Description |
|---|---|
| Multi-datasource Connection | Enables reports to retrieve data from multiple databases or tables and perform cross-dataset calculations. |

With FineReport, you get spend visibility across all procurement activities. You can combine data from different sources, track procurement KPIs, and generate real-time insights for your finance team. This integration helps you make informed decisions, improve spend management, and drive better procurement outcomes.
Tip: When you use FineReport for procurement reporting, you gain a single source of truth for all your procurement analytics. This makes it easier to spot savings opportunities and optimize your procurement process.
You can use a procurement savings dashboard to improve cost control and boost efficiency in your organization. The dashboard gives you structured validation using real transaction data, so you know your savings are real. You track savings and compare them against forecasted amounts, which helps finance and procurement teams stay aligned. Modern dashboards use AI-based tools to surface discrepancies and document savings. You also get post-mortem reviews that show whether projected savings were achieved, helping you refine your forecasts.
| Key Metric | Description |
|---|---|
| Savings Tracking | Structured validation using real transaction data to ensure savings are realized. |
| Cross-Functional Alignment | Finance and procurement must share a view of realized vs. forecasted savings. |
| AI-Based Validation Tools | Modern systems track initiatives, surfacing discrepancies and documenting savings. |
| Post-Mortem Reviews | Assess whether projected savings were achieved and refine forecasting accuracy. |
| Core Metrics | Variance from forecast, realization percentage, and impact on working capital or cost centers. |
| Executive Reporting | Summary visuals and annotations build confidence in procurement’s financial outcomes. |
| AI Impact Areas | Prediction, classification, and acceleration of procurement processes enhance efficiency. |
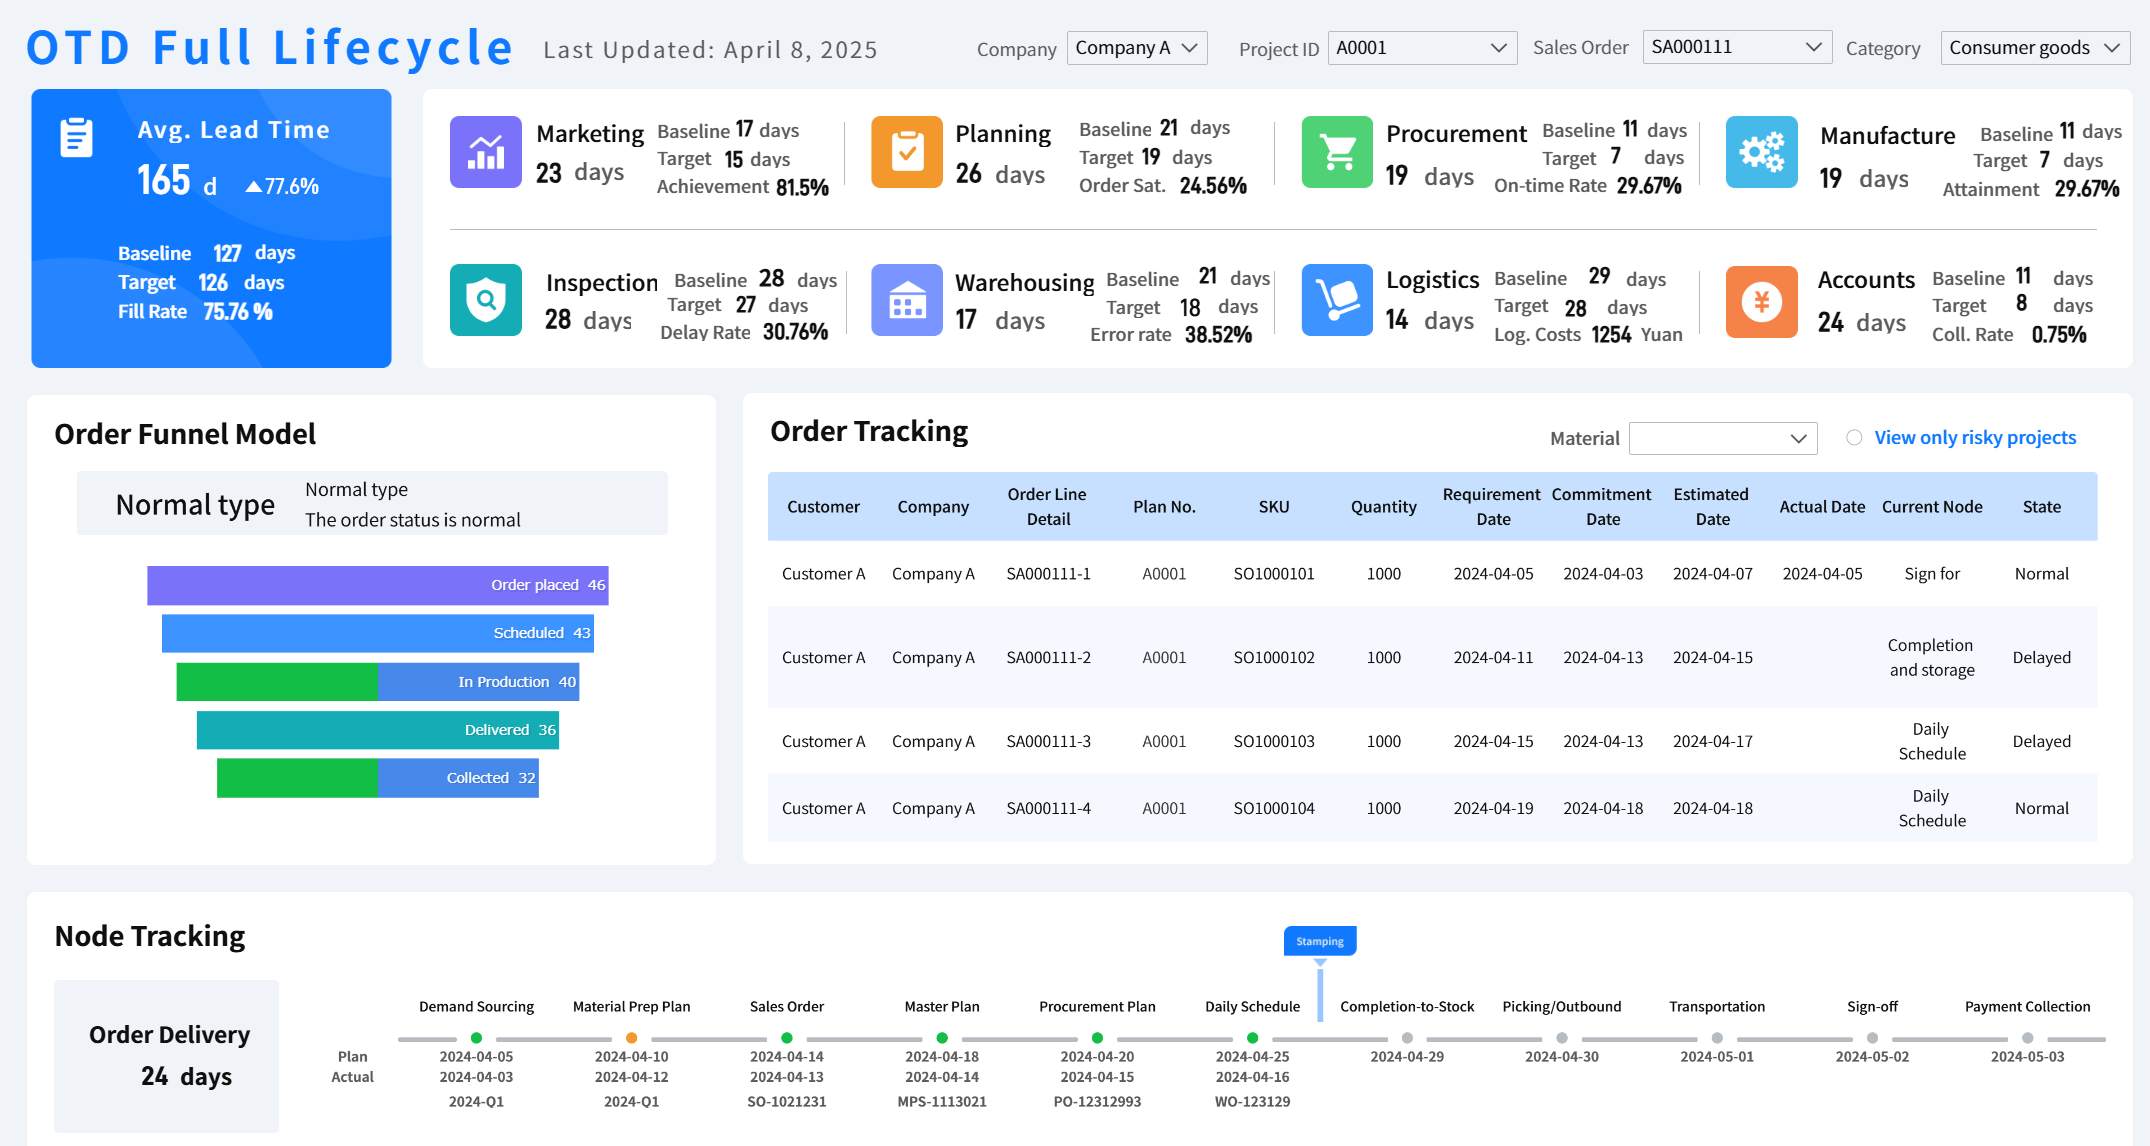
In manufacturing, you track sales patterns, procurement volumes, and inventory turnover. This helps you balance stock levels and match purchasing activity to real demand, reducing excess inventory. You visualize supplier performance, lead times, logistics, and production costs. These insights let you adjust quickly and make informed decisions to mitigate risks.

A procurement savings dashboard supports better decision-making. You get improved visibility with real-time updates, so you can monitor expenses, supplier performance, and compliance issues. This enables you to act before problems arise. You evaluate supplier performance and compare options, which helps you choose the best partners. Automation features save you time by reducing manual data entry and reporting errors. You identify cost-saving opportunities through spend analysis, making your procurement decisions more efficient.
Tip: Use your dashboard to monitor contract adherence and vendor dependency. Real-time monitoring helps you develop data-driven contingency plans, reducing the impact of disruptions.
Dashboards consolidate data from multiple sources, giving you a comprehensive view for strategic planning. You spot risks early and create plans to address them, which strengthens your finance outcomes.
FineReport brings automation and advanced reporting features to your procurement savings dashboard. You automate report generation, which minimizes manual errors and saves time. FineReport supports dashboards and visual charts, making data analysis easier. You use reporting templates to create procurement reports quickly. These features help you track cost savings, monitor spend, and improve finance performance.
FineReport helps you achieve process transparency and risk reduction. You monitor supplier performance and compliance in real time. You manage supplier relationships proactively, identifying risks before they disrupt operations. FineReport consolidates data from multiple sources, supporting comprehensive analysis and strategic decision-making in manufacturing.

When you design a procurement savings dashboard, you should focus on clarity and consistency. Standardize report formats to make procurement reporting easier for everyone. Use technology to automate data collection and analysis, which gives you real-time updates and reduces errors. Prioritize actionable insights so your procurement team can make decisions quickly. Leverage data visualization tools to turn complex procurement data into visuals that help you spot trends and performance issues.
| Best Practice | Description |
|---|---|
| Standardize report formats | Consistent formats improve communication and reduce confusion in procurement reporting. |
| Use technology | Automation provides real-time updates and minimizes human error in procurement reporting. |
| Focus on actionable insights | Highlight insights that drive decisions in procurement, not just raw data. |
| Leverage visualization tools | Visuals help you identify procurement trends and performance at a glance. |
You need accurate data for effective procurement reporting. Start by verifying that your data sources are reliable and current. Implement validation rules and regular cleansing to keep procurement data clean. Conduct regular audits and maintain clear audit trails. Standardize data entry procedures and train users to avoid mistakes. Use automated updates for real-time integration. Define procurement metrics clearly and document them for everyone. Establish strong data governance and control user access. Provide feedback options and test data with different scenarios to ensure accuracy. Make sure your dashboard visualizations represent procurement data correctly.
You may face several challenges when implementing procurement reporting dashboards. Inconsistent data across systems can cause confusion. Manual data entry often leads to errors. Data silos prevent teams from accessing all procurement information. Too much data can overwhelm your procurement team. Supply chain partners may use different standards, which creates data integrity issues. In manufacturing, you might see problems like unclear spend priorities, supplier location blind spots, and over-reliance on certain suppliers. Use heatmaps, location maps, and waterfall charts to address these issues in procurement reporting.
| Challenge Type | Description |
|---|---|
| Inconsistent Data | Different systems store procurement data in various formats, causing errors. |
| Human Error | Manual procurement data entry can impact procurement reporting accuracy. |
| Data Silos | Lack of access to cross-functional procurement data leads to inefficiencies. |
| Data Overload | Too much procurement data makes it hard to find what matters. |
| Supply Chain Data Integrity | Different standards among partners affect procurement reporting. |
FineReport makes procurement reporting easier for manufacturing companies. You start by connecting FineReport to your procurement, ERP, and finance systems. Use the drag-and-drop designer to create component-based reports that fit your dashboard needs. Remote design lets you modify templates from anywhere, which helps you manage procurement reporting flexibly. Advanced chart interaction features allow you to link charts, update data in real-time, and add animations for better engagement. Test your dashboard with real procurement data and train your team to use it effectively. Monitor procurement reporting performance and adjust your dashboard as needed.
| Feature | Description |
|---|---|
| Component-based Reports | Create procurement reports with drag-and-drop for any dashboard size. |
| Remote Design | Design and edit procurement reporting templates from any location. |
| Advanced Chart Interaction | Link procurement charts, update data in real-time, and use animations for engagement. |

Tip: When you use FineReport for procurement reporting, you gain a flexible dashboard that supports real-time decision-making and improves procurement savings.
A procurement savings dashboard gives you real-time visibility into procurement savings and helps you share data quickly with stakeholders. You use it to support strategic procurement decisions and improve collaboration. FineReport enables you to track procurement spend, supplier performance, and contract compliance. You monitor procurement cycle times and risk exposure, making your procurement process more efficient. You evaluate procurement performance and identify cost-saving opportunities. Consider using a dashboard solution to strengthen your procurement outcomes.
| Outcome | Description |
|---|---|
| Up-to-date visibility | Real-time insights into procurement savings |
| Easy data sharing | Quick review and sharing with stakeholders |
| Strategic decision-making | Demonstrate savings and metrics for better procurement decisions |
10 Best Supply Chain Dashboard Software to Boost Visibility
Top 10 Supply Chain Management Software for Small Businesses
Top 10 Supply Chain Tracking Software for 2026
9 Best Supply Chain Tools for Smarter Management in 2026
7 Must-See Supply Chain Dashboard Designs for Modern Businesses

The Author
Lewis
Senior Data Analyst at FanRuan
Related Articles

Payment Analytics Dashboard: 12 KPIs Every Operations Leader Should Track to Cut Revenue Leakage
Losing revenue to declines? Discover 12 essential KPIs to track in your payment analytics dashboard to stop leakage and manage disputes.
Lewis Chou
May 05, 2026

SOC Dashboard Explained: 12 Essential KPIs, Views, and Workflows Security Teams Use
Learn about SOC dashboards, the 12 essential KPIs for security teams, and how they centralize alerts and workflows for faster threat detection and response.
Lewis Chou
May 05, 2026

EMR Dashboard Guide: 12 Metrics to Track for Faster Clinical and Operational Decisions
Learn the 12 essential EMR dashboard metrics to track for faster clinical and operational decisions, improving patient flow and revenue cycle management.
Lewis Chou
May 05, 2026


