A manufacturing dashboard is a digital tool that displays key production metrics, processes, and performance indicators in real time, helping you monitor and improve manufacturing operations efficiently. Many manufacturers rely on dashboards because these tools allow you to track performance, reduce errors, and make faster decisions. Over half of manufacturing organizations use digital dashboards for real-time monitoring. Industry 4.0 technology now drives the shift toward real-time data and predictive maintenance, with more manufacturers adopting advanced dashboards to stay competitive.
Manufacturing Dashboard Overview
Definition and Purpose
A manufacturing dashboard is a digital interface that displays real-time production metrics, historical trends, and future projections, helping you monitor, analyze, and optimize manufacturing operations for better decision-making and efficiency.
You use manufacturing dashboards to bring together data from different sources and present it in a clear, visual format. These dashboards show you what is happening on the production floor right now and help you spot trends over time. You can act quickly to improve quality and reduce costs because you see the latest information as soon as it becomes available.
Manufacturing dashboards serve several important purposes:
- You aggregate data into visual formats that are easy to understand.
- You monitor real-time performance and track key metrics.
- You detect trends and take timely actions to optimize production.
FineBI takes this concept further by letting you connect to multiple data sources, schedule updates, and build dashboards with drag-and-drop tools. You can create dashboards that fit your needs, whether you want to track equipment status, monitor energy use, or analyze quality data.

Centralized digital manufacturing dashboards give you a single place to view all your key performance indicators. You see updates instantly, which helps you make better decisions. When you use dashboards with digital signage, everyone on the team can see important metrics across the plant.
Tip: When you use a centralized dashboard, you reduce the time spent searching for information and improve your response to production issues.
Key Features
Manufacturing dashboards include several key features that help you manage operations more effectively. The table below summarizes the most widely accepted characteristics found in industry literature:
| Characteristic | Description |
|---|---|
| Real-time data | Dashboards provide up-to-the-minute information for fast decision-making. |
| Historical and future data | You see past performance and future projections to guide your actions. |
| Visual representation | Colorful graphs and charts make complex data easy to understand. |
| Common type | Operational dashboards are the most frequently used in manufacturing. |
You will find these features in leading dashboard solutions:
- Operational overviews give you snapshots of process areas and help you detect issues like equipment failures.
- Financial dashboards link cost metrics to production activities, so you can track spending and profitability.
- Performance dashboards focus on efficiency metrics such as Overall Equipment Effectiveness (OEE) and production rates.
- Energy consumption dashboards let you monitor real-time energy use and find savings opportunities.
- Quality dashboards display data to ensure products meet specifications and allow for immediate corrective actions.
Digital manufacturing dashboards improve data accessibility by enhancing visibility of KPIs on the production floor. You get quick updates and real-time data display, which leads to faster and more informed decisions.
FineBI supports all these features. You can connect to over 60 data sources, build dashboards with drag-and-drop tools, and share insights securely across your organization. You control who sees what, so sensitive data stays protected.
Note: With FineBI, you can create dashboards that adapt to your needs, whether you want to track production rates, monitor costs, or analyze quality trends.

How Real-Time Manufacturing Dashboards Work
A manufacturing dashboard is a digital interface that brings together real-time manufacturing data from multiple sources, helping you monitor performance metrics and make fast decisions to improve production efficiency.
Data Integration and Processing
You need to collect data from many systems in your factory. Real-time manufacturing dashboards connect to machines, sensors, ERP, MES, and other sources. The dashboard uses advanced integration methods to bring all this information together. You can see the main approaches in the table below:
| Integration Method | Description |
|---|---|
| ETL | Extracts, transforms, and loads data from different systems into a unified format. |
| ELT | Loads data into a data lake first, then transforms it for analysis, ideal for large datasets. |
| CDC | Captures changes in data for real-time synchronization, useful for fast updates. |
| Data Virtualization | Creates a unified view of data without moving it, using a virtualization layer. |
You should follow these steps when integrating data for your manufacturing dashboard:
- Define clear objectives for your integration project.
- Choose the right method based on your needs and system size.
- Ensure data quality at every stage.
- Use advanced tools to automate integration.
- Set up data governance to keep information accurate.
- Monitor integration processes for ongoing improvement.
FineBI makes this process simple. You can connect to over 60 data sources, including databases, files, and APIs. FineBI supports ETL and ELT, so you can handle large volumes of real-time manufacturing data. You can schedule updates and automate data cleaning, ensuring your dashboards always show the latest information.

Tip: When you use FineBI, you reduce manual work and get reliable data for your dashboards.
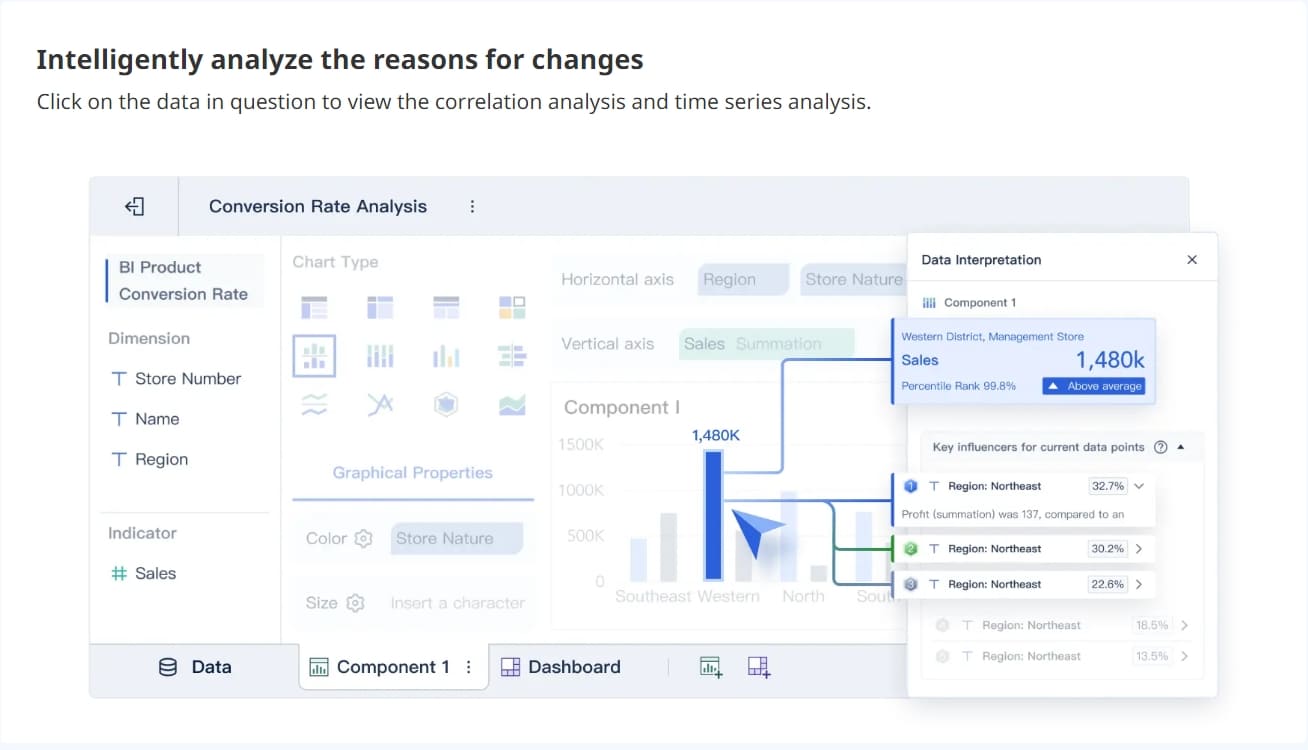
Visualization and Insights
Once you have integrated your data, you need to visualize it. Real-time manufacturing dashboards use charts, graphs, and tables to show performance metrics and trends. You can see common visualization methods in the table below:
| Visualization Method | Description |
|---|---|
| Dashboards | Centralized interfaces that track KPIs like OEE and defect rates, giving you a live overview. |
| Time Series Data | Graphs that show changes over time, helping you spot patterns and trends. |
| Heat Maps | Visuals that highlight problem areas, such as bottlenecks or high defect rates. |
You can use dashboards to monitor production rates, equipment status, and quality metrics. Real-time manufacturing dashboards help you spot issues quickly and take action before problems grow. You see trends and patterns in your data, which helps you plan for maintenance and avoid downtime.
Manufacturing dashboards transform raw data into actionable insights. You get a clear view of your operations, so you can make decisions faster. You can track performance metrics, compare shifts, and see which machines need attention. This strategic use of visualization helps you improve efficiency and resource allocation.
Note: Dashboards make complex data easy to understand, so everyone on your team can use real-time insights to improve results.
FineBI’s Role in Real-Time Dashboards
FineBI gives you powerful tools for building real-time manufacturing dashboards. You can use drag-and-drop features to create dashboards without coding. FineBI supports real-time filtering, so you can explore different time periods or production lines instantly.
You can set up alerts for critical metrics. FineBI sends notifications when something goes wrong, helping you respond quickly. You can share dashboards securely with your team, controlling who sees sensitive information.
FineBI’s high-performance engine processes large datasets fast. You get real-time analytics and instant updates, even with thousands of users. You can access dashboards on any device, so you stay informed whether you are in the office or on the factory floor.
Real-time manufacturing dashboards built with FineBI help you:
- Monitor operations with live data.
- Make better decisions using real-time insights.
- Improve collaboration by sharing dashboards across departments.
- Track performance metrics and respond to changes quickly.
Tip: FineBI empowers you to turn manufacturing data into strategic assets, driving efficiency and quality in your plant.
Types of Digital Manufacturing Dashboards
A manufacturing dashboard is a digital tool that shows you real-time production data and key performance metrics in one place, helping you make better decisions and improve efficiency.
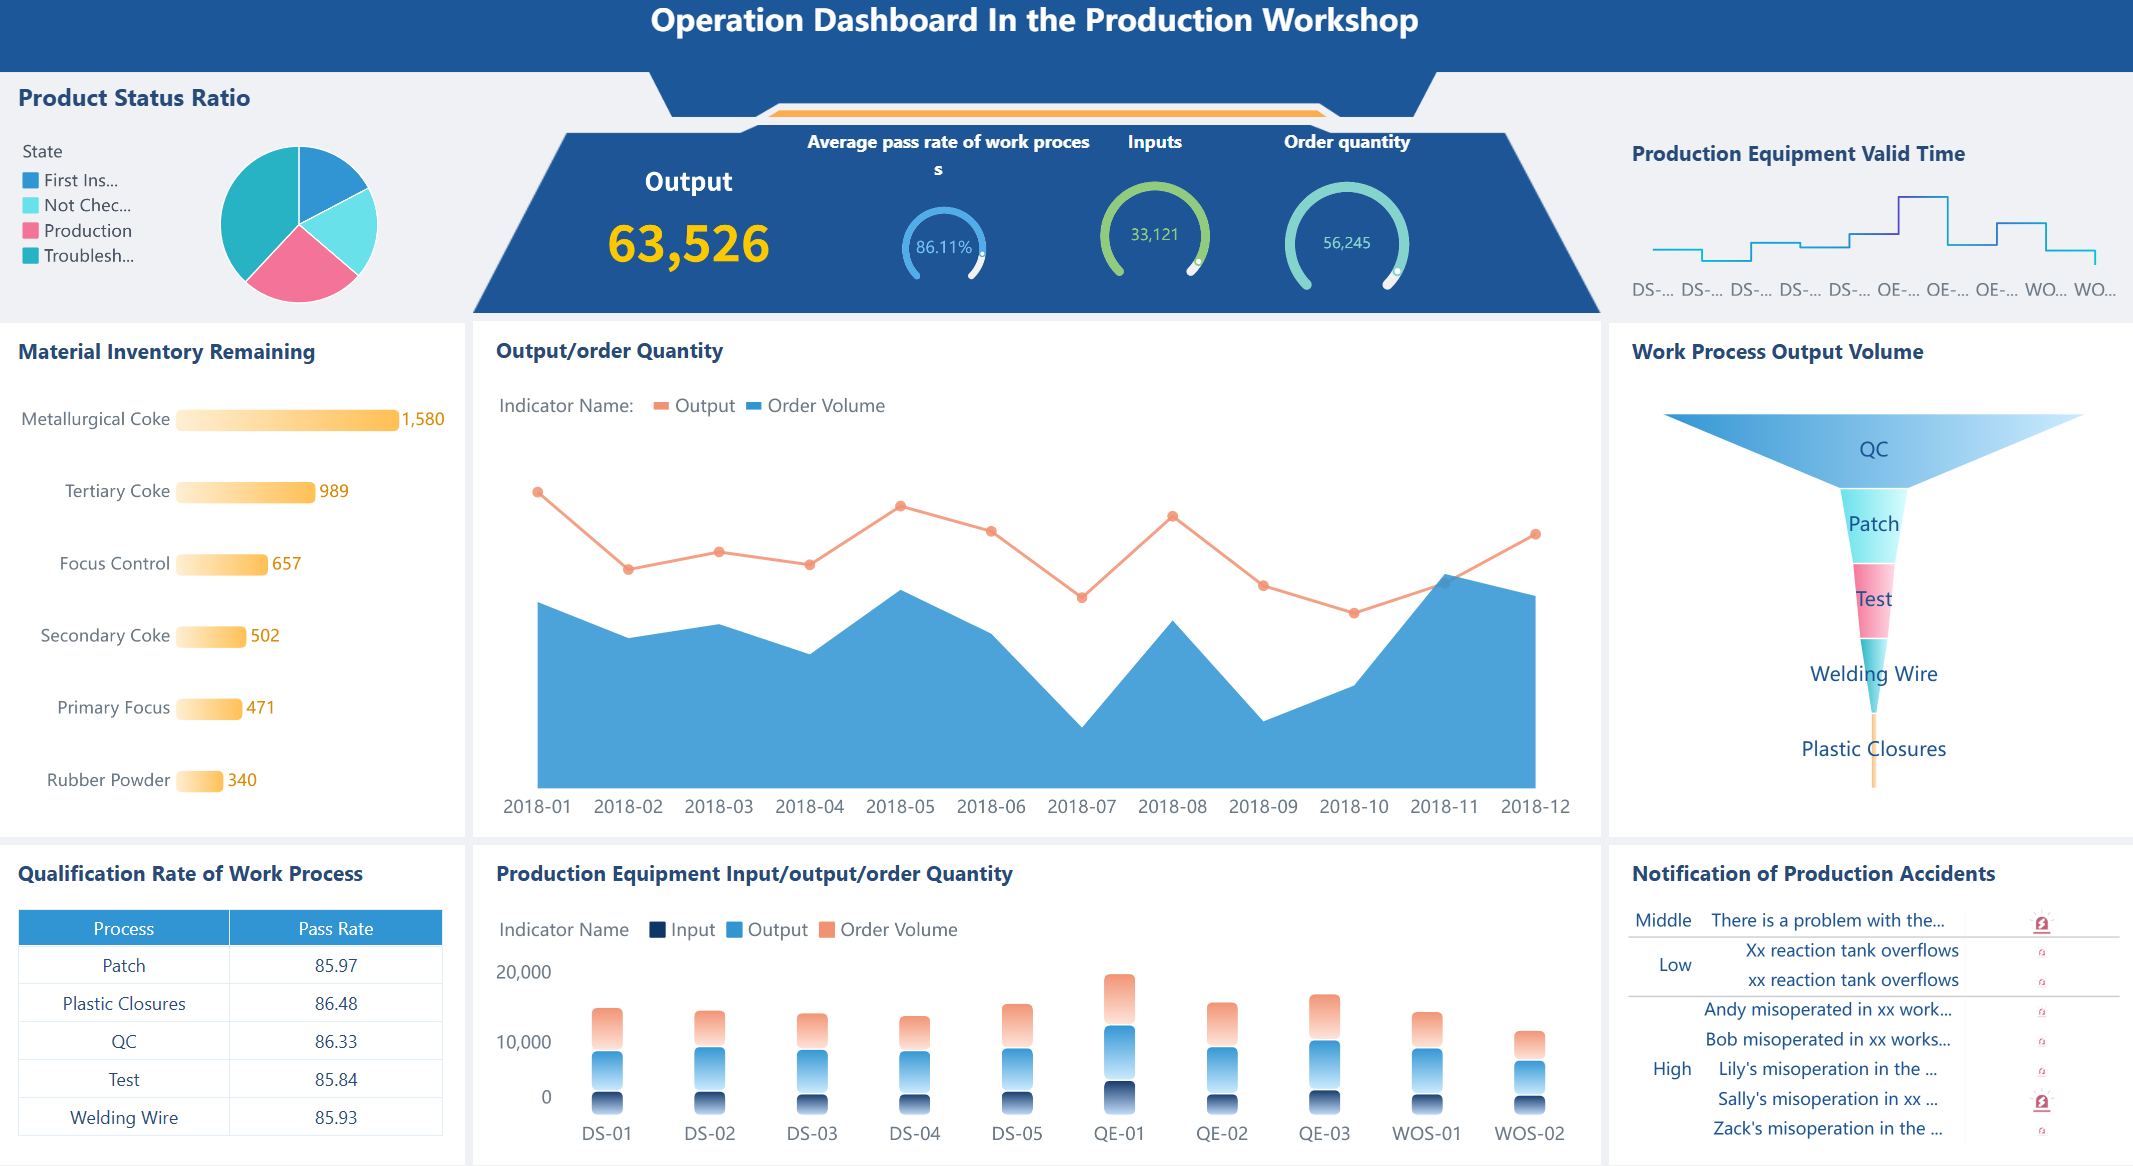
Operational Dashboards
Operational dashboards help you monitor daily manufacturing activities. You can track throughput, cycle time, inventory turns, production attainment, and downtime. These dashboards give you a live view of your plant’s operations, so you can quickly spot issues and keep production running smoothly.
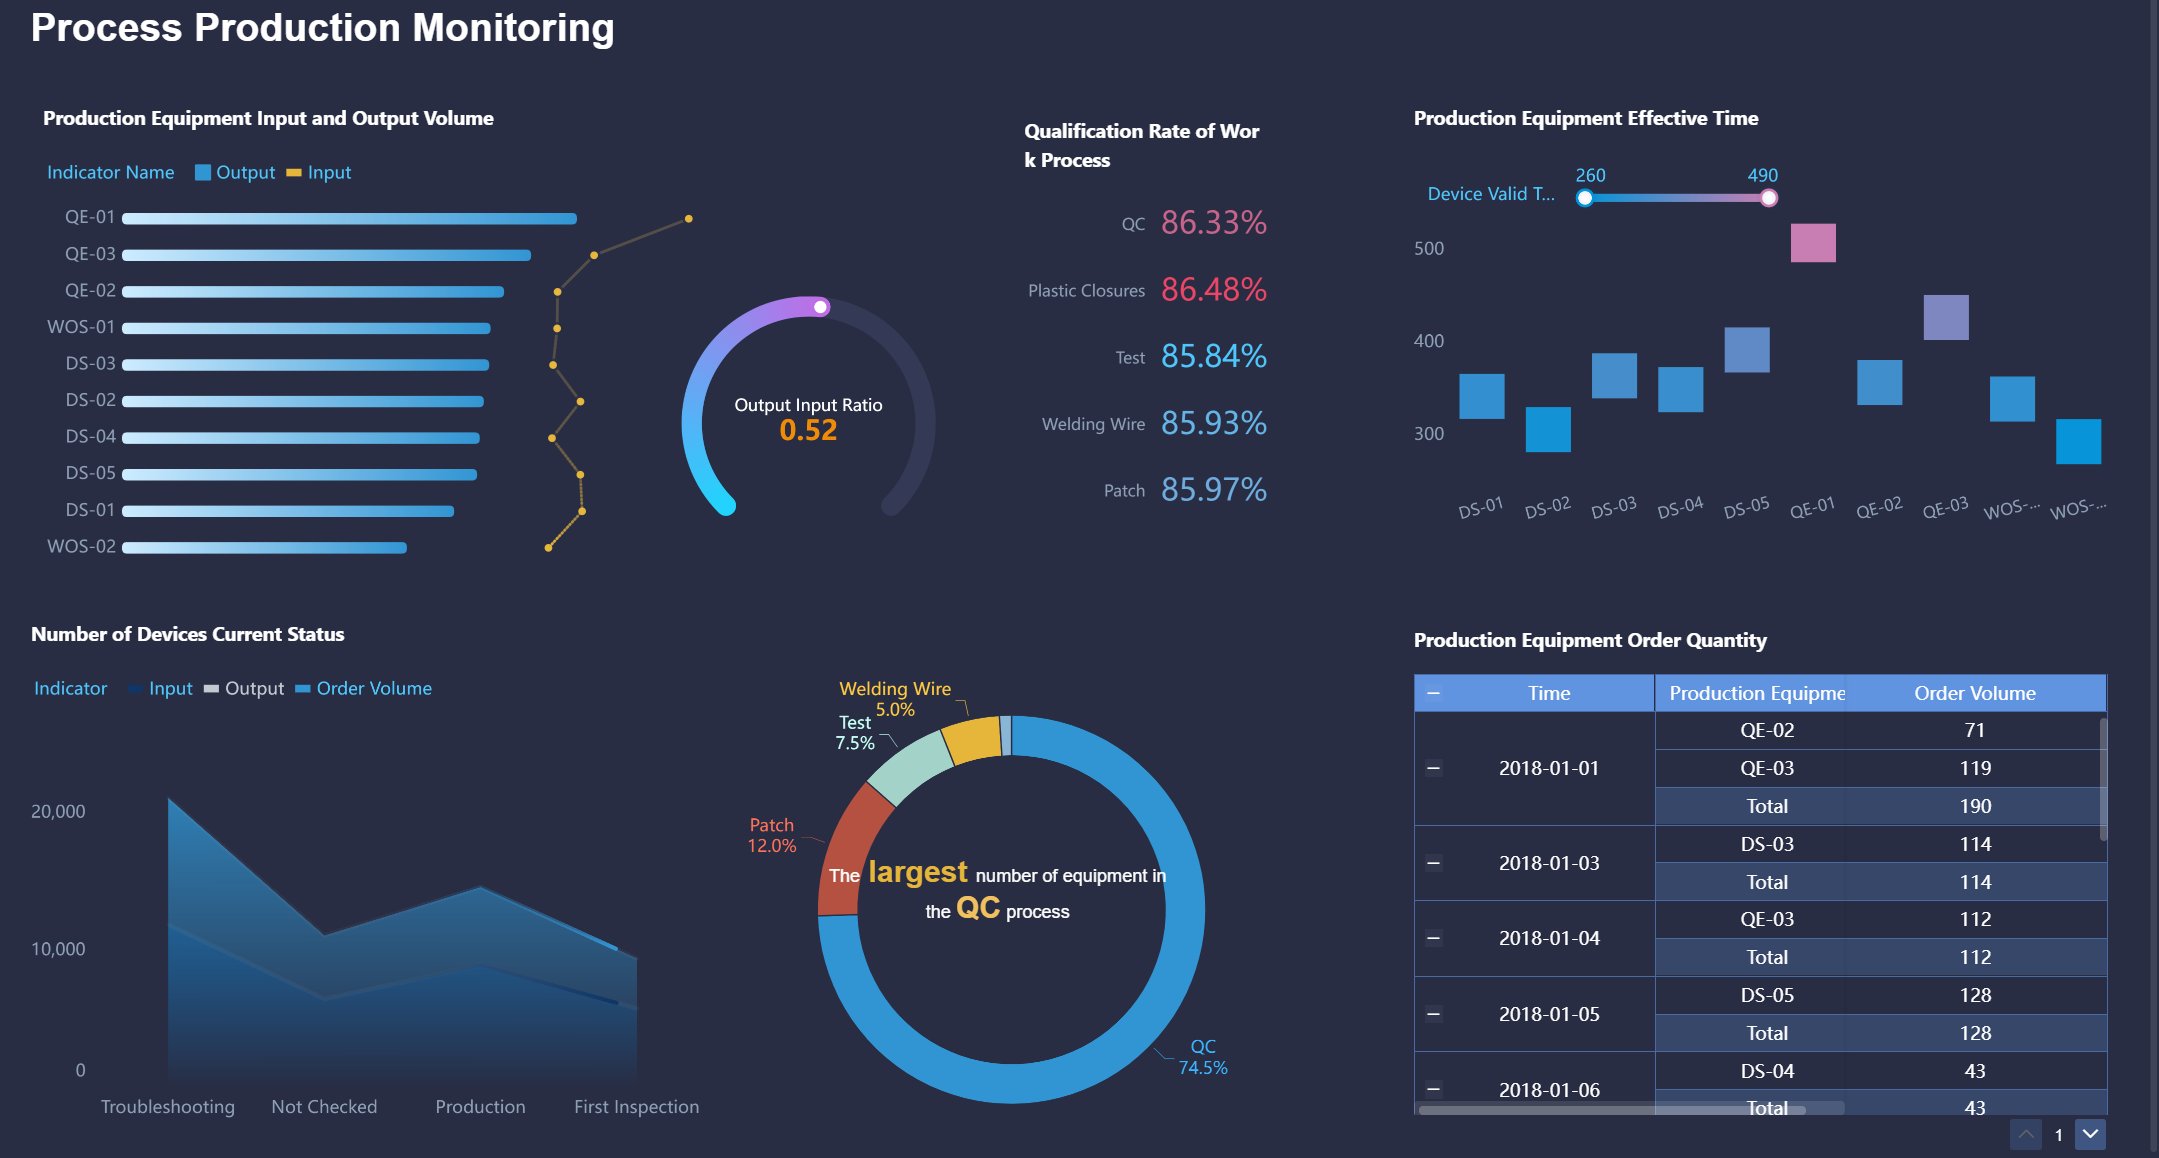
Performance Dashboards
Performance dashboards focus on measuring how well your manufacturing process works. You can see metrics like OEE, production volume, equipment downtime, yield, and customer satisfaction. These dashboards help you compare planned versus actual results, track machine run-time hours, and monitor maintenance work orders. You use them to find ways to boost productivity and reduce waste.
Quality Dashboards
Quality dashboards let you keep an eye on product quality. You can track defect rates, yield percentages, and rework trends. For example, you might monitor defects per million opportunities to catch problems early. These dashboards help you maintain high standards and reduce the cost of poor quality.
| Quality Metric | Description |
|---|---|
| Defect Rates | Frequency of defects in products |
| Yield Percentages | Percentage of products meeting quality standards |
| Rework Trends | Frequency and reasons for rework in production |
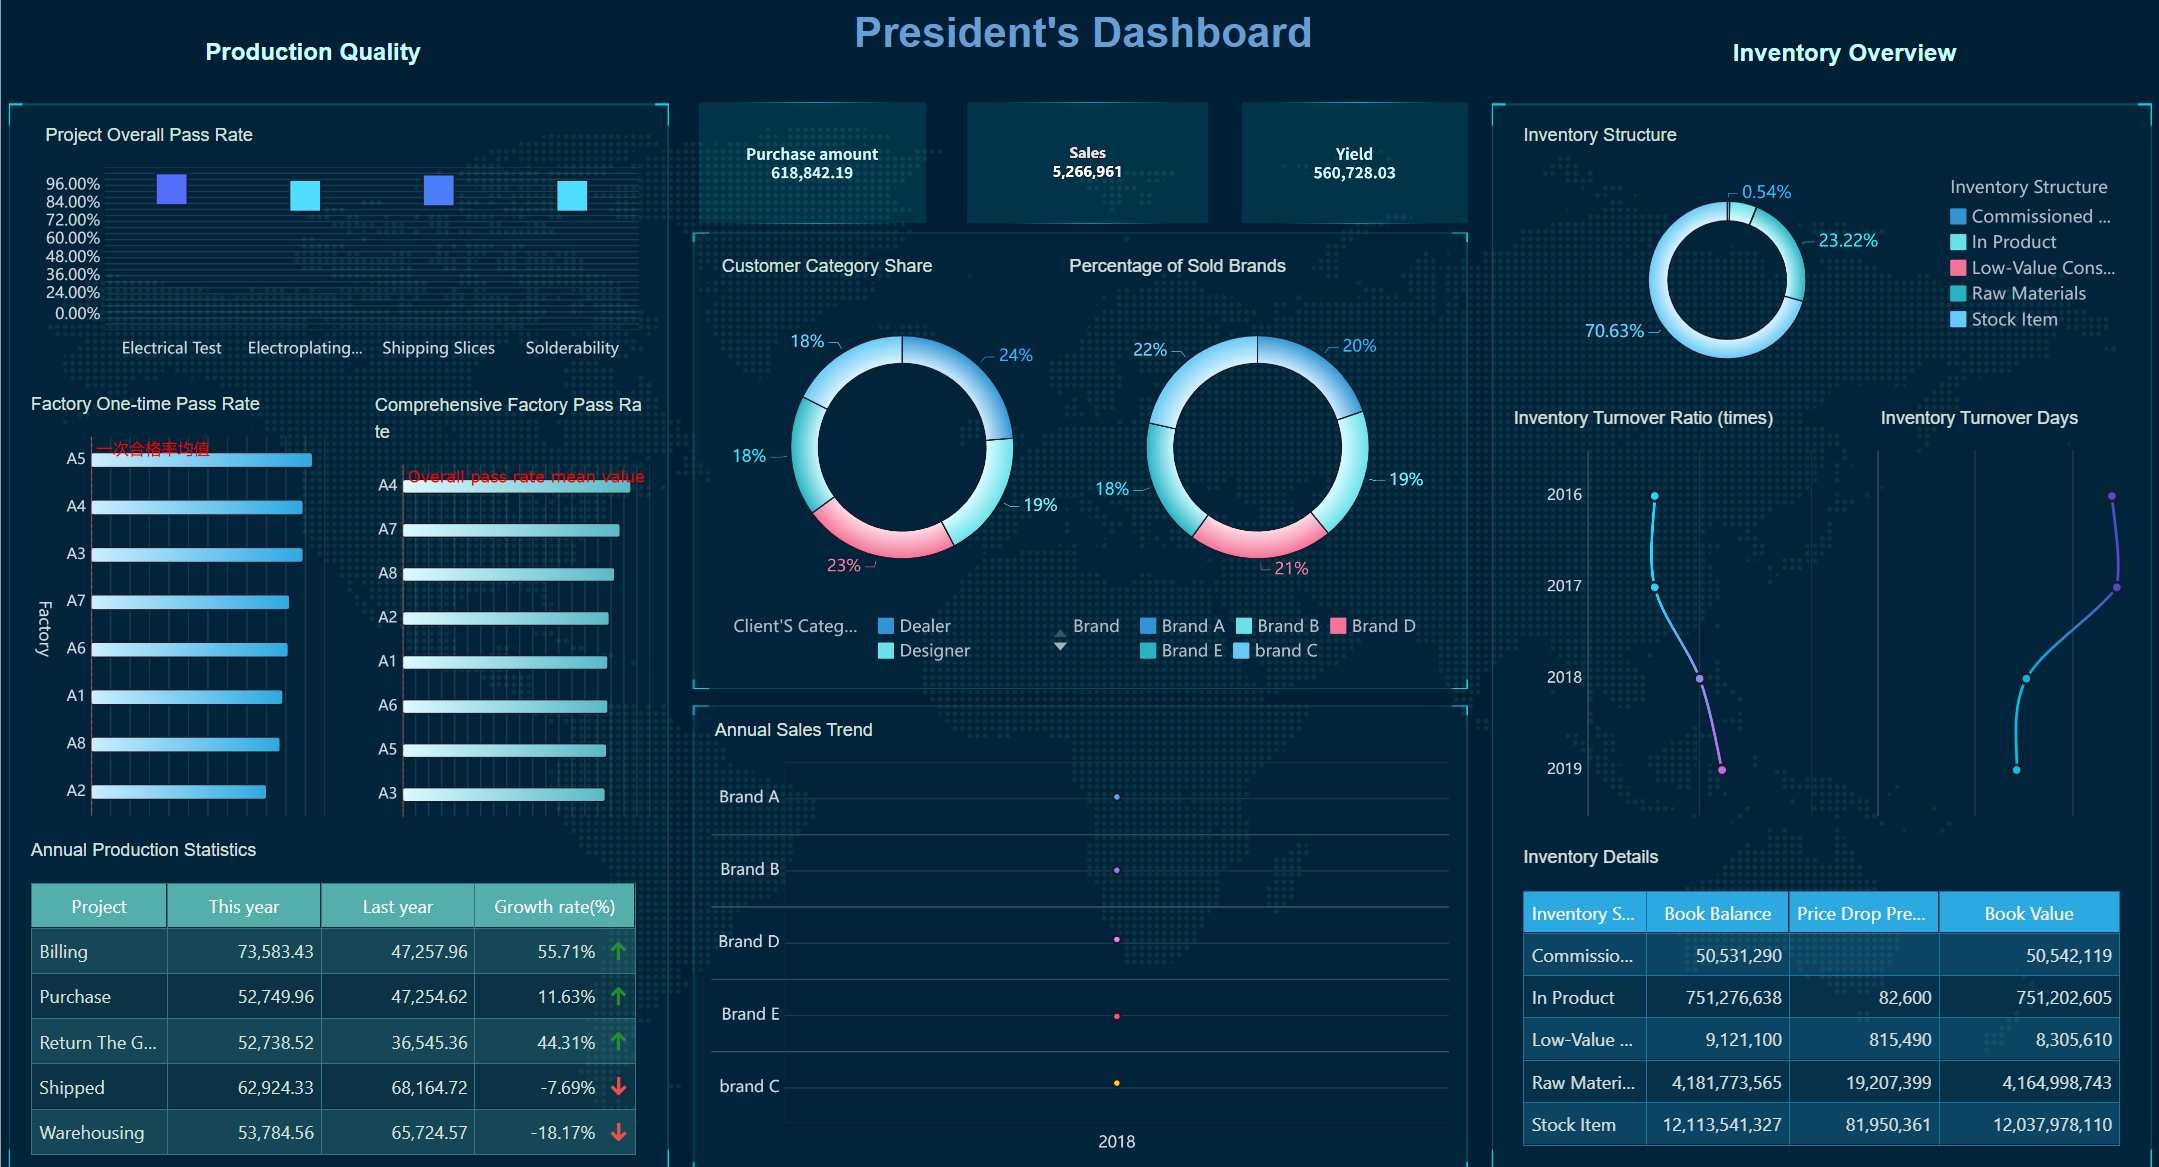
Financial Dashboards
Financial dashboards show you the financial health of your manufacturing operations. You can view profit and loss summaries, monthly balance sheets, net asset trends, and actual versus budgeted revenue. These dashboards help you manage costs, track profitability, and make informed financial decisions.
| Financial Metric | Description |
|---|---|
| Profit & Loss Summary | Compares actual, budget, and prior month results |
| Monthly Balance Sheet Summary | Shows balance sheet with period variances |
| Actual vs Budgeted Revenue | Compares actual revenue to budgeted figures |
Manufacturing Metrics Dashboard Examples
Many leading companies use manufacturing dashboards to drive results. For example, Bosch tracks asset utilization and cycle times to improve processes. Nestle monitors emissions and waste to save costs and protect the environment. Schneider Electric uses dashboards to prevent downtime and boost productivity.
FineBI supports all these dashboard types. You can create dashboards with adaptive layouts, add charts and tables, and use filters for focused analysis. FineBI lets you organize data into tabs, link components, and customize styles. You can build dashboards for any manufacturing need, from daily operations to financial analysis.

Tip: When you use digital manufacturing dashboards, you gain a clear view of your operations and can act quickly to solve problems.
Benefits of Manufacturing Dashboards
A manufacturing dashboard is a digital tool that displays real-time manufacturing data, helping you track production performance and make informed decisions.
Efficiency and Productivity Gains
You can use dashboards to boost production efficiency and reduce downtime. Real-time manufacturing dashboards let you monitor production performance and spot issues as they happen. You identify inefficiencies, optimize maintenance schedules, and improve quality control. Here are some ways dashboards help you:
- You make better decisions with accurate, up-to-date information.
- You monitor and control production in real time, correcting problems quickly.
- You analyze manufacturing analytics to find opportunities for improvement.
- You predict breakdowns and plan maintenance, reducing downtime.
- You track quality indicators to maintain high standards.
| Metric | Description |
|---|---|
| Production Output | Tracks total units produced and targets achieved. |
| Equipment Efficiency | Monitors OEE, uptime, and downtime causes. |
| Quality Metrics | Displays defect rates and rework trends. |
| Resource Utilization | Shows labor, materials, and energy use. |
| Inventory Levels | Provides insights into materials and finished goods. |
| Order and Delivery Status | Tracks schedules and on-time delivery rates. |
Enhanced Decision-Making
Dashboards give you real-time insights so you can shift from opinion-based to fact-based choices. Diagnostic analytics explain why events occurred, helping you identify root causes and streamline operations. Companies using evidence-based frameworks outperform peers in customer retention and innovation. You use dashboards to analyze performance metrics and make faster, smarter decisions.
Collaboration and Data Governance
Manufacturing dashboards improve collaboration by giving everyone access to the same real-time manufacturing data. You enhance communication and decision-making across departments. Dashboards help you monitor key performance metrics and maintain data accuracy. Managers use dashboards to allocate resources and improve processes, ensuring consistency and transparency.
FineBI Advantages for Manufacturers
FineBI stands out among manufacturing analytics platforms. You get no-code real-time analytics, allowing self-service dashboard creation. The drag-and-drop interface lets you build complex visualizations easily. FineBI processes real-time manufacturing data quickly and supports integrated ETL tools for seamless data preparation. You benefit from robust data modeling, strong mobile app support, and scalability. Enterprise-grade security features, such as role-based access control, keep your data safe.
| Feature | Description |
|---|---|
| No-Code Real-Time Analytics | Enables self-service analytics for non-technical users. |
| Drag-and-Drop GUI | Lets you create visualizations without coding. |
| Real-Time Data Processing | Delivers timely insights for manufacturers. |
| Integrated ETL Tools | Simplifies data preparation. |
| Robust Data Modeling | Supports complex data structures. |
| Mobile App Support | Provides access to dashboards anywhere. |
| Scalability | Expands as your needs grow. |
| Enterprise-Grade Security | Offers role-based access and audit logging. |
BOE Technology Group used FineBI to unify data and standardize metrics. They reduced inventory costs by 5% and increased operational efficiency by 50%. You can achieve similar results by adopting a manufacturing metrics dashboard powered by FineBI.

Tip: Real-time manufacturing dashboards help you turn data into action, improving efficiency, decision-making, and teamwork.
Choosing and Implementing a Manufacturing Metrics Dashboard
A manufacturing dashboard is a digital interface that displays key production metrics, enabling you to monitor, analyze, and optimize manufacturing operations in real time.
Essential Features to Consider
When you select a manufacturing metrics dashboard, you should focus on features that support real-time monitoring and actionable insights. The table below highlights the most important capabilities:
| Feature | Description |
|---|---|
| Real-time data | Immediate insights for fast decisions and effective operations. |
| Machine status and utilization | Shows which machines are running, idle, or down to improve equipment effectiveness. |
| Job performance against standard | Tracks actual output versus targets for timely interventions. |
| Downtime reasons and trends | Identifies causes of downtime to help you reduce it. |
| Labor activity and operator availability | Manages workforce to minimize bottlenecks and idle time. |
| Production performance by shift or cell | Monitors output by team or time for performance analysis. |
You should also look for strong integration, flexible visualization, robust security, and scalability to support your growing needs.
Software Options and FineBI Integration
You have many choices for digital manufacturing dashboard software. FineBI stands out for manufacturing analytics because it offers self-service dashboard creation, drag-and-drop visualization, and real-time monitoring. Unlike traditional BI tools, FineBI empowers you to connect over 60 data sources, automate ETL processes, and share dashboards securely. You can scale FineBI across your organization and control access with role-based permissions. Other platforms may require more IT support or lack real-time capabilities.

Best Practices for Implementation
To successfully implement dashboards, you should:
- Select software that integrates with your existing systems and allows customization.
- Define specific KPIs that align with your operational goals.
- Train your staff to use dashboards and interpret data effectively.
Common challenges include lack of standardization, manual tracking, information overload, and low engagement. You can overcome these by developing visual management standards, using automated dashboards, focusing on relevant information, and involving frontline staff in dashboard design.
Tip: Involve your team early and make dashboards part of daily routines to boost engagement and drive results.
A manufacturing dashboard is a digital tool that displays key production metrics and helps you improve efficiency.
- You track performance, efficiency, and maintenance in real time.
- AI and predictive analytics shift your decisions from reactive to proactive.
- Dashboards turn complex data into clear insights for everyone.
FineBI empowers you to make faster, smarter choices. Consider digital dashboards to boost your manufacturing results.
Continue Reading About Manufacturing Dashboard
What Are Manufacturing Operations and Why Do They Matter
What Is Manufacturing Intelligence and Why It Matters
Best Manufacturing Management Software for Modern Factories
What is Manufacturing Operations Management & Why It Matters


FAQ

The Author
Lewis
Senior Data Analyst at FanRuan
Related Articles

How to Build an Investment Portfolio Reporting Dashboard for Executives: KPIs, Benchmarks, and Drill-Down Views
Investment portfolio reporting for executives is not about showing every holding, transaction, and chart your investment team can produce. It is about giving CEOs, CFOs, CIOs, boards, and investment committees a fast, re
Yida YIn
Jun 25, 2026

12 KPI Reporting Examples for Executive Dashboards: What to Show in Weekly, Monthly, and Quarterly Reviews
Executive leaders do not need more data. They need decision ready $1 examples that match how often they review the business and what actions they are expected to take. A weekly $1 should surface fast moving risks and per
Yida YIn
Jun 25, 2026

How to Build a Digital Marketing Reports Dashboard: Executive Examples, KPIs, and Templates
A $1 is the control layer that helps executives and marketing leaders turn scattered channel data into fast, confident decisions. If you are a CEO, CMO, operations director, or marketing analytics lead, the real problem
Yida Yin
May 07, 2026