A strong project report format is not just a documentation standard. It is an operating tool for project managers, PMO leaders, IT managers, and executives who need fast visibility into progress, budget exposure, delivery risk, and pending decisions. When reports are inconsistent, leaders waste time decoding updates, teams miss escalations, and critical actions get delayed. A structured project report solves this by turning scattered project data into a repeatable decision-making format.
Click To Try The Dashboard
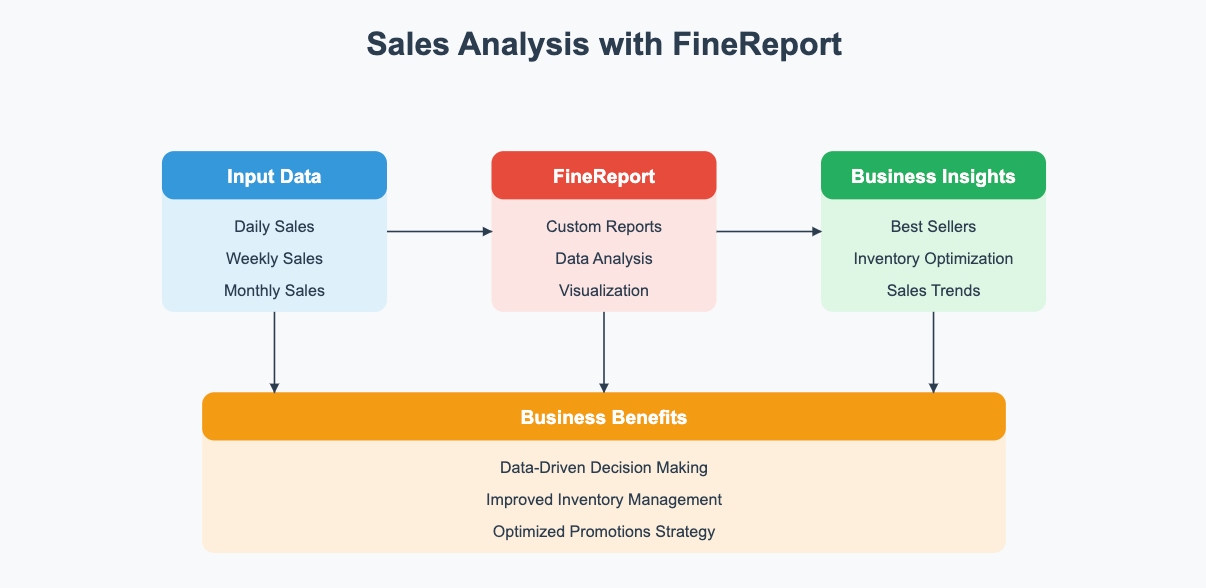
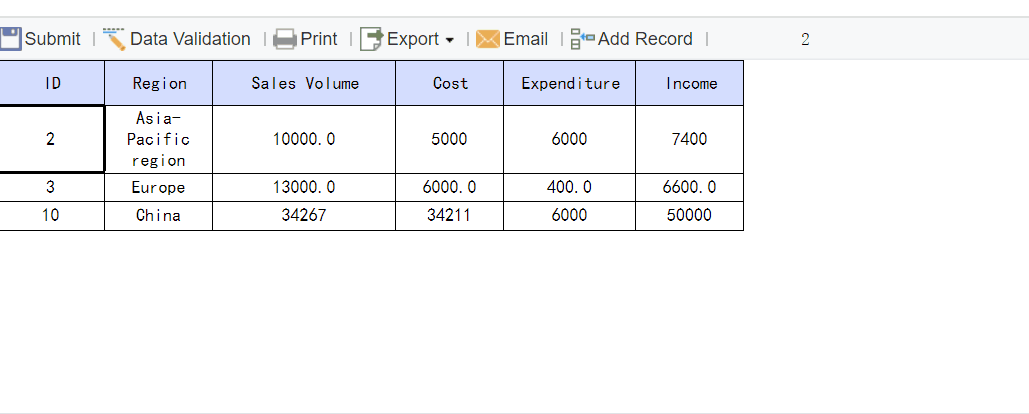
All reports in this article are built with FineReport
What a Strong Project Report Format Should Accomplish
An effective project report format helps enterprise teams communicate what matters now, what changed since the last update, and what leadership needs to do next. It should reduce interpretation time, standardize reporting across departments, and give stakeholders enough context to act without reading through pages of raw detail.
For large organizations, this consistency matters even more. Different business units often run projects with different tools, reporting habits, and governance standards. A common reporting structure creates a shared language across PMOs, delivery teams, finance partners, and executive sponsors. That means fewer surprises and faster alignment.
A clear format also separates three reporting needs that are often confused:
Status update: A short snapshot of current condition, usually focused on red-amber-green status, major changes, and immediate concerns.
Progress report: A more detailed operational update covering work completed, milestones, schedule movement, KPI trends, and risks.
Final project summary: A wrap-up document that evaluates outcomes, budget performance, scope delivery, lessons learned, and business impact.
Key Metrics (KPIs) Every Project Report Should Track
To make a project report useful, include a defined set of KPIs that executives can scan quickly:
Overall Project Status: A simple health indicator such as On Track, At Risk, or Off Track.
Milestone Completion Rate: Percentage of planned milestones completed by the reporting date.
Schedule Variance: Difference between planned timeline and actual progress.
Budget Variance: Difference between approved budget and actual spend.
Percent Complete: Share of total project work completed.
Open Risks Count: Number of active risks that may affect scope, cost, or schedule.
Critical Issues Count: Number of current blockers already affecting execution.
Resource Utilization: Extent to which assigned staff or teams are operating at or beyond planned capacity.
Change Request Volume: Number of approved, pending, or rejected scope changes.
Decisions Pending: Executive approvals or escalations required to keep the project moving.
The 7 Essential Sections Every Project Report Should Include
A useful project report format should be predictable. Executives should know exactly where to find the summary, where to check risk exposure, and where to see what decisions are needed. These seven sections create that structure.
1. Executive Summary
This is the first section leadership reads, and often the only one they read in full. It should give a concise view of the current project condition, what changed since the last report, and the one most important takeaway.
A strong executive summary answers three questions fast:
Where does the project stand today?
What changed materially since the last update?
What needs attention from leadership?
Keep this section short. Focus on business impact, not task-level detail. If a timeline moved by two days with no downstream impact, it may not belong here. If vendor delay threatens a quarter-end launch, it does.
2. Project Objectives and Scope
This section restates the reason the project exists. It should define the business goals, expected deliverables, scope boundaries, major dates, and accountable owners. This keeps every reader anchored to the original intent of the initiative.
It is especially important when the project has been running for months. Leadership changes, stakeholder turnover, and new dependencies can cause teams to drift. Reconfirming objectives and scope prevents the report from becoming a list of activities detached from business outcomes.
Include:
Business objective
In-scope deliverables
Out-of-scope exclusions
Planned timeline boundaries
Executive sponsor and project owner
3. Status and Progress Overview
This is the operating core of the report. It shows what has been completed, what is in progress, what is late, and how actual execution compares with plan.
Useful elements in this section include:
Completed milestones
Current workstreams in progress
Percent complete by phase
Schedule performance
Trend versus prior reporting period
The goal is not to dump every task update. It is to summarize meaningful movement. Executives care about delivery confidence, not activity volume.
Projects do not fail because teams were too transparent. They fail because risks are hidden, delayed, or poorly framed. This section should distinguish between future threats, current blockers, and external dependencies.
Use these definitions clearly:
Risk: A possible future event that may affect the project.
Issue: A problem already happening now.
Dependency: A task, approval, system, or team the project relies on.
For each item, include:
Description
Severity
Owner
Impact area
Mitigation or next action
This is where strong project governance shows up. A report that names risks early builds trust with executive sponsors.
5. Budget, Resources, and Timeline
Senior stakeholders need to know whether the project can still deliver within approved constraints. This section should connect spending, staffing, and schedule into one performance view.
Report on:
Actual spend to date
Budget remaining
Variance against baseline
Current resource allocation
Capacity concerns
Timeline shifts or forecast changes
If you only report spend without forecasting the effect on delivery, the section is incomplete. If you only report headcount without utilization, it lacks management value.
Many project reports fail here. They mention problems but never state what executive action is required. This section should be explicit.
Examples include:
Approval for additional budget
Decision on scope tradeoff
Escalation with external vendor
Priority alignment across business units
Go or no-go decision for next phase
Write each request so leadership can act immediately. If a decision is needed, state the deadline, options, implications, and recommended path.
7. Next Steps and Action Items
Close the report with forward-looking clarity. This section should show what happens next, who owns it, and when it is due.
Best practice is to list:
Upcoming priorities
Owner by action
Due date
Expected outcome
Dependencies or support needed
This turns the report from a passive status document into an active management tool.
How to Write a Project Report That Executives Will Actually Read
Executives are not ignoring project reports because they dislike reporting. They ignore reports that are slow to scan, overloaded with detail, or unclear about business impact. If you want your project report format to drive action, write for executive consumption.
Start with the decision context
Open with what changed, what matters now, and what needs a decision. Do not make leadership search for urgency. If there is budget pressure, schedule slippage, or an approval needed this week, lead with it.
This makes the report immediately useful and improves response speed.
Use concise evidence instead of raw detail
Executives do not need every task note. They need enough evidence to understand trend, exception, and impact. Replace long narrative updates with concise metrics and direct interpretation.
For example, say:
Milestone 3 delayed by 10 days due to vendor integration dependency.
Budget remains within 3% of plan.
Two new high-severity risks emerged in the security review phase.
That is stronger than a paragraph of general commentary.
Keep formatting simple and repeatable
A project report format works best when every section appears in the same order, with the same fields and visual logic. Use consistent:
Reporting dates
Status labels
Section headings
Owner fields
Priority indicators
RAG colors or status icons
Repeatability reduces friction and makes portfolio-level review much easier.
Match the report to the audience
Different stakeholders need different depth. The project team may want work package detail. Department heads may want staffing and dependency visibility. Executives usually want summary-level indicators, key exceptions, and decision points.
A strong enterprise reporting model often uses one base data model and multiple report views for different audiences.
Sample Project Report Structure for Enterprise Teams
The exact format can vary by reporting cycle and project stage, but enterprise teams usually benefit from a standard structure that can be reused across weekly, monthly, and closeout reporting.
Weekly or monthly status report example
A practical recurring report typically includes:
Executive summary
Current status indicator
Milestone tracker
Progress against plan
Top risks and issues
Decisions required
Next-step action list
This works well for steering committees, PMO reviews, and sponsor updates because it balances speed and substance.
A final report should look different from an in-flight status report. It should focus on what was delivered and what the business learned.
Key sections often include:
Original objectives versus delivered outcomes
Scope completed and deferred items
Final budget performance
Timeline performance
Lessons learned
Recommendations for future phases or similar projects
This becomes valuable institutional knowledge, especially in complex enterprise environments.
Common formatting options
The right project report format also depends on how the report will be reviewed.
Common options include:
Document: Best for formal narrative reports and approvals.
Spreadsheet: Useful for detailed logs, trackers, and budget analysis.
Dashboard: Best for live KPI monitoring and executive visibility.
Presentation: Useful for steering committees and board-level review.
In practice, many organizations combine them. The dashboard tracks real-time metrics, while the summary document provides interpretation and governance context.
Templates and Tools to Create a Project Report Faster
Most teams do not struggle with what to report. They struggle with collecting updates, standardizing inputs, and turning them into a clean reporting output on time. That is where templates and automation matter.
When to use a simple template vs. a custom format
Use a standard template when:
Reporting is recurring
Projects follow similar governance rules
Stakeholders expect the same view each cycle
Speed and consistency matter most
Use a custom format when:
The initiative is highly cross-functional
There are unusual compliance or audit requirements
Leadership needs specialized views
The project combines portfolio, financial, and operational reporting
The key is not customization for its own sake. It is fit for decision-making.
What to look for in printable and editable templates
Good templates should support both clarity and flexibility. Prioritize:
Clear section hierarchy
Consistent status fields
Editable owner and deadline fields
Branding flexibility
Export to PDF or presentation format
Space for charts, summaries, and approvals
A template should make reporting easier without forcing the team to manually rework structure every cycle.
Practical tips for Excel, Word, and design-based templates
Each tool has strengths:
Excel: Best for calculation-heavy reporting, KPI logic, and underlying data tables.
Word: Best for formal summaries, narratives, and approval workflows.
Design-based templates: Best for client-facing presentation and polished communication.
But as projects scale, manual formatting across multiple tools becomes fragile. Data gets duplicated, version control breaks down, and last-minute updates become painful.
Best practices for implementing a high-value project report format
As a consultant, I recommend these steps for enterprise teams:
Define one reporting purpose per report type
Separate weekly status, monthly governance, and final wrap-up formats. Each should support a distinct decision process.
Standardize KPI definitions early
Align on how schedule variance, budget variance, risk severity, and percent complete are calculated. Without this, reports look consistent but mean different things.
Build one source of truth for project data
Pull status, budget, and milestone data from governed systems rather than manual copy-paste updates.
Use visual summaries for exceptions, not decoration
Charts should highlight delay, variance, resource strain, and trend. If a visual does not support action, remove it.
Create an escalation path inside the report itself
Every major issue should show owner, next step, and deadline. This improves accountability and follow-through.
Common Mistakes That Make Project Reports Less Useful
Even a well-intended report can fail if it does not support decisions. The most common mistakes are predictable and avoidable.
Overloading reports with detail but no clear conclusion
More text does not mean more clarity. Summarize the implication.
Hiding risks or delays until they become major problems
Early visibility is a sign of good control, not bad performance.
Reporting activity without linking it to outcomes or business impact
Finished tasks matter only if they move the project toward its objectives.
Failing to state exactly what decision, approval, or support is needed next
If leadership does not know what action to take, the report has not done its job.
Build a Smarter Project Report Format With FineReport
Building this manually is complex; use FineReport to utilize ready-made templates and automate this entire workflow. For enterprise teams, the challenge is not just designing a project report format once. It is maintaining consistency across multiple projects, refreshing KPIs automatically, and delivering role-based views to PMs, department heads, and executives.
FineReport helps solve that by turning project reporting into a repeatable system instead of a manual reporting exercise. Teams can combine dashboards, printable reports, status summaries, budget visuals, and risk tracking into one governed environment. That means faster reporting cycles, fewer version-control issues, and clearer executive visibility.
A strong project report format should include an executive summary, project objectives and scope, status and progress, risks and issues, budget and schedule performance, key decisions needed, and next steps. The goal is to help stakeholders understand project health quickly and act on the most important changes.
A status report gives a high-level snapshot of current project health, major changes, and urgent concerns. A progress report goes deeper into completed work, milestone movement, KPI trends, and execution details over a reporting period.
The most useful KPIs usually include overall status, percent complete, milestone completion rate, schedule variance, budget variance, open risks, critical issues, and pending decisions. These metrics give executives a fast view of delivery confidence and business impact.
Most teams update project reports weekly for active initiatives and monthly for executive or portfolio reviews. The right cadence depends on project complexity, risk level, and how quickly leadership needs to respond.
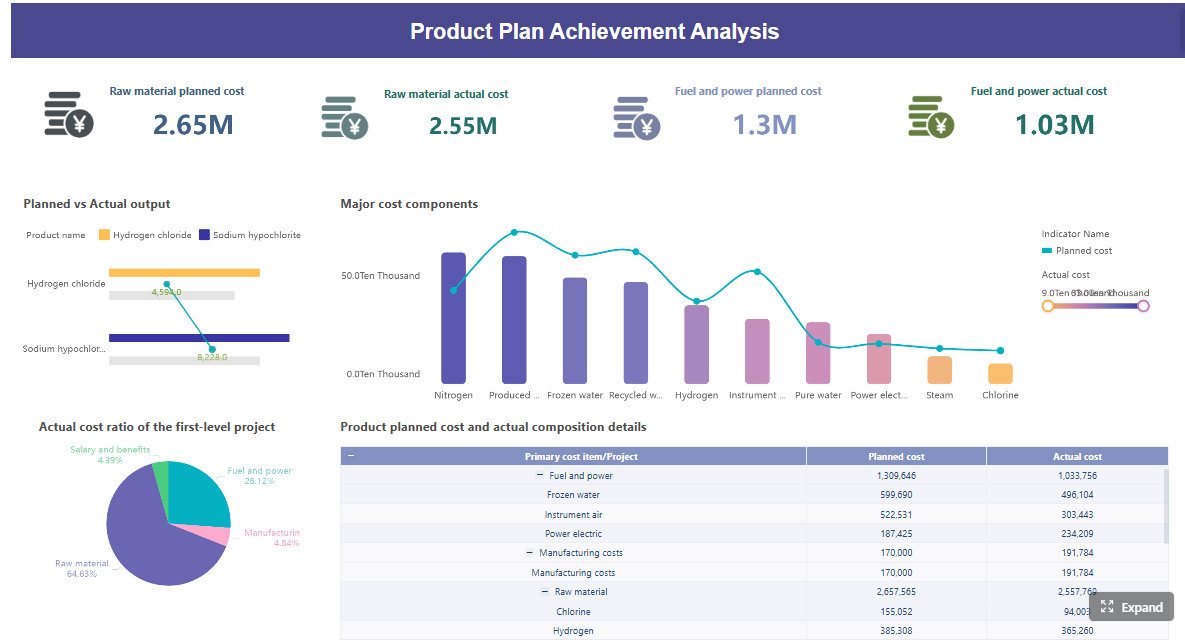
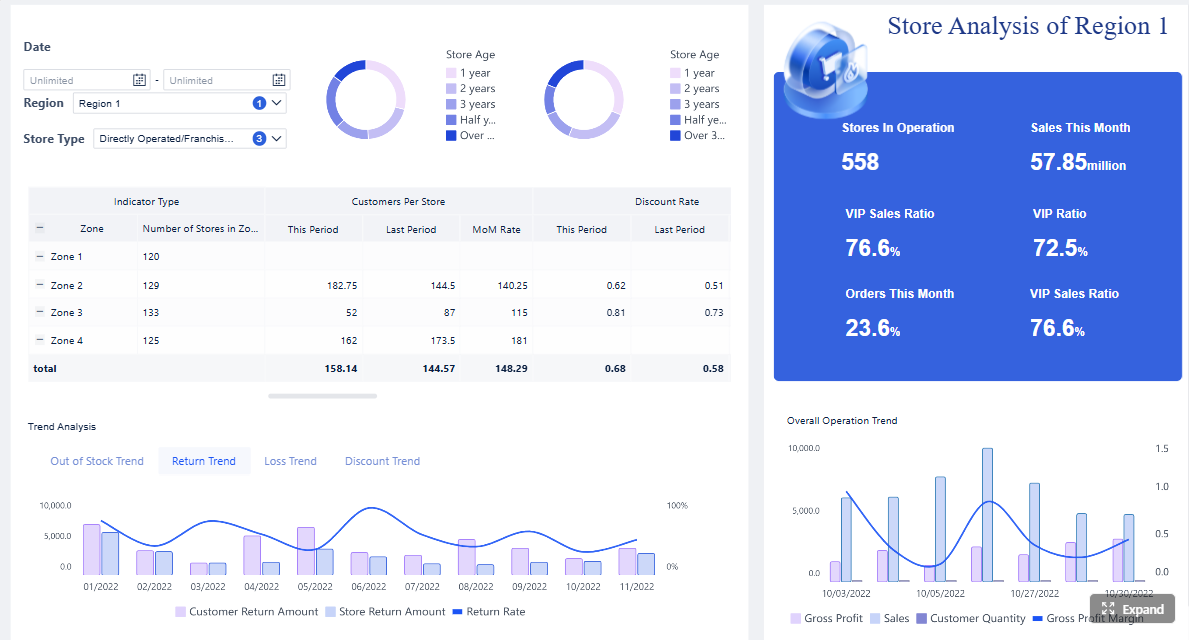
Dashboards make project data easier to scan by turning KPIs, trends, and exceptions into a visual summary. Tools like FineReport can help teams standardize reporting and give executives real-time visibility without manual report rewriting.
Product Trial
FineReport
Pixel-perfect reports · Interactive dashboards · Easy data entry · Digital twins