Executives do not need a channel dump. They need a one-page marketing campaign report example that shows, in minutes, whether spend is creating pipeline, influencing revenue, and justifying the next budget decision. If your leadership team is still reviewing disconnected PPC, email, and social reports, they are forced to guess where to cut, scale, or hold. A one-page executive report fixes that by translating campaign performance into the business outcomes leaders actually manage: efficiency, forecast confidence, and revenue impact.
Click To Try The Dashboard
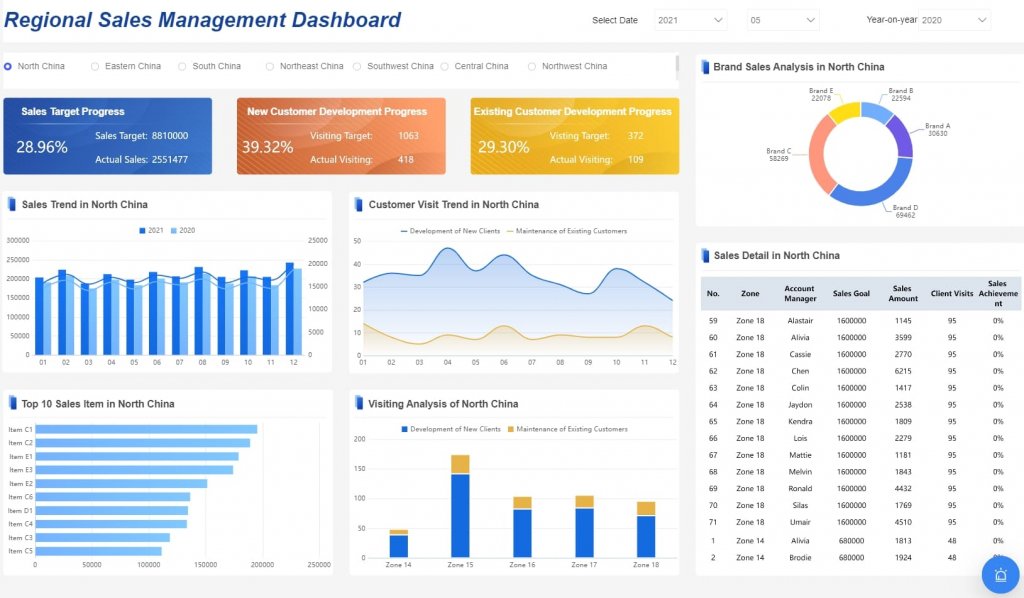
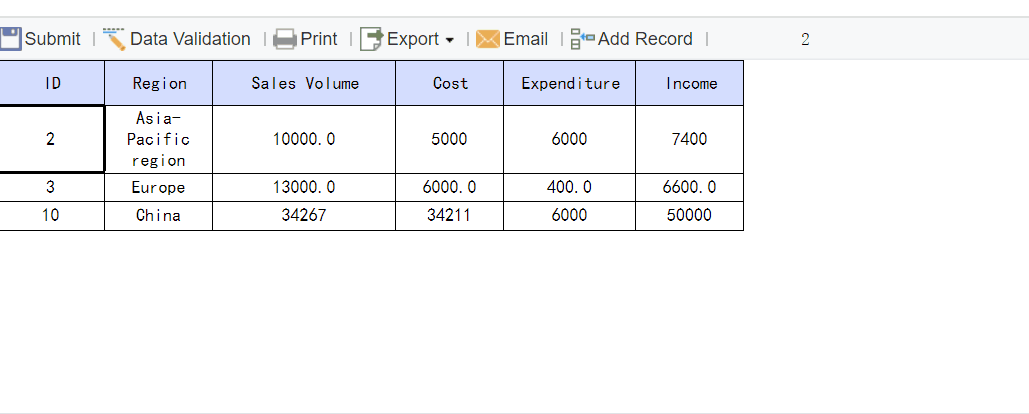
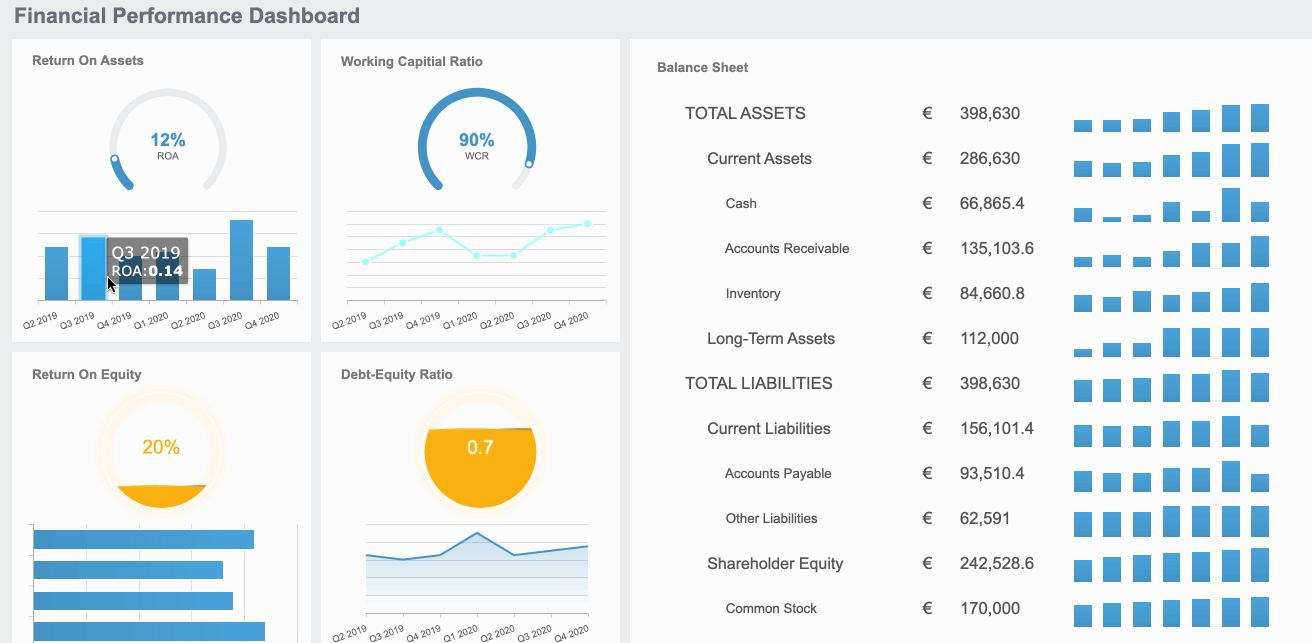
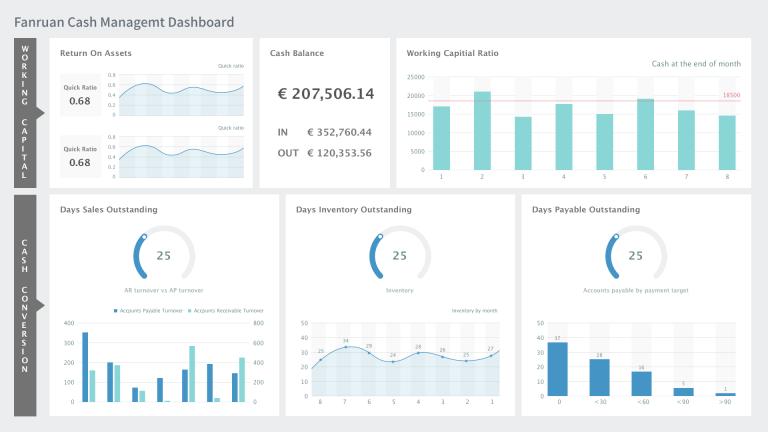
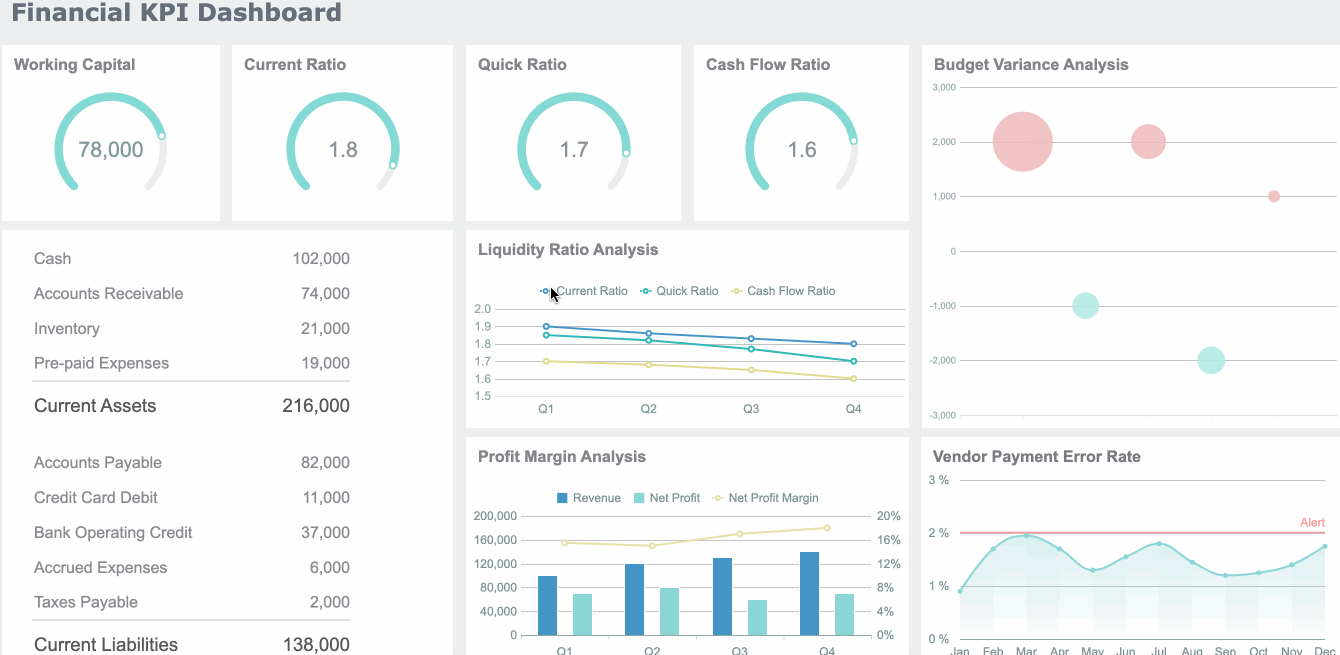
All reports in this article are built with FineReport
Marketing Campaign Report Example for Executives: What a 1-Page Report Must Include
An executive-facing report exists to deliver fast visibility into three things: spend, pipeline, and revenue impact. It should help a CEO, CFO, CRO, or VP Marketing understand whether the campaign is creating measurable business value without forcing them to interpret platform-specific data.
The strongest one-page format works because leadership reviews are decision environments, not analysis workshops. Executives want the headline, the reason behind it, the financial impact, and the recommended next move. They do not need every keyword, placement, or asset unless one of those details changes a budget or strategy call.
A good marketing campaign report example should support decisions such as:
Budget shifts: Move funds from underperforming channels to higher-yield programs
Campaign scaling: Increase spend where pipeline quality and conversion efficiency are strongest
Quarterly planning: Use actual performance to refine forecast assumptions and target allocation
Risk management: Catch underperformance early enough to protect revenue targets
Cross-functional alignment: Give finance and sales one shared view of marketing contribution
The Core Sections of a 1-Page Executive Marketing Report
A one-page report only works if every section earns its place. The layout should move from summary to proof to recommendation.
Executive summary
This is the top strip of the page and should be readable in less than 30 seconds. It should capture:
Campaign goal: What business outcome the campaign was designed to achieve
Target audience: Which segment or buying group the campaign targeted
Timeframe: Reporting period and whether results are complete or in-flight
Headline result: The single most important performance takeaway
Example:
Q2 ABM Expansion Campaign | Mid-market SaaS IT buyers | Apr 1-Jun 30
Generated 2.4Mininfluencedpipelineon180K spend, exceeded pipeline target by 18%, but opportunity-to-close conversion lagged forecast by 9%.
That is the level of clarity executives want.
Budget, performance, and revenue snapshot
This section is the operational core of the page. It should condense financial and funnel outcomes into a compact scorecard that answers: what did we spend, what did we get, and was it efficient?
Key Metrics (KPIs)
Budget vs. Actual Spend: Planned campaign budget compared with real spend to show control and pacing.
Leads Generated: Total qualified inquiries or responses attributable to the campaign.
Marketing Qualified Leads (MQLs): Leads that met predefined qualification thresholds.
Sales Accepted Leads (SALs) or SQLs: Leads validated by sales as worth pursuing.
Opportunities Created: Pipeline opportunities opened from campaign-generated or campaign-influenced demand.
Pipeline Created: Total open opportunity value sourced by the campaign.
Revenue Influenced: Closed-won revenue where the campaign contributed meaningfully to progression.
Sourced Revenue: Revenue from deals where the campaign was the primary origin point.
Assisted Revenue: Revenue where the campaign supported the journey without being the first touch.
Customer Acquisition Cost (CAC): Total campaign cost divided by customers acquired.
Return on Ad Spend (ROAS): Revenue generated for every dollar spent on paid promotion.
Pipeline-to-Spend Ratio: Pipeline value created divided by campaign spend.
Lead-to-Opportunity Conversion Rate: Percentage of leads that became opportunities.
Opportunity-to-Close Rate: Percentage of opportunities that became won deals.
Payback Period: Time needed to recover campaign investment from gross profit or revenue contribution.
This is the section that separates reporting from decision support. Numbers alone do not help leadership act. You need to explain what changed, why it matters, and what approval or escalation is needed.
A strong insight block includes:
What changed: Performance shift versus prior period, target, or forecast
Why it matters now: Revenue, budget, or execution implication
What leaders should do: Approve expansion, pause spend, revise targeting, or request deeper analysis
For example:
Paid search delivered 42% of opportunities on 28% of spend, indicating room to scale.
LinkedIn video ads raised reach but underperformed on lead quality, pressuring CAC.
Pipeline is ahead of target, but close rate softness suggests sales follow-up speed needs review before increasing top-of-funnel budget.
A Simple 1-Page Marketing Campaign Report Example
The best way to understand the format is to see the structure in plain language.
Analyst Report Download: Highest lead volume, lower conversion quality
Three Key Insights
Paid search captured high-intent demand and delivered the most efficient pipeline.
Webinar attendees converted to opportunities at nearly 2x the campaign average.
Content syndication increased lead volume but diluted lead quality and increased follow-up burden.
Two Recommended Actions
Reallocate 15% of syndication budget into paid search and webinar promotion next period.
Tighten MQL criteria for content downloads to improve sales acceptance rate.
Example narrative executives can scan quickly
This campaign delivered strong top- and mid-funnel performance, generating 3.1Minpipelineon238K spend and finishing 24% above pipeline target. Revenue impact is strongest in paid search and webinar-driven opportunities, where buyer intent and conversion efficiency were highest. Closed revenue is trailing the original forecast, but current opportunity aging suggests delayed realization rather than demand weakness. Recommendation: shift budget away from low-quality lead sources and expand the channels already producing efficient pipeline.
How to Connect Spend to Revenue Clearly
This is where most executive reports fail. They show activity but not business impact. If leadership cannot trace budget to pipeline and revenue, the report becomes a status update instead of a management tool.
Use metrics executives already trust
Do not introduce niche marketing metrics unless they clarify a financial outcome. Focus on the measures already used in revenue reviews.
Use these first:
Pipeline created
Closed revenue
Customer acquisition cost
Return on ad spend
Payback period
Conversion rates between funnel stages
These metrics create a common language across marketing, finance, and sales.
Show attribution without overcomplicating the page
Attribution can become a credibility problem when explained poorly. Keep the language simple:
Sourced revenue: The campaign originated the deal
Influenced revenue: The campaign contributed to deal progression
Assisted revenue: The campaign supported one or more meaningful touches in the buying journey
The page should not debate attribution methodology. It should make attribution categories transparent enough that executives understand what kind of revenue impact they are seeing.
A number without context invites misinterpretation. Add at least three reference points:
Against target
Against prior period
Against forecast
For example, saying pipeline created was $3.1M is useful. Saying it was 24% above target, 18% above prior quarter, and 6% below forecasted close timing is far more actionable.
Common Mistakes That Weaken Executive Marketing Reports
Executive trust is easy to lose. Most bad reports fail for predictable reasons.
Reporting too many metrics
If the report includes dozens of channel-level numbers, the core message disappears. Remove anything that does not change a spending, staffing, or strategy decision.
Common noise to reduce:
Impressions without conversion context
Clicks without pipeline impact
Engagement metrics that do not correlate with revenue outcomes
Overly granular campaign breakdowns on an executive page
Leading with activity instead of business outcomes
Executives do not approve larger budgets because clicks improved. They approve budgets because efficient growth improved.
Always lead with:
Spend
Pipeline
Revenue
Efficiency
Recommendation
Only then should you support the conclusion with activity metrics if needed.
Hiding the recommendation
Too many reports stop at analysis. That creates more work for leadership. Every report should end with a clear recommendation that includes:
Decision required
Owner
Timeline
Example: Decision: Approve $40K reallocation from content syndication to paid search Owner: VP Marketing Timeline: Effective next reporting period
How to Adapt This Format for Different Stakeholders
The one-page structure stays stable, but emphasis should shift based on stakeholder priorities.
For CEOs and founders
CEOs want to understand growth contribution and strategic tradeoffs. Prioritize:
Finance leaders care about control, predictability, and returns. Emphasize:
Budget vs. actual spend
Forecast accuracy
CAC and payback
Return by campaign or channel
Revenue timing assumptions
Make it easy for finance to verify that performance claims map to recognized commercial metrics.
For sales and revenue leaders
Sales leaders want confidence in lead quality and pipeline velocity. Highlight:
Lead quality by source
Sales acceptance rate
Opportunity conversion
Pipeline velocity
Campaign influence on closed deals
This makes marketing more credible as a revenue partner, not just a demand source.
Best Practices to Build a High-Trust Executive Report
If you are implementing this format for the first time, use a disciplined process. This is how experienced operators keep reports decision-ready.
1. Start with the decision, not the dashboard
Before building the page, ask: what decision should this report help leadership make?
Examples include increasing budget, stopping a campaign, revising targeting, or adjusting forecast assumptions.
Then select only the metrics needed to support that decision.
2. Standardize revenue definitions across teams
Agree on sourced, influenced, assisted, MQL, opportunity, and CAC definitions with finance and sales before publishing the report. If every team uses different definitions, no dashboard will create trust.
3. Use a fixed one-page structure every reporting cycle
Executives process information faster when the format is consistent. Keep the same layout month to month or quarter to quarter:
Summary
KPI snapshot
Funnel
Top contributors
Insights
Recommendations
Consistency improves pattern recognition and speeds up review time.
4. Annotate anomalies, not every number
Use short callouts only where explanation is required:
Spend spike due to launch week
Conversion drop due to SDR capacity constraint
Revenue timing delay from procurement cycle extension
That keeps the report concise while preserving context.
5. End with an owner-backed action plan
Your final section should name who will act, what they will do, and by when. This turns reporting into execution management.
Building this manually is complex; use FineReport to utilize ready-made templates and automate this entire workflow. For most teams, the real problem is not knowing what a good executive report looks like. The real problem is pulling fragmented campaign data, aligning attribution logic, calculating revenue metrics, and packaging everything into a consistent one-page format every reporting cycle.
FineReport helps solve that operational burden by making it easier to:
Consolidate marketing, CRM, and sales data in one reporting layer
Build executive-ready one-page dashboards with clear KPI cards and funnel views
Standardize calculation logic for pipeline, revenue influence, CAC, and ROAS
Reuse templates across campaigns, business units, and reporting periods
Automate refreshes so teams spend less time preparing slides and more time acting on insights
For enterprise teams, that means less spreadsheet stitching, fewer reporting disputes, and faster leadership reviews. Instead of manually rebuilding the same executive summary every month, you can operationalize a trusted reporting framework that scales.
If you need a practical, executive-ready marketing campaign report example, the right answer is not another static spreadsheet. It is a repeatable reporting system that connects spend to revenue clearly and consistently.
It should show spend, pipeline, revenue impact, efficiency metrics, and a short summary of insights and next steps. The goal is to help leaders make budget and forecasting decisions quickly.
An executive report focuses on business outcomes like pipeline, influenced revenue, CAC, and ROAS instead of platform details. Channel-level reports are useful for optimization, but executives need a high-level decision view.
The most important KPIs usually include budget versus actual spend, opportunities created, pipeline created, revenue influenced, CAC, ROAS, and conversion rates through the funnel. These metrics connect marketing activity to financial performance.
Most teams use a monthly cadence for executive reporting because it balances clarity with enough data to spot trends. For fast-moving campaigns, weekly reviews may help when budget or performance changes require quick action.
A one-page format reduces noise and highlights the numbers and insights leaders actually use. It makes it easier to compare results against targets, identify risks, and approve the next move without digging through multiple reports.
Product Trial
FineReport
Pixel-perfect reports · Interactive dashboards · Easy data entry · Digital twins