Enterprise report generation becomes a business-critical function the moment teams can no longer afford delayed decisions, inconsistent numbers, or endless spreadsheet rework. For IT managers, operations directors, finance leaders, and data teams, the problem is rarely a lack of data. The real issue is turning fragmented data into secure, role-based, repeatable reports that different stakeholders can trust and act on quickly.
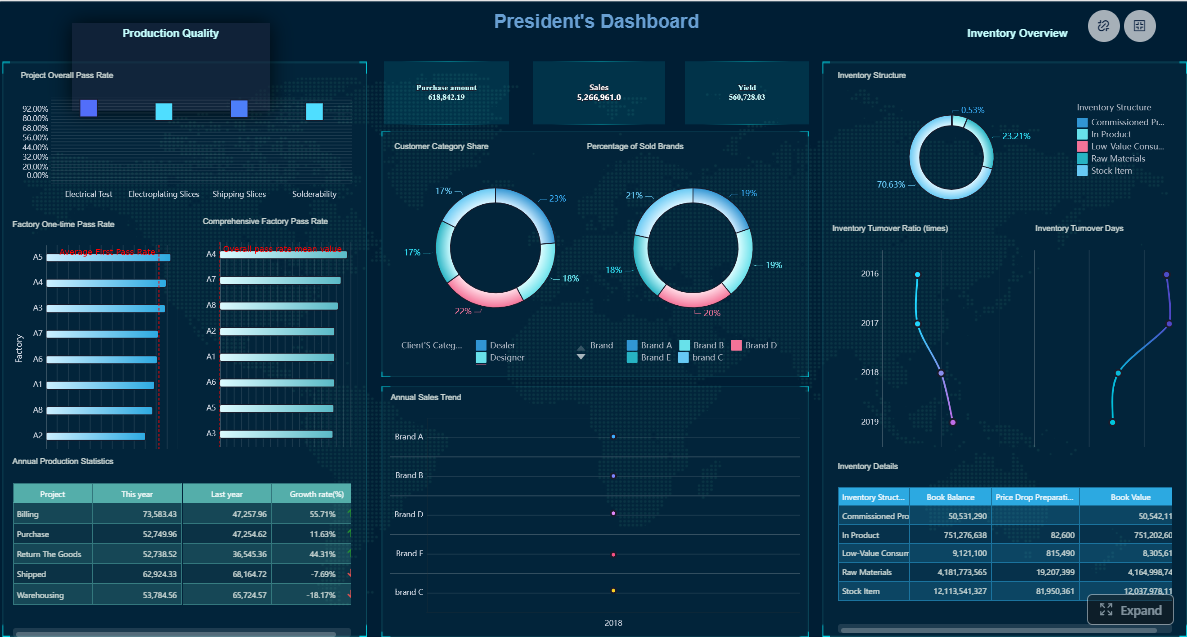
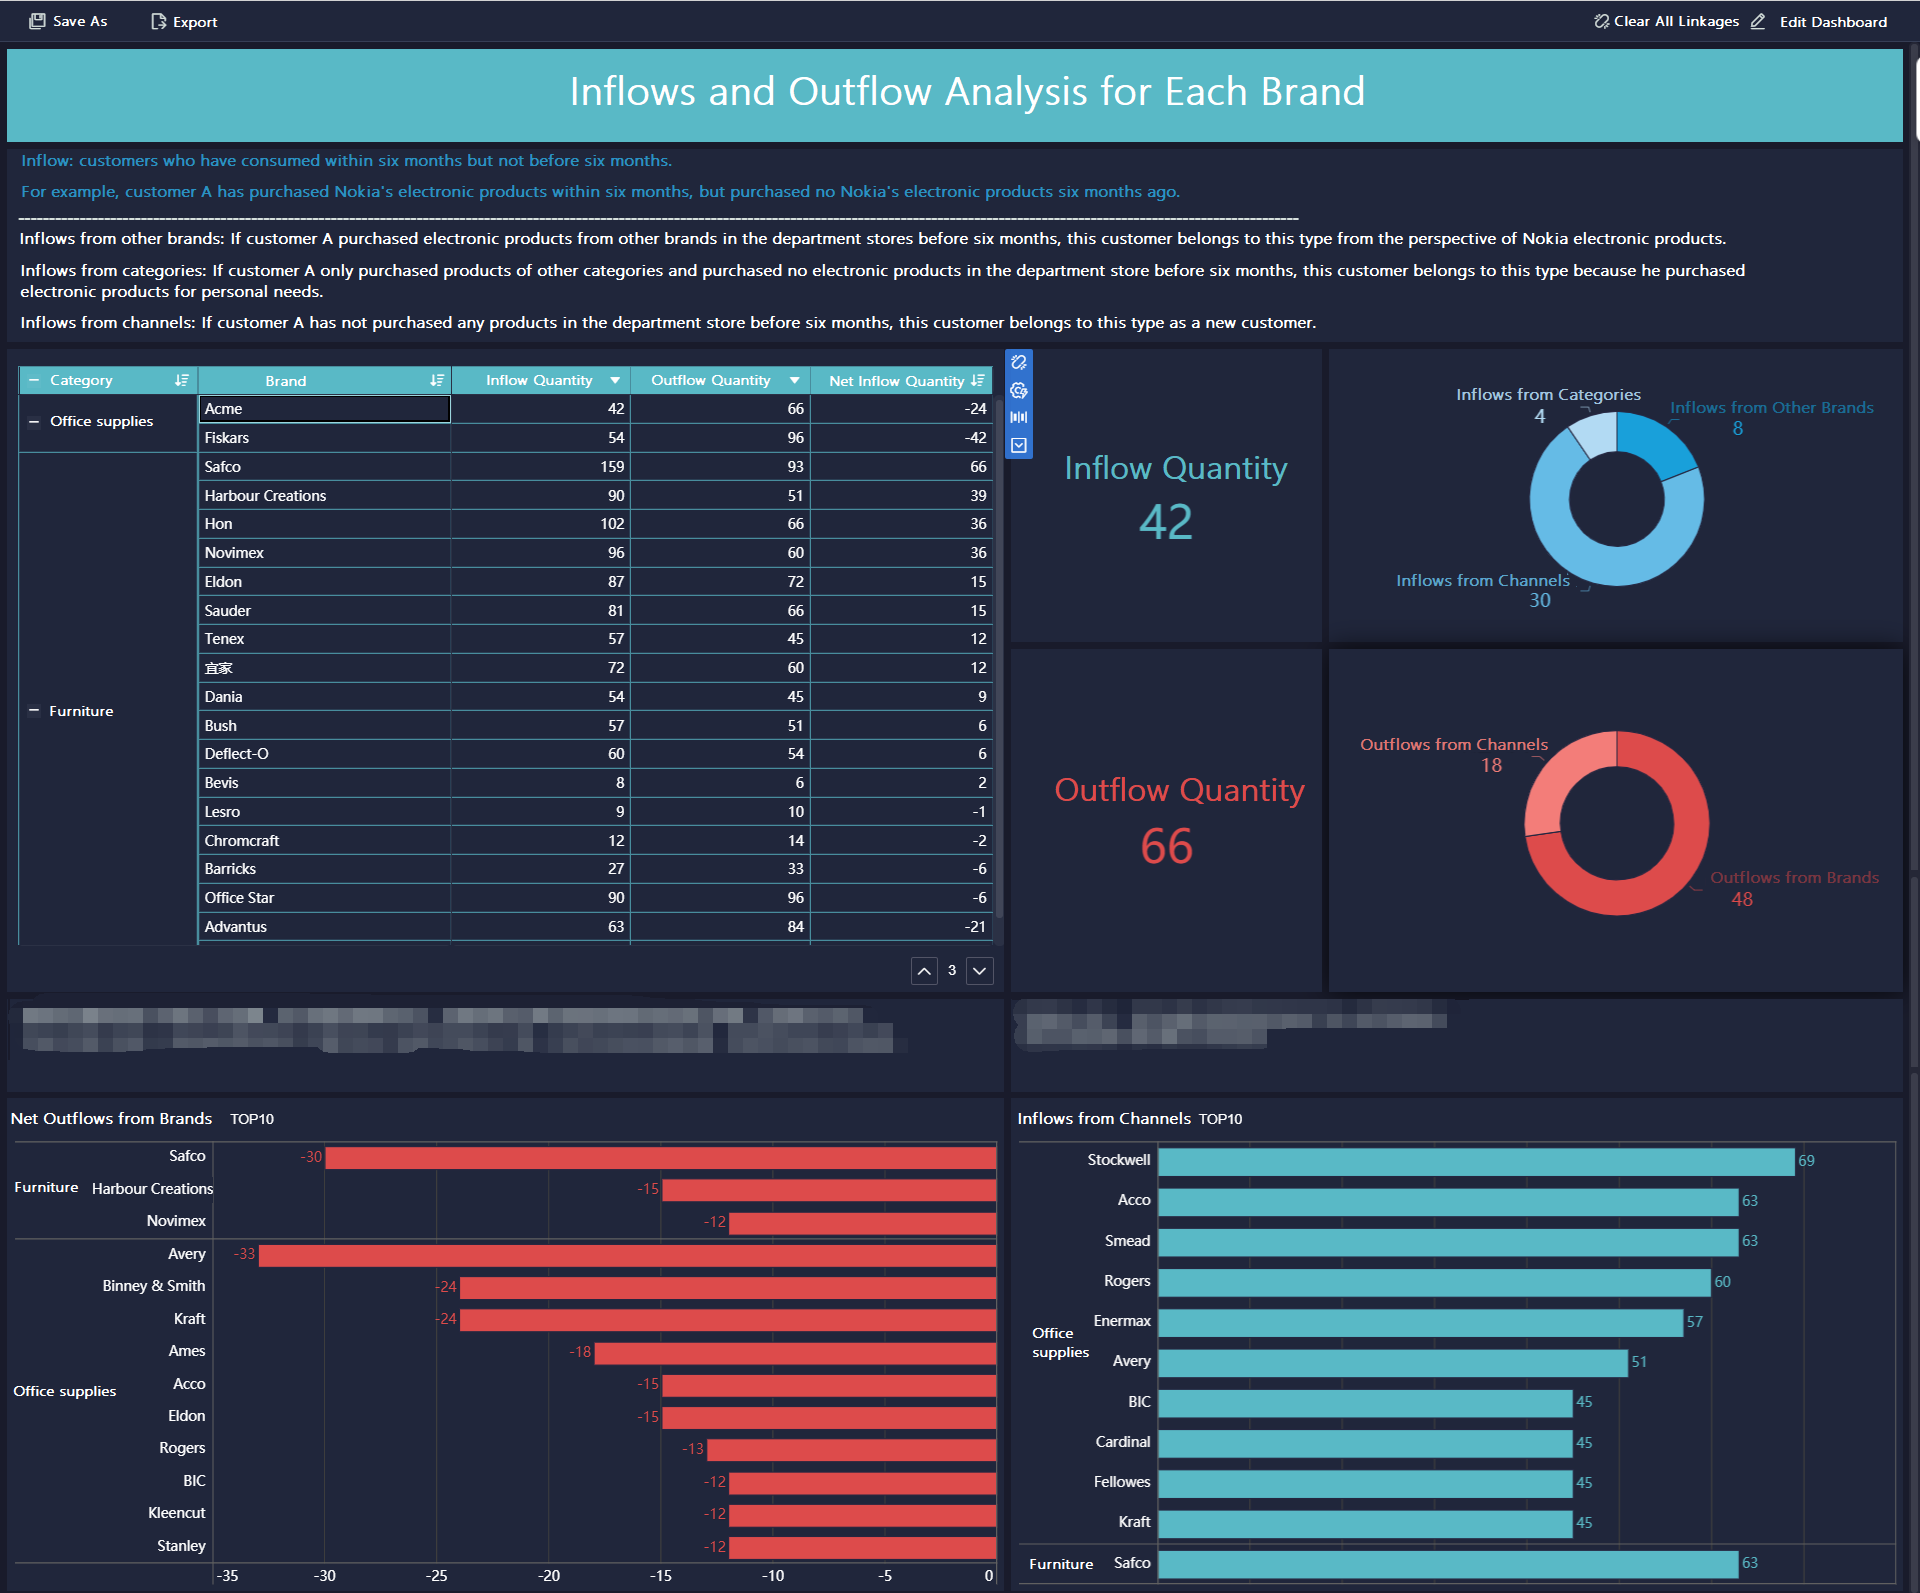
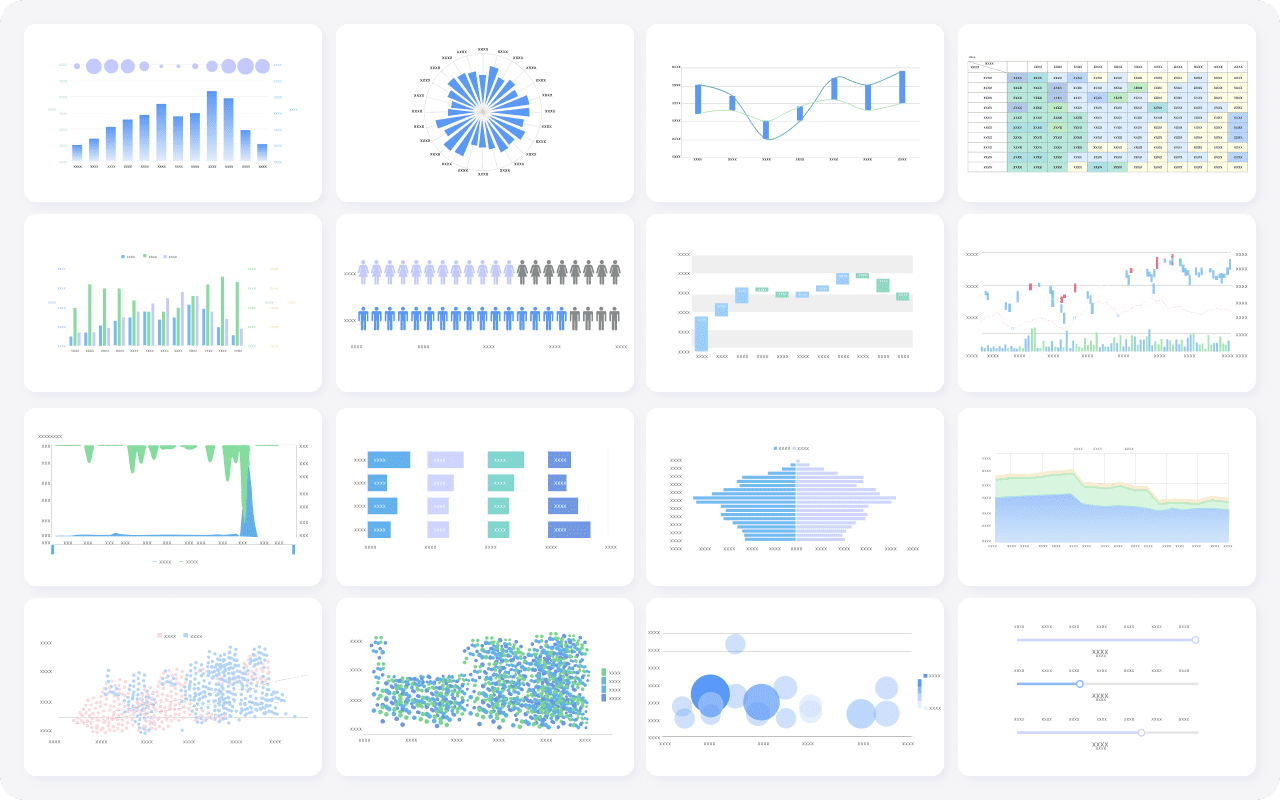
All reports in this article are built with FineReport
Spreadsheet reporting works at a small scale, but it breaks down fast in enterprise environments. Once multiple departments, regions, and managers need different views of the same data, manual reporting becomes a bottleneck instead of a business tool.
Common bottlenecks in spreadsheet-based reporting workflows
Most spreadsheet-based reporting processes rely on manual exports, copy-paste operations, and ad hoc formulas. That creates friction at every step.
Typical bottlenecks include:
Data pulled from multiple systems into separate files
Repeated formatting work for weekly or monthly reports
Email-based file sharing with no central control
Delays caused by waiting for one person to update the latest version
These inefficiencies are expensive. Teams spend more time preparing reports than interpreting them.
Risks around version control, data accuracy, and slow decision-making
Manual spreadsheets introduce risk because they are easy to change and hard to govern. A broken formula, outdated export, or duplicate file can alter reported numbers without anyone noticing immediately.
The biggest risks include:
Version control issues: Teams work from different files and debate which one is correct
Data accuracy problems: Manual transformations increase the chance of formula and entry errors
Slow reporting cycles: Leadership waits too long for updated information
Weak auditability: It is difficult to trace who changed a number and why
Security gaps: Sensitive data may be shared too broadly through files and email attachments
When trust in reports drops, decision speed drops with it.
Why scaling across departments makes manual reporting unsustainable
As organizations scale, reporting requirements become more complex. Sales wants territory views. Operations needs daily exceptions. Finance needs monthly summaries. Executives want top-line KPIs with drill-down access. Spreadsheet workflows are not designed for this level of complexity.
What starts as a “simple reporting workaround” often becomes:
A fragile reporting chain dependent on a few key people
A patchwork of templates with inconsistent logic
A major operational burden during close cycles, board reporting, or planning periods
At that point, enterprise teams need a structured report generation system, not more spreadsheet tabs.
What effective report generation looks like in an enterprise setting
Effective enterprise report generation is automated, reliable, governed, and aligned to how decisions are made. It should reduce manual effort while improving visibility across the business.
Core characteristics of automated, reliable, and repeatable reporting
A mature reporting model has a few non-negotiable characteristics:
Automated data flow: Data moves from source systems into reports without manual consolidation
Consistent business logic: Definitions, calculations, and filters are standardized
Role-based delivery: Each stakeholder sees relevant information without unnecessary noise
Scheduled refreshes: Reports update on a defined cadence or event trigger
Governed access: Permissions protect sensitive information
Auditability: Teams can track logic changes, ownership, and report usage
These capabilities turn reporting from a reactive task into a repeatable operational process.
The difference between static exports and dynamic report generation
Static exports are snapshots. Dynamic report generation is a live reporting workflow.
Static exports typically:
Show data as of one moment in time
Require manual re-export when data changes
Offer limited filtering and little drill-down capability
Create multiple disconnected versions across teams
Dynamic report generation, by contrast:
Pulls updated data automatically
Applies predefined rules and calculations consistently
Supports user-specific filters and permissions
Enables drill-down from summary to detail
Delivers reports through portals, scheduled emails, or embedded workflows
This difference matters because business users do not just need reports. They need reports that stay relevant without repeated manual intervention.
How standardized reporting improves trust and operational visibility
Standardization improves trust because everyone works from the same logic, definitions, and presentation rules. It also improves operational visibility because users can compare performance across teams, periods, and regions without translation work.
Key Metrics (KPIs) for enterprise report generation
Below are the most important KPIs and core elements to manage in a scalable reporting environment:
Report turnaround time: How long it takes from data availability to report delivery
Refresh frequency: How often reports are automatically updated
Error rate: The percentage of reports requiring correction due to data or logic issues
Manual touchpoints: The number of human steps required to produce a report
User adoption rate: The share of intended users actively viewing or using reports
Time saved per cycle: Hours eliminated by automating repetitive reporting work
Data source coverage: The number of key business systems integrated into the reporting flow
Permission accuracy: The degree to which users see only the data they are authorized to access
Report consistency rate: How reliably templates, calculations, and formats are applied across teams
Drill-down usage: How often users move from summary metrics into detailed analysis
Delivery success rate: The percentage of scheduled reports delivered on time without failure
Change control compliance: Whether report updates follow approved governance processes
How to design role-based reports for different stakeholders
Role-based reporting is where enterprise report generation becomes genuinely useful. A report should not simply display data. It should match the decisions, responsibilities, and urgency of the person reading it.
Define who needs what information
The first design principle is simple: different stakeholders need different levels of detail. Executives need direction and risk signals. Department leaders need performance drivers. Operations managers need exceptions and actions.
Map reports to executives, department leaders, operations teams, and frontline managers
A strong role-based model usually breaks down like this:
This structure avoids the common mistake of giving every user the same dashboard and expecting it to work.
Separate strategic metrics from operational details to reduce noise
One of the fastest ways to damage report usability is to mix top-level strategy metrics with too much low-level detail. If every audience gets everything, nobody gets clarity.
A better approach is to separate:
Strategic reports: Focused on outcomes, trends, and major business risks
Tactical reports: Focused on team performance and root-cause drivers
This separation makes reports more actionable because users see what they can influence.
Set permissions and data access rules
Role-based design is not only about usability. It is also about control. Enterprise reporting must ensure that users access only the data they are allowed to see.
Limit visibility based on role, region, team, or function
Practical permission rules often include:
Role-based visibility for executives, managers, analysts, and administrators
Region-level filtering for multi-country or multi-branch organizations
Department-level access for sales, finance, HR, operations, and procurement
Team-specific or manager-specific access for local oversight
Record-level rules for sensitive transactions or employee data
These rules allow one reporting framework to serve many audiences securely.
Protect sensitive data while keeping reports useful and actionable
Security should not make reports unusable. The goal is controlled relevance. For example:
Finance can see margin and cost details, while operations sees volume and efficiency only
Regional managers see only their territory, while headquarters sees aggregated views
HR or payroll fields are excluded from operational dashboards entirely
Strong permissions reduce risk while preserving decision-making speed.
Build layouts that match decision-making needs
Layout design determines whether a report gets used or ignored. The best report structures match how each audience consumes information and what action they are expected to take next.
Choose the right level of summary, drill-down, and update frequency
Ask three questions for every report:
What decisions does this user make?
How much detail do they need before acting?
How often does this information need to change?
That usually leads to practical design choices such as:
KPI cards and trends for executives
Department scorecards for business leaders
Drill-down tables for analysts and operations users
Exception views and alerts for frontline supervision
Align report structure with the actions each audience needs to take
A useful report should naturally guide action. That means:
Put the most important KPIs at the top
Highlight thresholds, variances, and exceptions clearly
Enable drill-down to root cause where necessary
Avoid overcrowding pages with low-value metrics
Use update intervals that match operational reality
A weekly strategic report and a real-time operations report should not look the same, because they support different decisions.
How to automate report workflows without manual spreadsheet work
Enterprise report generation should remove repetitive labor from the workflow, not simply digitize the same spreadsheet habits. The objective is an end-to-end flow that collects data, applies logic, generates reports, and distributes them automatically.
Connect data sources into a single reporting flow
The first step is to unify the inputs. Reports become unreliable when teams export data separately from ERP systems, CRM platforms, HR tools, production systems, and cloud applications.
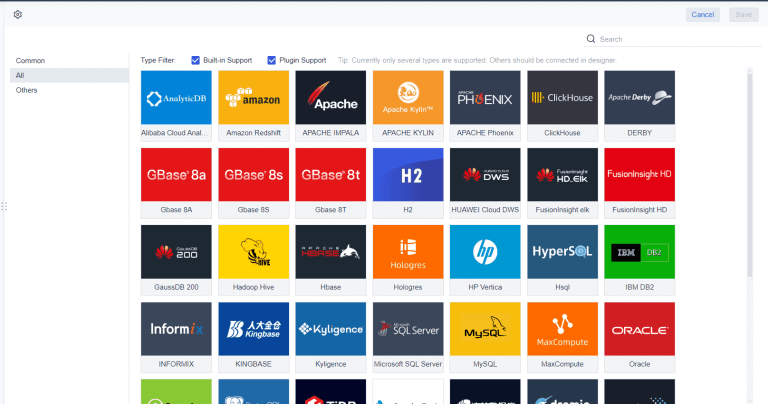
Pull data from business systems, databases, and cloud tools into one process
A scalable reporting workflow should connect to:
ERP and finance systems
CRM and sales platforms
Manufacturing or operational systems
HR and workforce applications
SQL databases and cloud data warehouses
Third-party SaaS tools used by departments
Centralized integration reduces manual reconciliation and ensures every report starts from the same source logic.
Reduce copy-paste work and eliminate disconnected reporting steps
When data flows into one reporting process, teams eliminate:
The result is more than efficiency. It is consistency at scale.
Apply logic, scheduling, and delivery rules
Once data is connected, the next priority is automation logic. This is where enterprise reporting becomes predictable.
Automate calculations, filtering, formatting, and report distribution
Reporting automation should cover:
Standard metric calculations
Role-based filters and parameter rules
Conditional formatting for exceptions or thresholds
Template-driven layouts for different report types
Distribution through portals, email, or embedded systems
This ensures that every recurring report is generated the same way every time.
Schedule recurring reports and trigger updates based on events or time intervals
Mature organizations do not wait for users to ask for every report manually. They define refresh rules such as:
Daily operations reports at shift start
Weekly management summaries every Monday morning
Month-end financial packs after close completion
Trigger-based alerts when KPIs breach thresholds
Automated scheduling shortens reporting cycles and reduces dependency on individual analysts.
Add governance and quality checks
Automation without governance creates fast confusion. Enterprises need quality controls so reports remain trustworthy as requirements evolve.
Validate inputs, monitor failures, and create accountability for report changes
A strong reporting governance layer should include:
Input validation for source completeness and quality
Alerts for failed refreshes or broken jobs
Approval workflows for template or logic changes
Clear ownership for each report and metric definition
Logging for who changed what and when
Maintain consistency as reporting requirements evolve across teams
Over time, business units will request new fields, filters, and views. Without governance, reporting sprawl returns quickly. The answer is a controlled model where teams can enhance reports without breaking standards.
How to implement and scale report generation across teams
Rolling out enterprise report generation requires more than technology. It requires prioritization, governance, and measurement.
Start with high-impact reporting use cases
Begin with reports that are painful, frequent, and visible. This creates quick wins and builds confidence in the automation program.
Strong early candidates include:
Weekly executive KPI packs
Department performance scorecards
Sales pipeline and territory reports
Operations exception and throughput reports
Financial close and budget variance reports
Prioritize reports that are frequent, time-consuming, and widely used
A useful prioritization lens is:
High manual effort
High business visibility
High recurrence
High error exposure
High cross-functional dependency
These reports usually deliver the fastest measurable ROI.
Identify quick wins that prove value early
Quick wins matter because they help secure stakeholder buy-in. If one automated report saves ten hours every week and improves consistency for multiple teams, it becomes much easier to scale the initiative.
Create standards for ownership and maintenance
Enterprise reporting fails when nobody knows who owns definitions, templates, and exceptions. Clear operating rules are essential.
Define who manages data definitions, templates, approvals, and exceptions
Recommended ownership areas include:
Business owners: Define KPI meaning and report purpose
Data teams: Manage data quality, integration logic, and transformations
IT or platform owners: Manage infrastructure, security, and access control
Report administrators: Maintain templates, schedules, and delivery rules
Approvers: Review changes to calculations, layouts, or permissions
Document processes so reporting can scale without confusion
This reduces dependency on tribal knowledge and supports long-term scalability.
Measure success after rollout
If you want report automation to expand, measure the outcomes. Enterprise leaders need proof that the new process is better than the old one.
Track time saved, error reduction, adoption, and reporting turnaround time
Core success measures include:
Hours saved per reporting cycle
Reduction in report corrections and disputes
Faster turnaround from data close to report delivery
Higher stakeholder usage and engagement
Improved confidence in shared KPIs
Use feedback loops to refine reports and expand automation responsibly
After rollout, gather structured feedback from each audience:
Which metrics are used most?
Which views are ignored?
Where is drill-down still missing?
Are permissions working correctly?
Are update frequencies aligned with operational needs?
This keeps the reporting environment useful instead of bloated.
Best practices for implementing report generation successfully
From a consulting perspective, these five practices consistently separate successful enterprise rollouts from failed ones:
Fix the reporting logic before automating it
Standardize definitions, remove duplicate metrics, and clean up ownership before you build automation. If the logic is unclear, automation will only scale the confusion.
Design by decision, not by data availability
Start with the decisions each user must make, then build the report around the minimum useful information required to support those decisions.
Use one reporting framework with role-based variation
Do not create dozens of unrelated report versions. Build a governed template system with controlled differences by role, region, and function.
Automate delivery and exception handling together
Scheduled distribution is useful, but alerts for failures, anomalies, and threshold breaches are what make reporting operationally valuable.
Treat adoption as part of implementation
Launching a report is not the same as getting it used. Train stakeholders, explain KPI definitions, and review usage data after rollout.
Common mistakes to avoid when building automated enterprise reports
Many automation projects underperform because they replicate weak reporting habits instead of redesigning them.
Automating unclear processes before fixing reporting logic
If teams disagree on KPI definitions, source-of-truth systems, or approval flows, automation will spread inconsistency faster. Clarify the process first.
Creating one report format for every audience instead of tailoring by role
A single universal report usually becomes too detailed for executives and too shallow for operations teams. Tailor content and layout to the user’s decisions.
Ignoring data governance, change management, and user adoption
Reporting is not just a technical output. It is an operational system. Without governance, controlled changes, and user education, trust erodes quickly.
Build report generation faster with FineReport
Building this manually is complex; use FineReport to utilize ready-made templates and automate this entire workflow. For enterprise teams, FineReport makes report generation more scalable by combining data integration, template-based design, scheduling, permission control, and dashboard delivery in one platform.
Instead of relying on spreadsheets, disconnected exports, and custom scripts, teams can use FineReport to:
Build role-based reports for executives, managers, and operations users
Connect multiple business systems into one reporting process
Standardize KPI logic and report layouts across departments
Automate refresh schedules and report distribution
Apply fine-grained access controls by role, team, or region
Support drill-down analysis without rebuilding reports manually
This is especially valuable when organizations need to scale reporting across departments without increasing analyst workload or governance risk.
FineReport helps enterprises move from reactive spreadsheet reporting to a repeatable reporting operation that is faster, more accurate, and easier to manage.
For decision-makers, that means fewer reporting delays, stronger trust in KPIs, and a more resilient reporting framework across the business.
Enterprise report generation is the process of automatically turning data from multiple systems into standardized reports for different teams and decision-makers. It helps organizations deliver accurate, repeatable insights without relying on manual spreadsheet work.
As reporting needs grow across departments, spreadsheets become slow, error-prone, and hard to control. Teams often outgrow them when version conflicts, manual updates, and security risks start delaying decisions.
Role-based reports show each user the metrics, filters, and level of detail that match their responsibilities. This reduces noise, protects sensitive data, and makes reports more useful for executives, managers, and analysts.
Static reports are fixed snapshots that must be recreated when data changes, while dynamic report generation updates automatically based on live or scheduled data refreshes. Dynamic reports also support filters, drill-downs, and governed access.
Teams should look for automated data integration, consistent business logic, scheduling, role-based permissions, and auditability. A strong platform should also make it easy to deliver trusted reports across departments at scale.
Product Trial
FineReport
Pixel-perfect reports · Interactive dashboards · Easy data entry · Digital twins