Report automation is the process of automatically collecting data, updating metrics, building reports, and delivering them to the right people on a fixed schedule or in real time. For operations leaders, analysts, finance teams, and IT managers, the business value is straightforward: less time spent copying data into spreadsheets, fewer reporting errors, and faster decisions based on current information rather than stale snapshots.
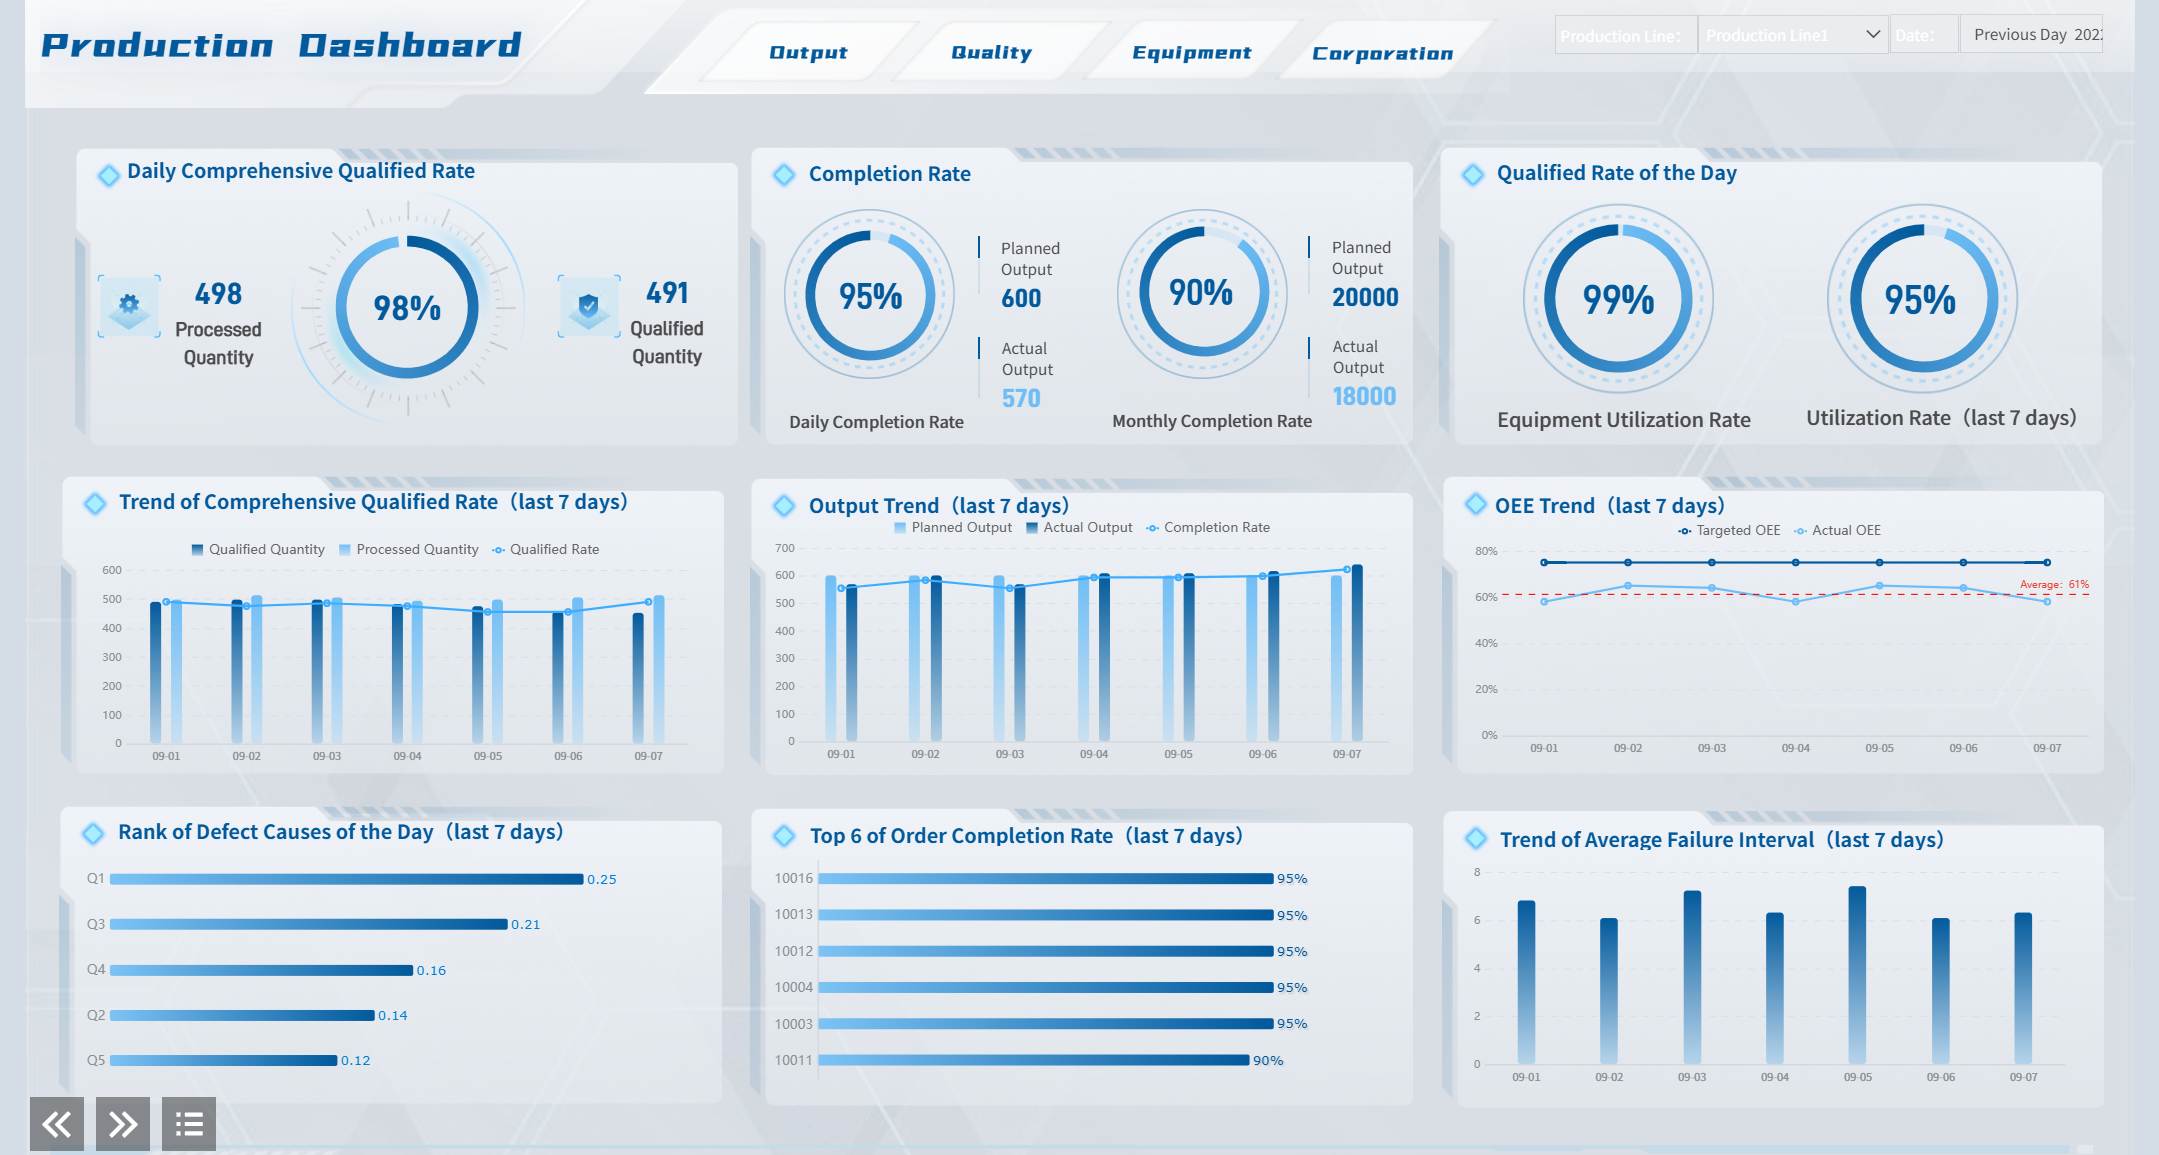
All reports in this article are built with FineReport.
At a practical level, report automation replaces repetitive reporting tasks with a repeatable system. Instead of manually exporting data from multiple tools, cleaning it in spreadsheets, rebuilding charts, and emailing stakeholders every week, teams configure a workflow once and let the system handle the recurring work.
That matters because manual reporting breaks down as complexity grows. As soon as a business uses multiple systems, runs frequent reporting cycles, or needs different stakeholder views, spreadsheets and ad hoc exports become a bottleneck. Automation reduces that friction and gives teams more time to analyze performance rather than assemble slides.
Report automation vs. dashboards vs. one-time exports
These terms are often used interchangeably, but they are not the same.
Report automation is the full process of collecting, preparing, formatting, and delivering reports automatically.
Dashboards are visual interfaces that display live or refreshed data, often as part of an automated reporting environment.
One-time exports are manual snapshots, such as a CSV or PDF downloaded for a single use.
A dashboard can be part of report automation, but a dashboard alone is not a reporting workflow. Likewise, sending a CSV once is not automation unless the extraction, formatting, validation, and delivery happen on repeat without manual intervention.
Why report automation matters to business teams
For most teams, the value shows up in four areas:
Speed: Reports are generated faster and on schedule.
Accuracy: Fewer copy-paste mistakes and formula issues.
Consistency: The same logic, definitions, and formatting are reused every cycle.
Decision velocity: Stakeholders receive timely insights and act earlier.
When reporting is automated well, leaders stop asking whether the numbers are correct and start discussing what actions to take next.
The core framework: how report automation creates business value
If you want report automation to work, you need more than a tool. You need a framework that covers data quality, process design, governance, and delivery.
Core elements of report automation
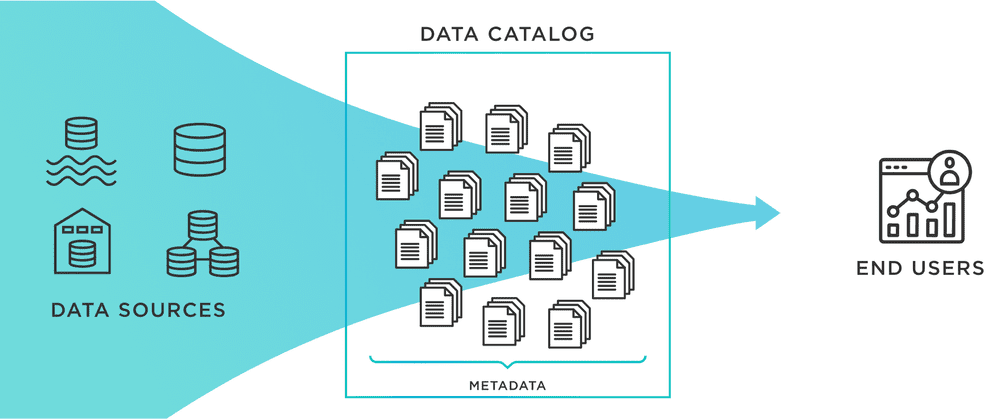
Data source connectivity: Pulls data from systems such as CRM, ERP, ad platforms, analytics tools, databases, and spreadsheets.
Data standardization: Aligns naming conventions, date formats, currencies, and dimensions across sources.
Transformation logic: Applies business rules, calculations, grouping, and aggregations.
Validation controls: Checks completeness, freshness, and accuracy before publishing.
Report templates: Standard layouts for recurring use cases.
Scheduling engine: Runs refresh jobs and distribution tasks on a defined cadence.
Permissions and access control: Ensures the right users see the right data.
Delivery configuration: Sends reports through the right channel at the right time.
Key Metrics (KPIs)
The exact KPIs depend on the department, but beginners should define a small set of trusted metrics before automating anything.
Data freshness: How recent the underlying data is when a report is delivered.
Report delivery rate: Percentage of reports delivered successfully and on time.
Error rate: Frequency of failed refreshes, broken connectors, or incorrect outputs.
Manual hours saved: Time reduced by removing repetitive reporting work.
Metric consistency: Degree to which KPI definitions stay uniform across teams and reports.
Stakeholder adoption: How often recipients open, use, or reference the report.
Time to insight: How long it takes from data generation to stakeholder visibility.
Auditability: Ability to trace where numbers came from and what logic produced them.
How report automation works from data sources to delivery
A reporting workflow usually starts with raw data and ends with an email, dashboard, exported file, or alert. The quality of each step determines whether users trust the final report.
Connecting the right data sources
Most organizations do not report from a single system. They pull data from a mix of platforms, including:
CRM systems for pipeline, revenue, and customer activity
Advertising channels for spend, clicks, and conversions
Web analytics tools for traffic and engagement
Finance software for budgets, forecasts, and actuals
ERP or operations systems for inventory, orders, and fulfillment
Spreadsheets for manually maintained business context
The challenge is not just access. It is combination. Each source may use different field names, refresh schedules, identifiers, and reporting logic. One platform may update hourly while another closes data at the end of the day. One team may define "qualified lead" differently from another. Without standardization, automated reporting simply produces faster confusion.
Building the workflow step by step
A reliable report automation process usually follows six stages.
1. Data collection
The system connects to each source and pulls the required fields on a defined schedule. This may happen through APIs, database connections, file ingestion, or direct connectors.
2. Data cleaning
At this stage, the workflow removes duplicates, corrects formatting issues, handles missing values, and aligns labels. This is where messy source data often creates the biggest delays.
3. Data transformation
Raw data is rarely report-ready. Teams need calculated fields, merged tables, grouped dimensions, and business logic such as revenue attribution, regional rollups, or budget variance formulas.
4. Validation
Before a report goes out, the workflow should verify record counts, refresh success, and metric logic. Validation protects trust. If a connector fails silently, leadership may act on incomplete numbers.
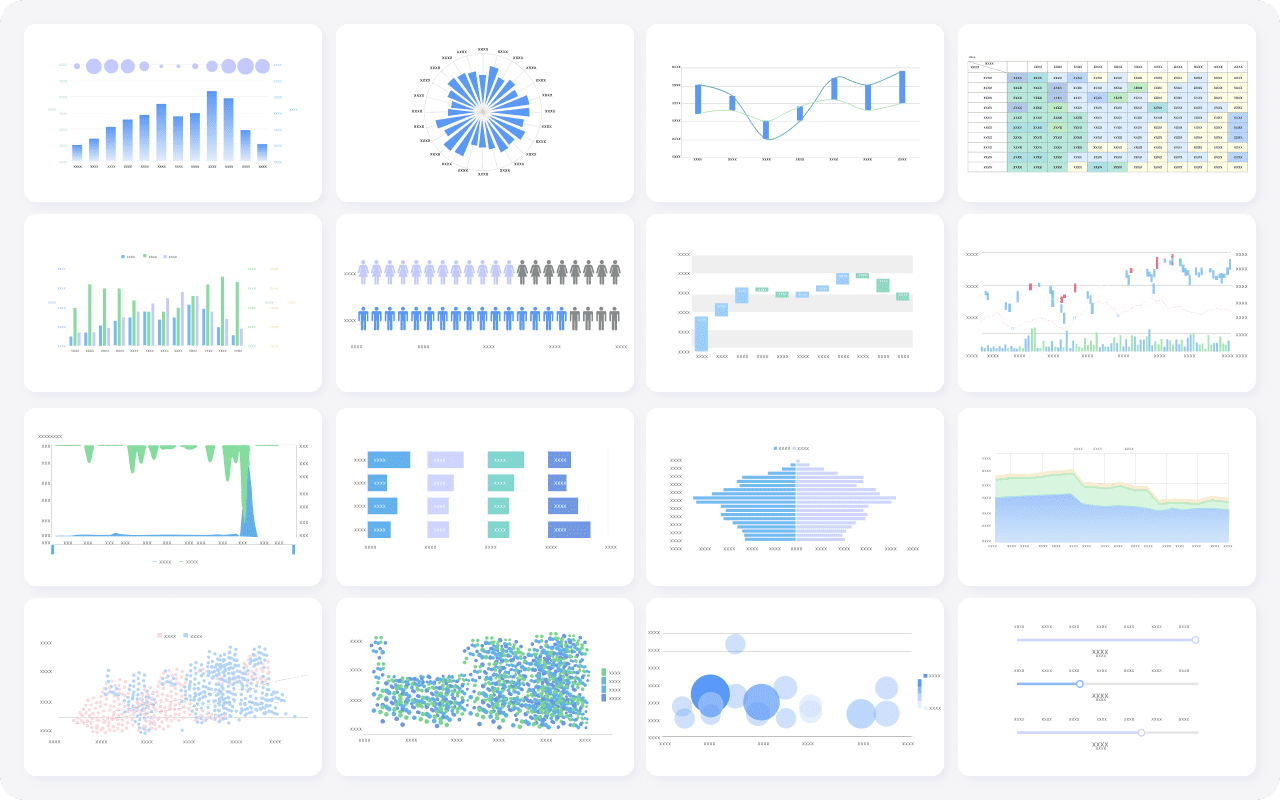
5. Visualization
The cleaned and validated data is applied to report templates, dashboards, charts, and scorecards tailored to each audience.
Finally, recurring jobs automate refreshes and delivery. This is what turns a manual process into a dependable operating rhythm.
Rules, templates, and scheduled jobs are what make report automation scalable. They let teams reuse logic instead of rebuilding the same report every Monday morning.
Choosing a delivery method
Even an accurate report can fail if it reaches stakeholders in the wrong format or at the wrong time. Delivery design is part of automation strategy, not an afterthought.
Common delivery methods include:
Email summaries: Useful for executives who want a fast snapshot in their inbox.
Shared dashboards: Best for self-service exploration and drill-down analysis.
Exported files: Helpful for formal reviews, audits, or offline distribution in PDF or Excel.
Alerts and notifications: Ideal for threshold-based monitoring such as budget overruns or operational exceptions.
Role-based reporting cadences: Different stakeholders receive different levels of detail daily, weekly, or monthly.
Accessibility, timeliness, and trust all depend on these settings. A CFO may need a monthly board-ready PDF, while an operations manager needs a live dashboard and exception alerts. Good automation supports both without duplicating work.
Where beginners can use report automation first
The best starting point is a recurring report with stable logic, clear stakeholders, and measurable business value.
Marketing and performance reporting
Marketing teams are often early adopters of report automation because they manage many channels and frequent reporting cycles. Weekly campaign summaries, monthly channel reviews, and ROI reports are repetitive by nature and usually draw from multiple tools.
These reports are strong candidates for automation because the cadence is fixed and the KPIs are usually well understood.
Sales, operations, and finance reporting
Outside marketing, the gains can be even more strategic. Sales teams need consistent pipeline visibility. Operations teams monitor throughput and service levels. Finance teams rely on accurate budget and variance reporting.
Examples include:
Sales pipeline and forecast reports
Regional revenue summaries
Inventory and order fulfillment KPIs
Budget versus actual tracking
Executive performance summaries
These reporting workflows often involve higher governance requirements, which makes auditability and permissions especially important.
Test and product analytics reporting
Software testing and product teams also benefit from report automation, especially when speed matters. Automated reporting can track test execution volume, defect trends, release quality, feature adoption, and product usage patterns.
For QA and product leaders, real-time or near-real-time visibility helps teams react faster to failed tests, product regressions, or shifts in user behavior. This is particularly useful in agile delivery environments where waiting for a weekly status deck is too slow.
What to look for in report automation tools
Choosing the right platform is less about flashy visuals and more about operational fit. The best tool is the one that supports your data complexity, reporting cadence, governance needs, and internal skill level.
Core features that matter most
When evaluating report automation tools, focus on these capabilities:
Integrations: Native connectors for your core data sources
Scheduling: Flexible refresh and distribution timing
Templates: Reusable report layouts for recurring workflows
Data transformation options: Support for calculations, joins, mapping, and standardization
Permissions: Role-based access and secure sharing
Collaboration: Commenting, review flows, and shared ownership
Auditability: Visibility into data lineage, changes, and delivery history
Export options: PDF, Excel, dashboard links, and embedded reporting
Scalability: Ability to support more data sources, users, and business units over time
A strong enterprise reporting platform should help both business users and technical teams. FineReport is often considered in these evaluations because it supports complex reporting scenarios, scheduled distribution, dashboard design, permissions, and broad integration needs without forcing teams into a purely manual build approach.
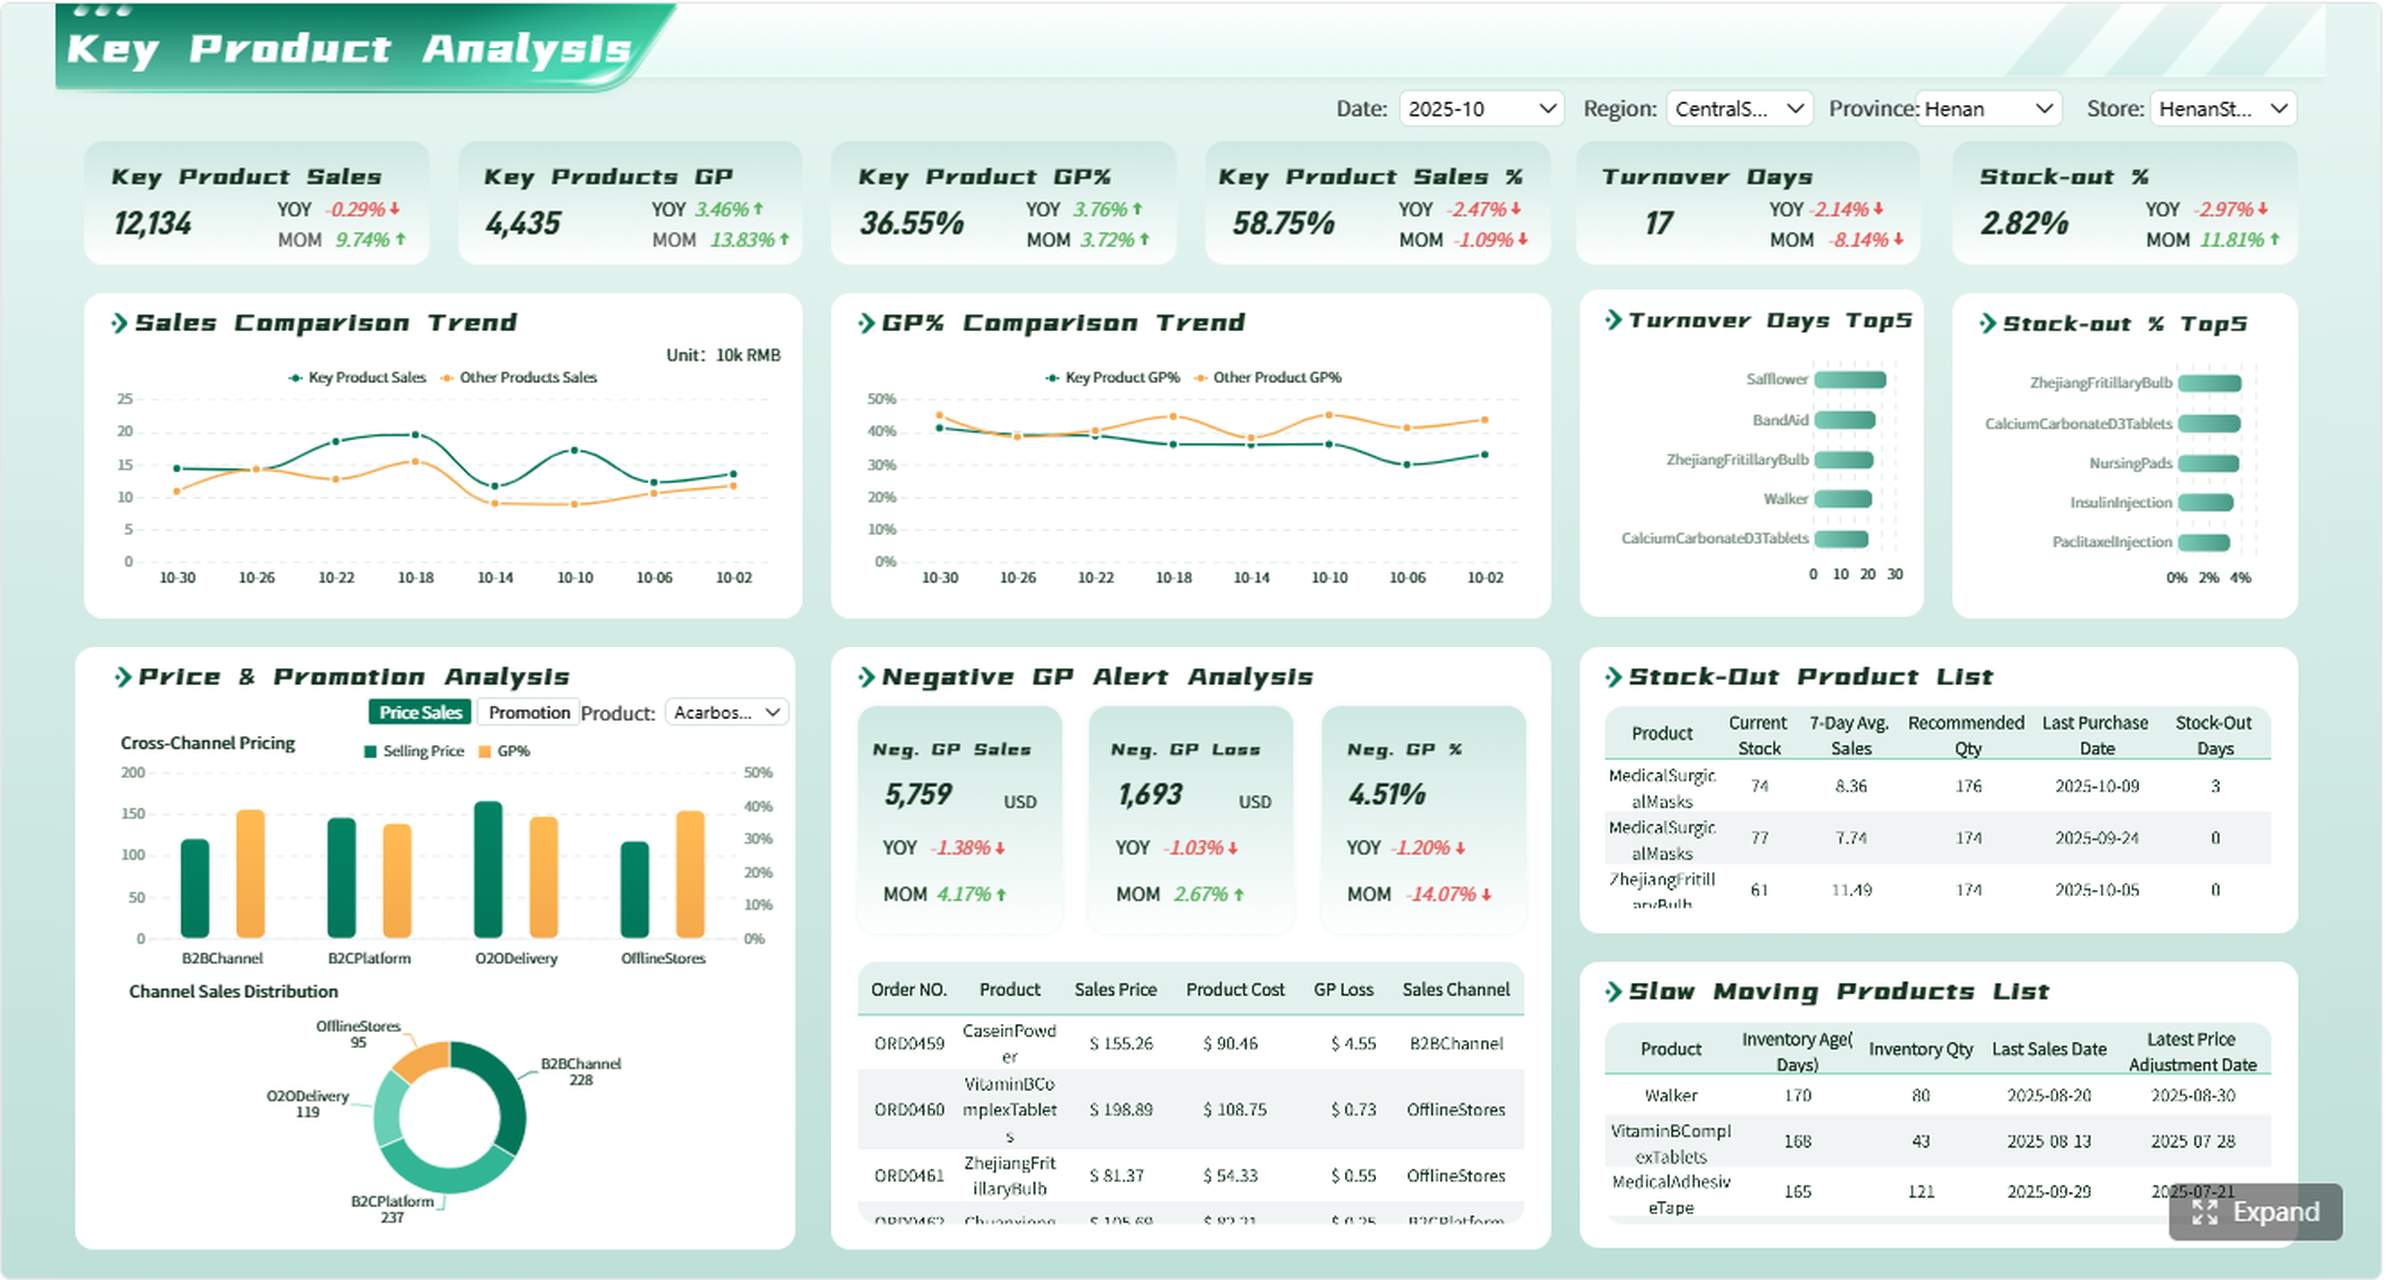
Get Ready-to-Use Dashboard Templates in Fine Gallery
Questions to ask before selecting a tool
Before committing to any report automation platform, ask these questions:
How easy is the initial setup for our most common reports?
Can the tool scale as our source systems and stakeholder needs expand?
How much maintenance will connectors, templates, and workflows require?
Can we customize logic and layouts without rebuilding everything from scratch?
Does the total cost of ownership include support, administration, and ongoing updates?
How well does it handle governance, security, and audit requirements?
Most businesses compare several options before making a decision. That is especially true when reporting complexity involves multiple departments, strict permissions, or formal executive reporting.
Common challenges and best practices for report automation
Beginners often assume that automation problems are tool problems. In reality, most issues come from unclear definitions, weak source data, or poor workflow design.
Typical problems beginners face
Here are the most common failure points:
Messy source data: Duplicate records, inconsistent formats, and incomplete fields
Inconsistent metrics: Different teams define the same KPI in different ways
Broken connectors: APIs change, credentials expire, and refresh jobs fail
Stakeholder misalignment: The report answers the wrong question or serves the wrong audience
Overcomplicated designs: Too many charts, too many filters, and not enough clarity
If these issues are not resolved early, automation will multiply confusion rather than reduce effort.
Best practices for a smooth rollout
A seasoned consultant would usually recommend the following rollout approach.
1. Start with one high-value recurring report
Choose a report that is already produced regularly, takes too much manual effort, and has a stable audience. Do not start with the most complex executive dashboard in the company.
2. Standardize definitions before automating
Agree on what each KPI means, where it comes from, and how it is calculated. A fast automated report is useless if sales and finance do not trust the revenue number.
3. Document the workflow clearly
Record the source systems, logic, filters, schedule, owners, and delivery rules. This makes troubleshooting and onboarding far easier.
4. Test outputs against known historical results
Before go-live, compare automated outputs with trusted historical reports. Validate totals, trends, edge cases, and refresh timing.
5. Keep human review in the loop
Automation should remove repetitive labor, not eliminate judgment. Analysts and managers still need to review exceptions, add context, and explain anomalies.
How to start with report automation in a simple first project
If you are new to report automation, keep the first project narrow and measurable.
A weekly sales pipeline summary or monthly marketing performance review is often a good place to begin.
Step 2: Map the data sources and required metrics
List every system involved and define the exact fields needed. Then document the KPIs, calculations, filters, and report layout. This is where manual reporting shortcuts become visible.
Step 3: Identify the manual steps to remove
Look for tasks such as:
Downloading files from multiple platforms
Copying data into spreadsheets
Rebuilding charts each cycle
Reapplying formulas and formatting
Sending reports individually to stakeholders
These are the highest-value automation targets.
Step 4: Build a basic workflow
Connect the sources, standardize the data, apply calculations, build the report template, and configure the schedule. Keep the first version simple and focused on reliability.
Step 5: Test accuracy before full rollout
Run the automated version in parallel with the manual process for a short period. Confirm that the numbers match and that the report reaches the right users on time.
Step 6: Automate delivery and improve over time
Once trust is established, automate delivery fully. Then improve the workflow by adding alerts, stakeholder-specific views, or additional data sources as needed.
Final takeaway
Report automation is not just about saving time. It is about building a reporting system that is faster, more accurate, more consistent, and easier to scale. For beginners, the smartest move is to start with one recurring report, define the metrics clearly, automate the workflow step by step, and keep a human review layer for quality and context.
As reporting complexity grows across marketing, sales, operations, finance, and product teams, the right platform can make the difference between fragile reporting and a reliable decision engine. If you want to move from spreadsheet-heavy reporting to governed, repeatable automation, FineReport is a practical place to start.
Report automation is the process of automatically collecting data, updating metrics, generating reports, and sending them to the right people on a schedule or in real time. It replaces repetitive manual reporting work with a repeatable workflow.
A dashboard shows data in a visual interface, while report automation covers the full workflow behind it, including data collection, transformation, validation, formatting, and delivery. A dashboard can be one output of an automated reporting system, but it is not the whole process.
Automated reports can pull from CRMs, ERPs, ad platforms, web analytics tools, finance systems, databases, and spreadsheets. The main requirement is that the data can be connected, standardized, and refreshed reliably.
The biggest benefits are faster reporting, fewer manual errors, more consistent KPI definitions, and quicker decisions based on current data. Teams also save time that would otherwise be spent exporting, cleaning, and rebuilding reports by hand.
Start by defining trusted KPIs, checking data quality, and making sure source systems use consistent logic and naming. You should also plan refresh schedules, validation rules, permissions, and delivery methods before scaling automation.
Product Trial
FineReport
Pixel-perfect reports · Interactive dashboards · Easy data entry · Digital twins