A basic simple financial report sample gives beginners a practical way to understand business performance without getting lost in accounting complexity. If you are a small business owner, operations manager, startup founder, or finance beginner, the main challenge is usually not collecting numbers, but organizing them into a report that is clear, accurate, and useful for decision-making. A simple reporting format helps you track profit, monitor cash, and understand what the business owns and owes—before reporting becomes overwhelming.
Basic Simple Financial Report Sample: What Beginners Need to Know
A simple financial report is a compact summary of a business’s financial activity over a defined period, such as a month, quarter, or year. It is typically used by small businesses, freelancers, early-stage startups, nonprofit teams, department managers, and first-time business operators who need visibility into financial health without building a complex finance package.
For beginners, starting small is the smart move. A shorter and easier-to-read report reduces mistakes, makes review faster, and helps you focus on the numbers that matter most. Instead of trying to produce a full investor-grade reporting pack, you begin with the essentials: income, financial position, and cash movement.
The 3 Core Statements in a Beginner-Friendly Basic Simple Financial Report Sample
Income Statement
The income statement is usually the first report beginners learn because it answers the most immediate question: Did the business make money? In a simple format, it includes revenue at the top, expenses in the middle, and profit at the bottom.
This is also where a statement of financial income and expense becomes useful. It helps beginners understand how business activity translates into performance. You can quickly see whether profit improved because sales increased, expenses declined, or both.
For example, if monthly revenue is 20,000andtotalexpensesare15,000, net profit is $5,000. That number becomes a central figure for the rest of the reporting package.
Balance Sheet
The balance sheet shows the business’s financial position at a specific moment in time. Unlike the income statement, which covers a period, the balance sheet is a snapshot.
It is built around a simple equation:
Assets = Liabilities + Equity
In plain language:
Assets are what the business owns, such as cash, inventory, equipment, and receivables.
Liabilities are what the business owes, such as loans, unpaid bills, and taxes due.
Equity is the owner’s remaining interest after liabilities are deducted.
A beginner-friendly balance sheet does not need dozens of line items. It only needs enough detail to show whether the business is financially stable and whether obligations are manageable.
What does this statement reveal? It tells you:
How much cash and other resources the business has
Many beginners assume profit and cash are the same. They are not. A business can report profit and still face a cash shortage. That is why the cash flow statement matters.
This statement organizes cash movement into three sections:
Operating Cash Flow: Cash generated from normal business operations
Investing Cash Flow: Cash used for or generated from asset purchases and sales
Financing Cash Flow: Cash from loans, capital contributions, or debt repayments
This report helps answer practical questions:
Is the business generating enough cash from operations?
Did equipment purchases reduce available cash?
Did the business rely on loans to stay afloat?
For beginners, the operating section is the most important starting point. If daily operations are not producing healthy cash flow, growth can become risky—even if the income statement looks strong.
Basic Simple Financial Report Sample Walkthrough
A basic simple financial report sample becomes much easier to understand when you see how the three statements connect. Think of them as one story told from three angles.
Start with a simple business example for one month:
Revenue: $12,000
Cost of goods sold: $4,000
Operating expenses: $5,000
Net profit: $3,000
Now assume:
Ending cash increased by $1,500
Equipment worth $2,000 was purchased
A supplier balance of $800 remains unpaid
From this one scenario, you can build all three statements:
The income statement shows the $3,000 profit.
The balance sheet includes the new equipment as an asset and the unpaid supplier amount as a liability.
The cash flow statement explains why cash increased by only 1,500insteadofthefull3,000 profit.
This is where beginners should focus first. Review these numbers before anything else:
The most important relationship beginners should understand is this: profit affects equity, but it does not always equal cash.
Here is the simple flow:
Net profit from the income statement increases retained earnings or owner’s equity on the balance sheet.
Cash changes on the cash flow statement explain how the cash balance moved from the beginning of the period to the end.
The ending cash from the cash flow statement appears in the assets section of the balance sheet.
Reporting periods matter too. If you compare this month to last month, or this quarter to last quarter, you can spot trends in:
Sales growth
Expense increases
Debt buildup
Cash pressure
Equity improvement
For beginners, consistency is more important than sophistication. Use the same structure each month so comparisons are meaningful.
Free Basic Simple Financial Report Samples for Beginners
Free templates are often the fastest way to get started. Instead of designing a report from scratch, beginners can use ready-made financial statement templates to organize data and reduce calculation errors.
The most useful free options usually fall into three categories:
Editable worksheets for entering live data and using formulas
PDF examples for learning layout and presentation
Guided template packs with instructions, examples, and labeled sections
Each serves a different purpose:
Use a PDF when you want a clean reference example.
Use a spreadsheet when you need automatic totals and recurring monthly updates.
Use a guided template when you are still learning how the statements fit together.
For reporting frequency, beginners typically choose:
Monthly templates for active business monitoring
Quarterly templates for management review or board updates
Annual templates for tax prep, lender requests, or year-end summaries
What to Look for in a Good Template
Not all templates are truly beginner-friendly. The best ones are simple enough to use immediately but structured enough to support accurate reporting.
Look for these features:
Simple layout with clear labels and formulas
Separate sections for income, expenses, assets, liabilities, and cash flow
Automatic totals and subtotals
Consistent date and reporting period fields
Space for assumptions and internally prepared figures
Minimal clutter and easy-to-scan formatting
A good template should help you answer basic questions quickly, not force you to decode an accountant’s workbook.
Template Formats Beginners Commonly Use
The most common formats include:
Downloadable PDF examples: Best for reference and presentation
Spreadsheet templates: Best for recurring use and automatic calculations
Guided template packs: Best for learning and first-time preparation
If you are managing reports manually, spreadsheets are usually the best first step. If you are presenting to others, PDFs often look cleaner. If you want both usability and standardization at scale, dashboard tools become the better long-term choice.
How to Create a Simple Financial Report Sample Step by Step
Creating a simple report is less about accounting theory and more about following the right order. This is where many beginners go wrong: they collect numbers randomly, fill statements in the wrong sequence, and then struggle to reconcile totals.
Below is the practical approach I recommend as a consultant.
Gather the Right Financial Information
First, collect the core documents and records for the reporting period:
Sales invoices or service income records
Expense receipts and bills
Bank statements
Payroll summaries
Loan balances
Credit card activity
Tax-related payments
Asset purchase records
Before entering anything into a template, group figures by the same period. Do not mix monthly data with quarterly balances. A clean reporting period is essential for an accurate basic simple financial report sample.
Build Each Statement in the Correct Order
Follow this order every time:
Prepare the income statement first
Calculate revenue, direct costs, operating expenses, and net profit.
Build the balance sheet second
List assets, liabilities, and owner’s equity as of the report date.
Prepare the cash flow statement third
Reconcile beginning cash, period cash movements, and ending cash.
This sequence matters because the statements are connected. If your net profit is wrong, equity will be wrong. If cash does not reconcile, the balance sheet may be incomplete.
Best practices from the field:
Use one source of truth for account balances
Lock formulas before sharing templates
Keep naming conventions consistent
Separate actual figures from estimates
Add notes where numbers are internally prepared
Review, Compare, and Improve the Report
Once the statements are built, do not stop at completion. Review them for decision-making value.
Check for:
Large expense changes
Falling cash despite reported profit
Growing receivables
Rising payables
Missing liabilities
Unusual swings between periods
Then compare the report against:
Prior month
Prior quarter
Basic budget or target
Seasonal expectations
This is where the report becomes operationally useful. It helps you spot spending issues, cash gaps, and profit trends before they become bigger problems.
Best Practices for Reliable Beginner Reporting
To make your reports more accurate and easier to maintain, follow these practical rules:
Standardize the format early
Use the same layout every period so comparisons stay clean.
Keep line items limited
Too many categories make beginner reports harder to review and more error-prone.
Reconcile cash every reporting cycle
If cash does not match the bank balance, fix that before distributing the report.
Document assumptions clearly
Mark estimated amounts, accruals, and internally prepared figures.
Review with one non-finance stakeholder
If an operations lead or founder cannot understand the report quickly, simplify the presentation.
Build a Basic Simple Financial Report Sample Faster with FineReport
Building this manually is complex; use FineReport to utilize ready-made templates and automate this entire workflow.
That is the practical reality. A spreadsheet can work when reporting volume is low, but as soon as you need recurring monthly updates, multi-entity reporting, approval workflows, or dashboard-style visibility, manual reporting becomes slow and risky. Version control breaks, formulas get overwritten, and finance teams spend more time formatting than analyzing.
FineReport helps solve that by giving teams a faster way to create a basic simple financial report sample and scale it into a repeatable reporting system. Instead of piecing together separate files, you can use templates, automate calculations, and display your core financial statements in a cleaner, more executive-friendly format.
Why this matters for decision-makers:
Finance teams reduce manual preparation time
Operations leaders get clearer visibility into performance
Combine income statement, balance sheet, and cash flow into one view
Track KPIs with visual dashboards
Standardize reporting across teams or entities
Share reports securely without endless spreadsheet back-and-forth
If your current process feels manual, fragmented, or too difficult for non-finance users to follow, that is the signal to upgrade the workflow—not just the template.
A beginner-friendly financial report usually includes an income statement, balance sheet, and cash flow statement. Together, these show profit, financial position, and how cash moved during the period.
A simple financial report focuses on the most essential numbers and uses a shorter, easier format. A full package often includes more detail, notes, ratios, and reporting for investors, lenders, or compliance.
Profit does not always mean cash is available. A cash flow statement shows whether the business can actually cover bills, payroll, and short-term obligations.
Start with revenue, cost of goods sold, gross profit, operating expenses, net profit, and cash balance. These metrics give a clear view of performance without making the report too complex.
Yes, free templates are a practical way to organize financial data and learn the structure of each statement. They are especially useful for small businesses, startups, and first-time report builders.
Product Trial
FineReport
Pixel-perfect reports · Interactive dashboards · Easy data entry · Digital twins


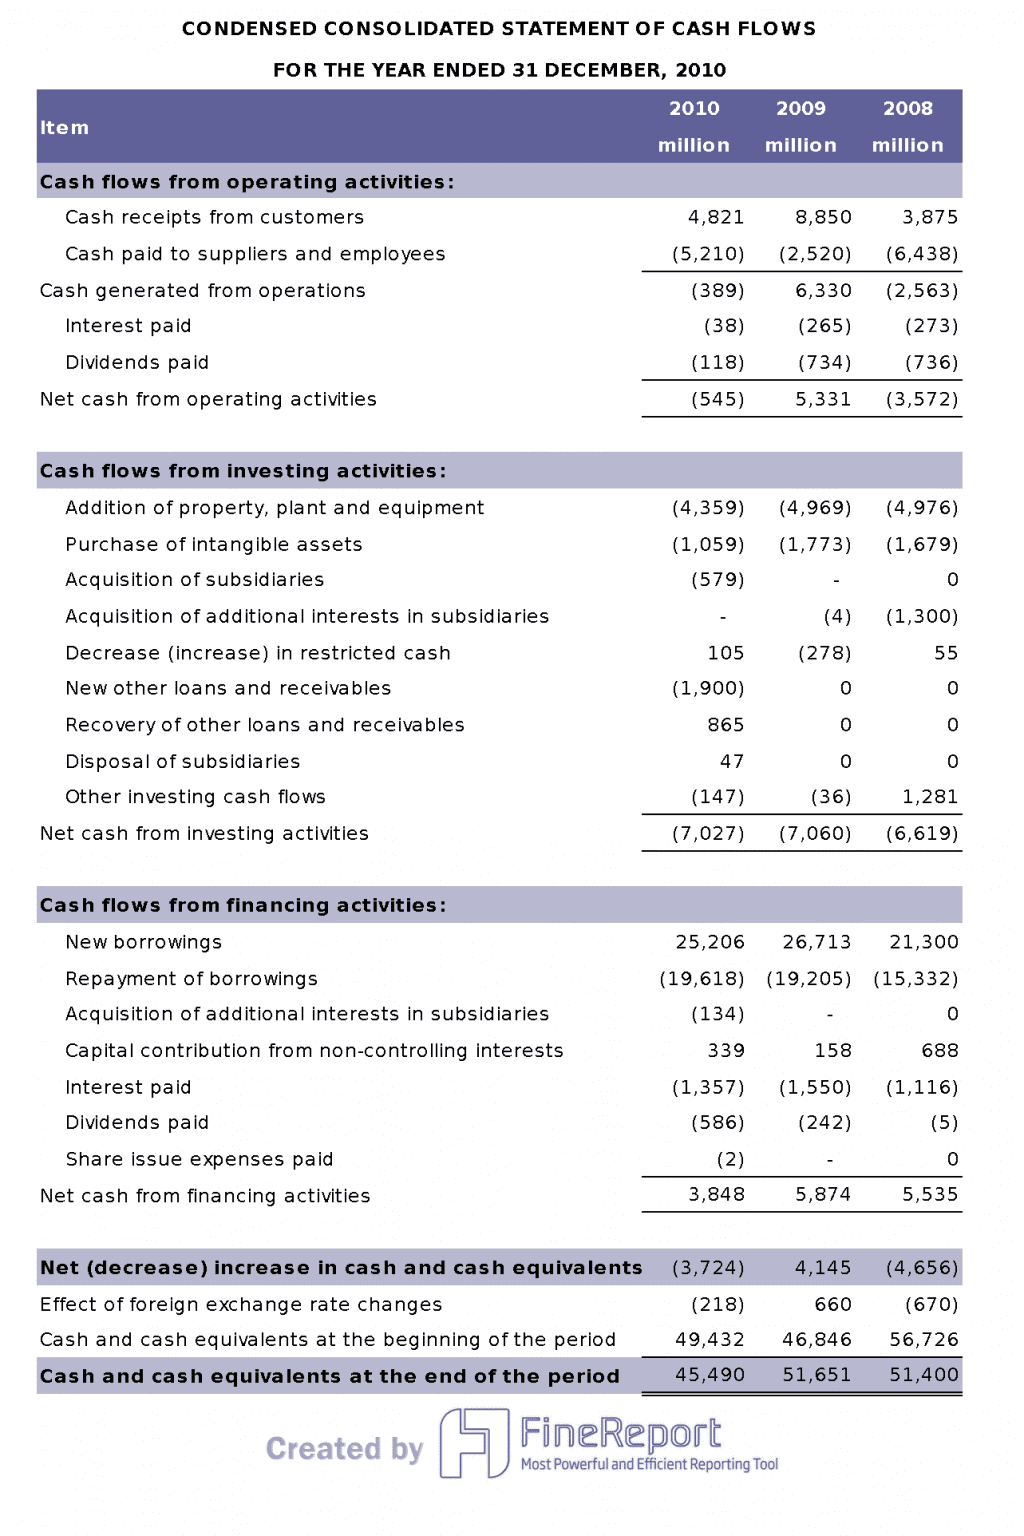 A Cash Flow Statement built by