Break-even analysis gives business owners and managers the power to make smart, data-driven choices. Imagine an e-commerce manager who uses break-even analysis to spot where profits stall and quickly adjusts pricing. This tool holds real value in business planning, helping leaders set targets and manage risk. The importance of break-even analysis shows up in every business plan and financial analysis. With modern BI tools like FineBI from FanRuan, anyone can build a break even chart and turn complex numbers into clear, actionable insights.
A break even chart gives managers a clear view of when a business starts making a profit. This tool helps leaders see the relationship between costs, sales, and profits. When they use break-even analysis, they can set realistic sales targets and adjust pricing strategies. Many companies include break-even analysis in their business plan to show investors how they plan to reach profitability.
A break even chart also supports financial analysis by showing how changes in costs or prices affect the bottom line. Decision-makers use this information to spot risks and avoid losses. They can test different scenarios and see how each one impacts the break-even point. This process helps them build a stronger business strategy and improve strategic planning.
Tip: Break-even analysis is not just for new businesses. Established companies use it to review their business strategy and update their business plan as markets change.

Break-even describes the moment when a business covers all its costs with its revenue. At this point, the company does not make a profit or a loss. The break-even point shows the exact sales volume or revenue needed to reach this balance. Many managers use break-even to guide their financial decisions. They want to know how much they must sell to avoid losses. The break-even point helps them set clear sales targets and control costs.
Financial break-even focuses on the relationship between fixed costs, variable costs, and revenue. Fixed costs stay the same each month, like rent or salaries. Variable costs change with sales, such as materials or commissions. When total revenue equals total costs, the business reaches the break-even point. This point is a key part of every financial plan.
Note: Financial break-even is not a one-time event. Companies review it often to adjust for changes in costs or revenue.
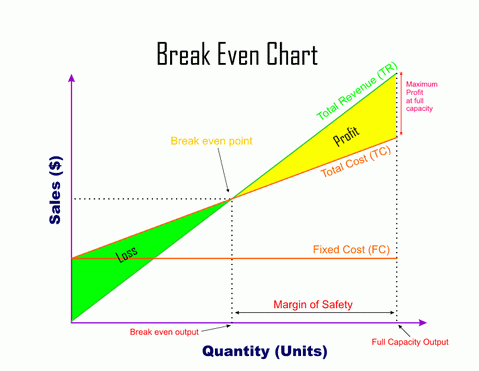
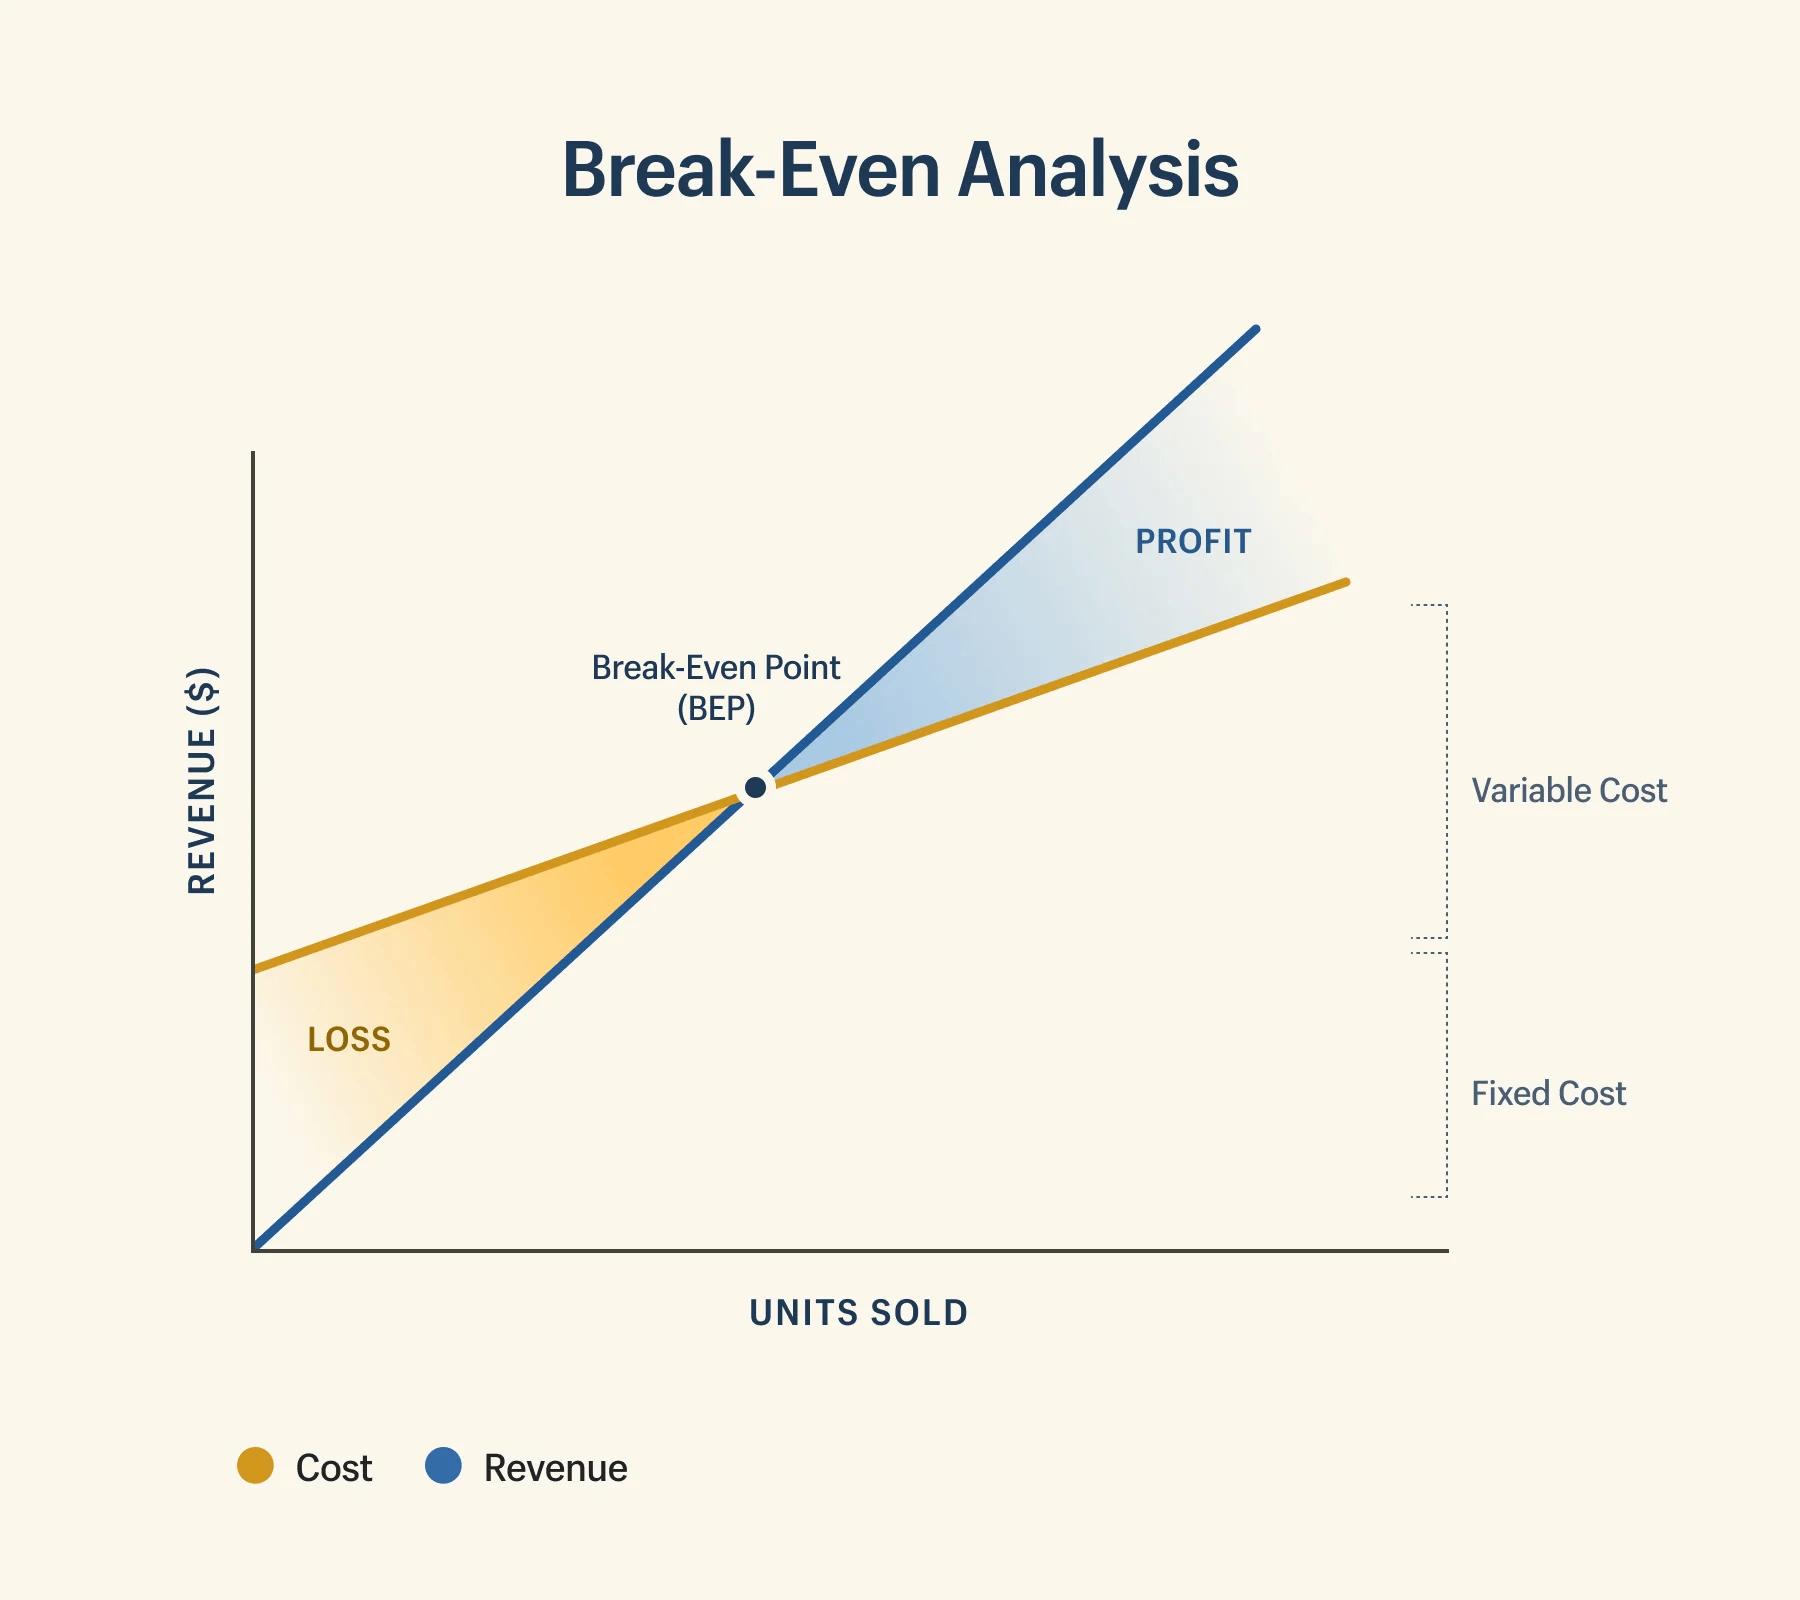
A break even chart is a visual tool that shows how costs and revenue interact as sales increase. The chart displays fixed costs, variable costs, total costs, and revenue lines. The break-even point appears where the revenue line crosses the total cost line. This point marks the start of profit for the business.
Managers use the break even chart to spot the financial break-even point quickly. The chart helps them see how changes in price or costs affect the break-even point. They can calculate break-even point for different scenarios and plan for growth. The break even chart also supports financial analysis by making complex numbers easy to understand.
A break even chart gives a clear picture of the financial break-even point. It helps leaders make better decisions about pricing, sales targets, and cost control. Every business can use this chart to improve financial performance and reach their goals.

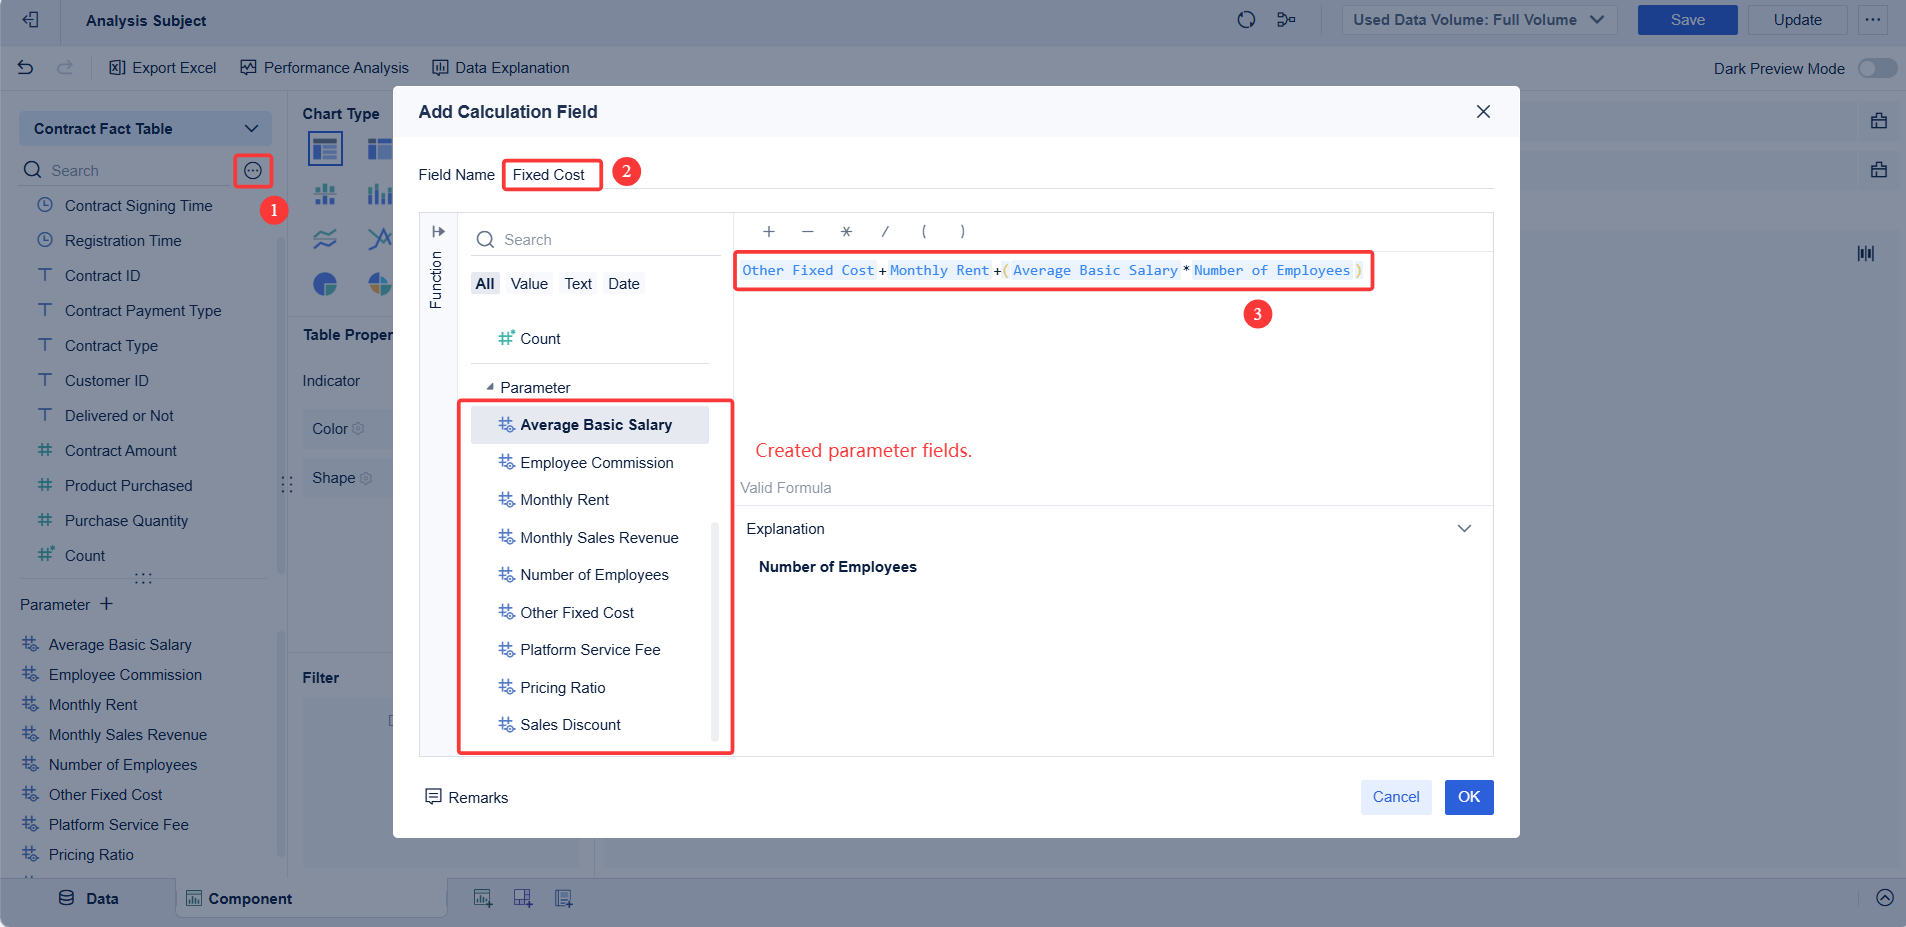
Fixed costs form the foundation of every break-even analysis. These costs do not change with sales volume. Businesses pay them regardless of how much they sell. Common examples include rent, salaries, insurance, and loan payments. The following table shows typical fixed costs for small and medium-sized enterprises:
| Fixed Cost Category | Explanation |
|---|---|
| Rent or Lease Payments | Payments for office, production, or retail spaces that remain constant regardless of sales volume. |
| Salaries and Wages | Fixed monthly or annual payments to permanent employees, independent of productivity. |
| Insurance Premiums | Regular payments for liability, health, and property insurance to protect business assets. |
| Depreciation Expenses | Allocation of long-term asset costs (machinery, equipment) over their useful life. |
| Loan Payments | Fixed monthly repayments of principal and interest on loans. |
| Utilities | Fixed monthly charges for water, electricity, gas, and internet, not varying with production. |
| Property Taxes | Fixed taxes on business real estate, payable regardless of business performance. |
| Software Licenses | Fixed costs for business software and digital tools licenses. |
| Lease Payments for Equipment | Fixed periodic payments for leased equipment such as vehicles or machinery. |
For example, a staffing company and a cafe both face significant fixed costs each month. The chart below compares their main fixed cost categories:
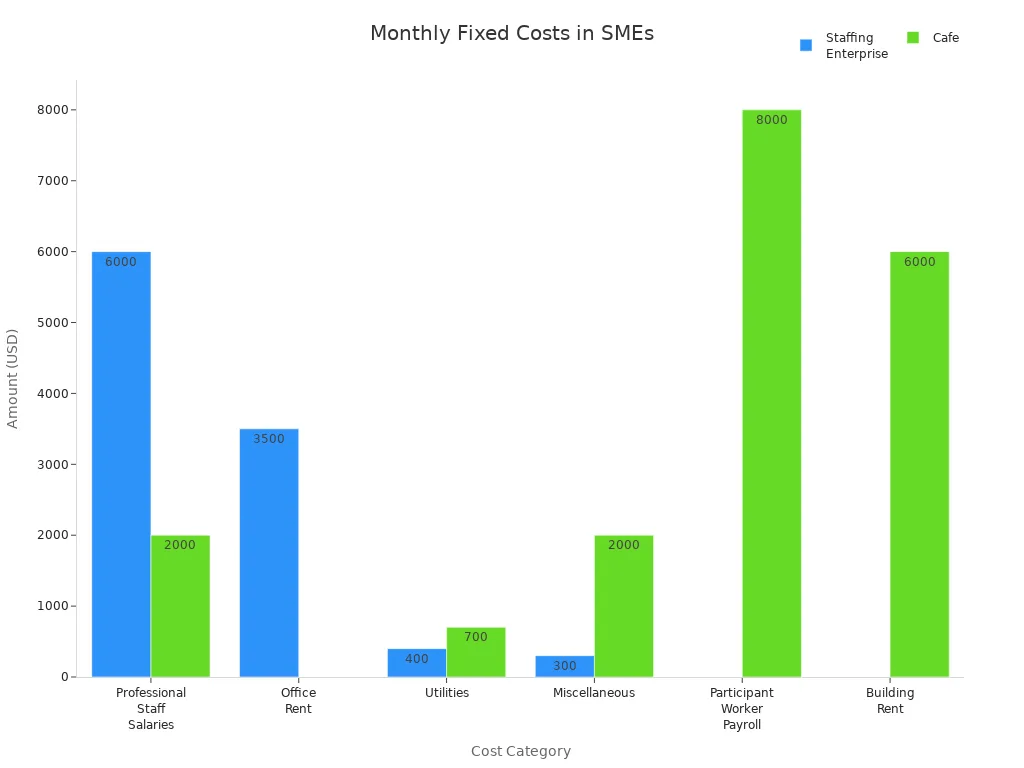
Fixed costs play a crucial role in determining the financial break-even point. Managers must track these costs closely to maintain healthy profit margins.
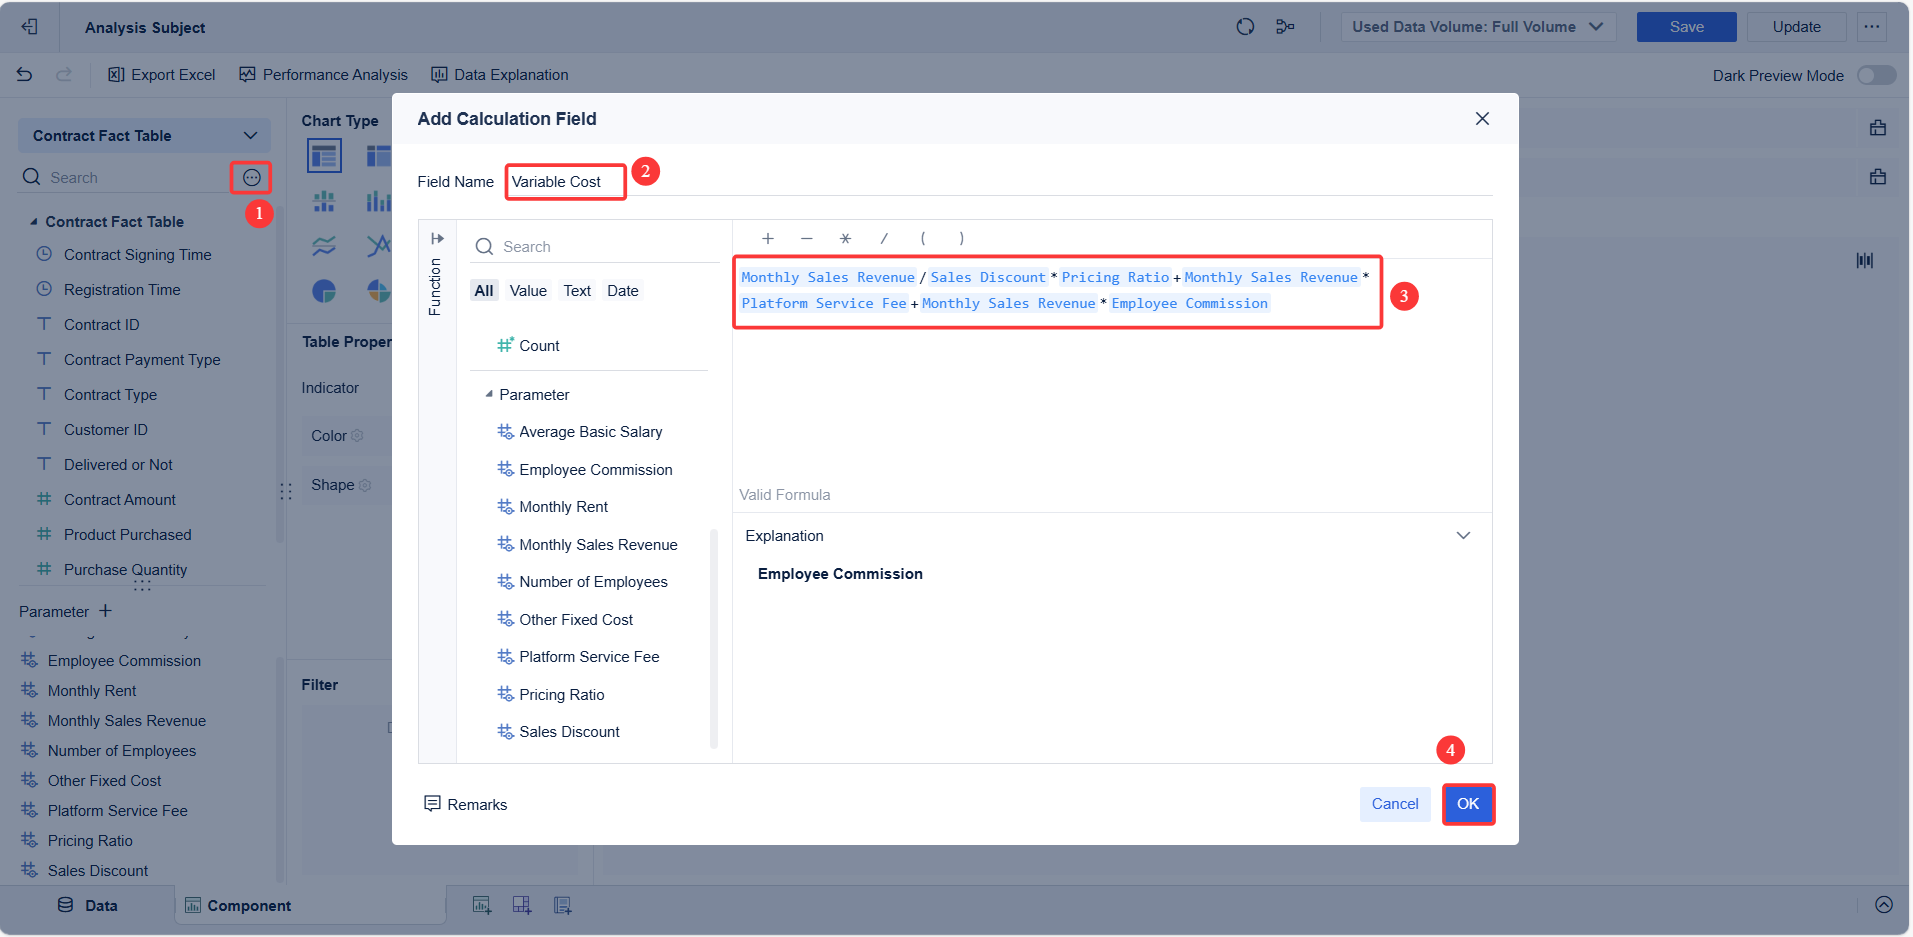
Variable costs change with sales volume. These costs include materials, commissions, and shipping fees. When sales increase, variable costs rise. When sales drop, variable costs fall. Businesses must monitor variable costs to control overall spending and improve profit. In break-even analysis, variable costs combine with fixed costs to show total costs. Understanding both types helps managers calculate break-even point and set realistic revenue targets.
Contribution margin measures how much revenue remains after covering variable costs. This margin shows how much money is available to cover fixed costs and generate profit. Managers use contribution margin to analyze product profitability and make pricing decisions. A higher contribution margin means a business can reach financial break-even faster. Tracking this margin helps leaders adjust strategies to improve profit margins and financial performance.
Tip: A strong contribution margin supports better financial planning and helps businesses withstand changes in costs and revenues.
The break-even formula is a key tool in financial analysis. It helps managers calculate break-even point by comparing fixed costs, variable costs, and revenue per unit. The basic formula is:
Break-Even Point (Units) = Fixed Costs / (Revenue per Unit - Variable Cost per Unit)
This formula shows how many units a business must sell to reach financial break-even. By using this calculation, managers can set sales goals, test different scenarios, and plan for profit. Regularly reviewing the break-even formula ensures that businesses stay on track as costs and revenues change.

For more information about how to do break even analysis, refer to the Help Document.
Break-even analysis plays a vital role in shaping effective pricing strategies. Managers use the break-even chart to see how different prices affect the break-even point and overall profit. By adjusting the price of a product or service, they can instantly view changes in the break-even point on FineBI’s dashboard. This real-time feedback helps leaders set prices that cover all costs and reach profit goals faster.
Tip: Adjusting pricing strategies with break-even analysis helps companies stay competitive and maintain healthy profit margins.
Launching a new product involves risk. Break-even analysis gives managers a clear view of the financial requirements for success. Before a launch, leaders use the break-even chart to determine the minimum sales volume needed to cover all fixed and variable costs. This step clarifies whether the product can reach the break-even point within a reasonable time.
Key benefits of break-even analysis during product launches include:
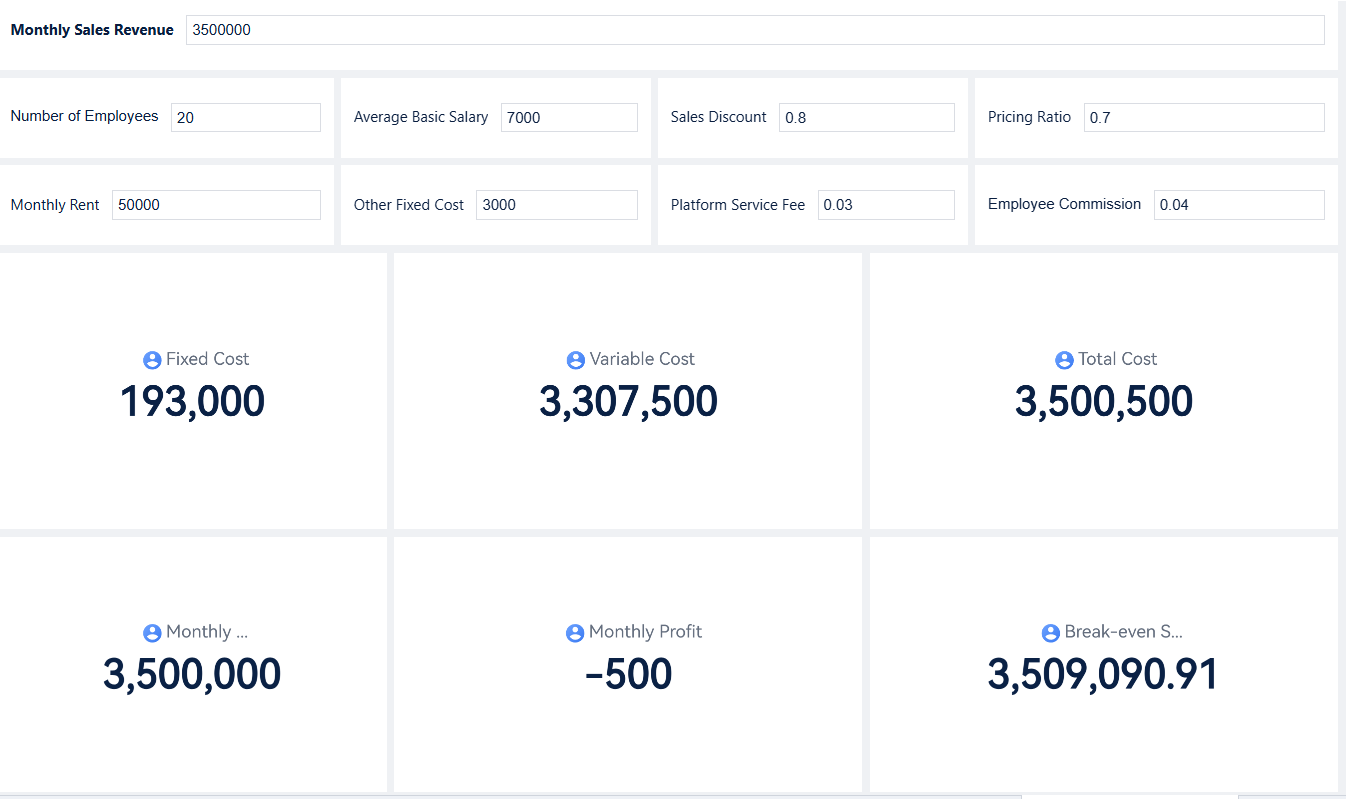
Setting realistic sales targets is crucial for any business. Break-even analysis provides a solid foundation for these targets by showing the exact sales volume needed to reach the break-even point. FineBI’s dashboard makes this process simple. Users can adjust cost and revenue parameters to see how changes affect the break-even point and required sales volume.
However, businesses face several challenges when using break-even analysis for sales target setting:
Despite these challenges, FineBI’s break-even analysis dashboard helps teams overcome many obstacles. The platform enables parameter adjustments and instant KPI updates, making it easier to adapt sales targets as conditions change. Managers can use break-even analysis examples to train teams and improve understanding.
Scenario planning prepares businesses for market fluctuations. By combining scenario planning with break-even analysis, leaders can anticipate a range of possible outcomes. FineBI’s dashboard supports this process by allowing users to create multiple scenarios—such as low, medium, and high sales forecasts—based on different assumptions about costs, revenue, and demand.
Scenario planning with break-even charts offers several advantages:
FineBI’s break-even analysis dashboard makes scenario planning interactive. Users can adjust variables and instantly see how each scenario affects the break-even point and profit. This approach supports strategic planning and helps businesses build a resilient business strategy.
A break-even chart gives managers a clear way to spot risks before they affect the business. When leaders review the break-even point, they see exactly how close the company is to covering all costs. If sales fall below this point, the business will not make a profit. This warning helps teams act quickly to avoid losses.
Break-even analysis highlights which costs have the biggest impact on the break-even point. For example, if fixed costs rise, the break-even point moves higher. This means the company must sell more to reach profit. Variable costs also play a role. If these costs increase, the break-even point shifts, making it harder to achieve financial goals. Managers use the break-even chart to track these changes and adjust their financial forecasts.
A break-even chart also shows how changes in pricing or sales volume affect the break-even point. Leaders can test different scenarios and see which ones put the business at risk. This process supports better financial planning and helps companies avoid surprises.
Break-even analysis turns financial data into clear actions. Managers use the break-even chart to guide decisions that improve profit and support growth. Some of the most effective steps include:
Teams use break-even analysis to update sales targets and adjust business plans. FineBI’s dashboard lets users change cost or sales numbers and instantly see the new break-even point. This real-time feedback supports quick, data-driven decisions. By making break-even analysis a regular part of financial planning, companies can improve profit and reach their financial goals.
A break-even analysis template helps businesses find ways to optimize costs and improve financial health. Managers use this template to track all expenses, including both fixed and variable costs. By entering accurate data, they can see which areas need attention. Many businesses make mistakes when using a break-even analysis template. Some forget hidden costs like insurance or software subscriptions. Others set unrealistic prices or make sales projections that do not match market trends. Ignoring seasonal changes or leaving out safety margins can also lead to poor financial decisions.
A well-designed break-even analysis template in FineBI allows users to adjust cost parameters and instantly see the impact on financial outcomes. This flexibility supports better planning and helps managers avoid common mistakes. By reviewing all costs regularly, businesses can spot trends and make changes before problems grow.
Regular review of the break-even analysis template is essential for maintaining financial accuracy. Costs, sales volume, and pricing often change over time. Businesses should update their break-even analysis template at fixed intervals, such as weekly or monthly. This habit keeps financial data current and actionable. Frequent updates help managers track progress, spot trends, and adjust strategies quickly. When the financial environment shifts, a current break-even analysis template gives leaders the information they need to respond.
FineBI makes this process simple. Users can schedule regular reviews and updates, ensuring the break-even analysis template always reflects the latest financial situation. This ongoing process supports better decision-making and helps businesses stay ahead of financial risks.
Mastering break-even charts gives every business leader a clear path to smarter decisions. Break-even analysis shows when a company covers costs and starts making profit. FineBI makes break-even tracking simple and fast. Teams can use break-even templates, explore break-even dashboards, or ask a BI expert for help. Break-even tools help with planning, pricing, and profit. Break-even charts reveal risks and guide actions. Break-even reviews keep data fresh. Break-even insights support growth. Break-even knowledge leads to better results. Break-even mastery builds strong business plans. Break-even focus drives success.
Explore FineBI to unlock your business potential. For more infomation about its functions, you can go to the product guide.

What is Pareto Chart and How Does it Work
How DuPont Analysis Helps You Understand Your Business
How to Do Retention Analysis for Business Success
Perform Market Basket Analysis to Upgrade Your Business

The Author
Lewis
Senior Data Analyst at FanRuan