An esg dashboard gives you a clear view of your organization’s environmental, social, and governance data in one place. You can track key metrics, spot trends, and make smart decisions that boost sustainability. Many companies use dashboards to connect esg data with business outcomes, helping leaders and investors see the full picture. For example, 90% of S&P 500 companies now release esg reports, showing a strong push for transparency and compliance.
| Evidence | Description |
|---|---|
| 90% of S&P 500 companies | Release ESG reports, indicating a strong trend towards transparency and accountability in corporate reporting. |
With modern tools like FineReport, you can manage your esg data in real time and respond quickly to new challenges.
ESG Dashboard Overview

What Is an ESG Dashboard
You use an esg dashboard to bring together environmental, social, and governance information in one interactive platform. This tool helps you see your organization’s impact and track progress toward sustainability goals. The dashboard gives you a real-time view of esg data, so you can monitor key metrics and respond quickly to changes. You can visualize trends, compare performance, and make decisions that support responsible business practices.
An esg dashboard stands out from traditional business intelligence dashboards. You get continuous updates and automated data validation, which means you avoid slow, error-prone manual processes. The dashboard unifies data across regions and departments, making it easier to manage and report on esg concerns.
| Feature | ESG Dashboards | Traditional BI Dashboards |
|---|---|---|
| Data Visibility | Real-time visibility | Often relies on static reports |
| Data Validation | Automated data validation | Manual and fragmented processes |
| Reporting Speed | Continuous updates | Slow and error-prone |
| Compliance Monitoring | Continuous compliance mapping | Limited to post-issue reporting |
| Data Unification | Unifies data across regions and departments | Requires manual formatting |
You often gather esg data from many sources. These include utility meters, building management systems, tenant surveys, and waste reports. You may also use spreadsheets and third-party platforms. Integrating all this data can be complex, but an esg dashboard helps you organize and analyze it efficiently.
The dashboard supports major sustainability reporting standards. You can align your disclosures with frameworks such as:
- Global Reporting Initiative (GRI)
- Sustainability Accounting Standards Board (SASB)
- International Sustainability Standards Board (ISSB)
- Task Force on Climate-Related Disclosures (TCFD)
- Corporate Sustainability Reporting Directive (CSRD)
- Greenhouse Gas Protocol (GHG Protocol)
You benefit from a structured approach to data collection and compliance tracking. The dashboard makes it easier to meet global standards and improve transparency.
The esg software market is growing fast. Experts project a compound annual growth rate (CAGR) of 20.7% from 2025 to 2033. This rapid expansion shows that more organizations are adopting esg dashboards to manage their sustainability efforts.
ESG Dashboard Core Purpose
You rely on an esg dashboard to achieve several important objectives. The dashboard helps you monitor top environmental, social, and governance issues in a single place. You can track disclosure practices and compare your performance with peer companies. The dashboard also lets you review shareholder proposals and understand their expectations, which supports long-term value creation.
| Objective Type | Description |
|---|---|
| Monitoring ESG Concerns | Helps companies monitor and analyze their top environmental, social, and governance (ESG) issues in a centralized platform. |
| Tracking Disclosure Practices | Provides a comprehensive analysis of disclosures related to common ESG topics among peer companies. |
| Understanding Shareholder Expectations | Allows organizations to sort through ESG-related proposals from shareholders and understand their rationale, fostering long-term value creation. |
You use the dashboard to align your organization with recognized sustainability reporting standards. The dashboard helps you collect relevant data, track compliance, and ensure consistent disclosures. You gain a clear view of your environmental impact, social responsibility, and governance practices.
The dashboard empowers you to make informed decisions that support sustainability. You can identify areas for improvement, set goals, and measure progress. By using an esg dashboard, you strengthen transparency and accountability across your organization.
Tip: When you use an esg dashboard, you simplify complex reporting tasks and improve your ability to meet regulatory requirements.
How ESG Dashboards Work

ESG Data Integration with FineReport
You need a reliable way to bring together ESG data from many sources. FineReport makes this process simple and efficient. You can connect to databases, spreadsheets, and even IoT sensors without hassle. The platform supports real-time data entry and validation, so your ESG metrics stay current. You can use open APIs to customize the dashboard and fit it into your existing business systems. This flexibility helps you avoid data silos and ensures that all information is easy to access.
- Efficient data entry and validation keeps your ESG metrics up-to-date.
- Flexible data integration connects to various databases and consolidates information.
- Engaging visualizations offer a wide range of charts, including dynamic 3D options.
- Open APIs and customization let you tweak the dashboard for your business needs.
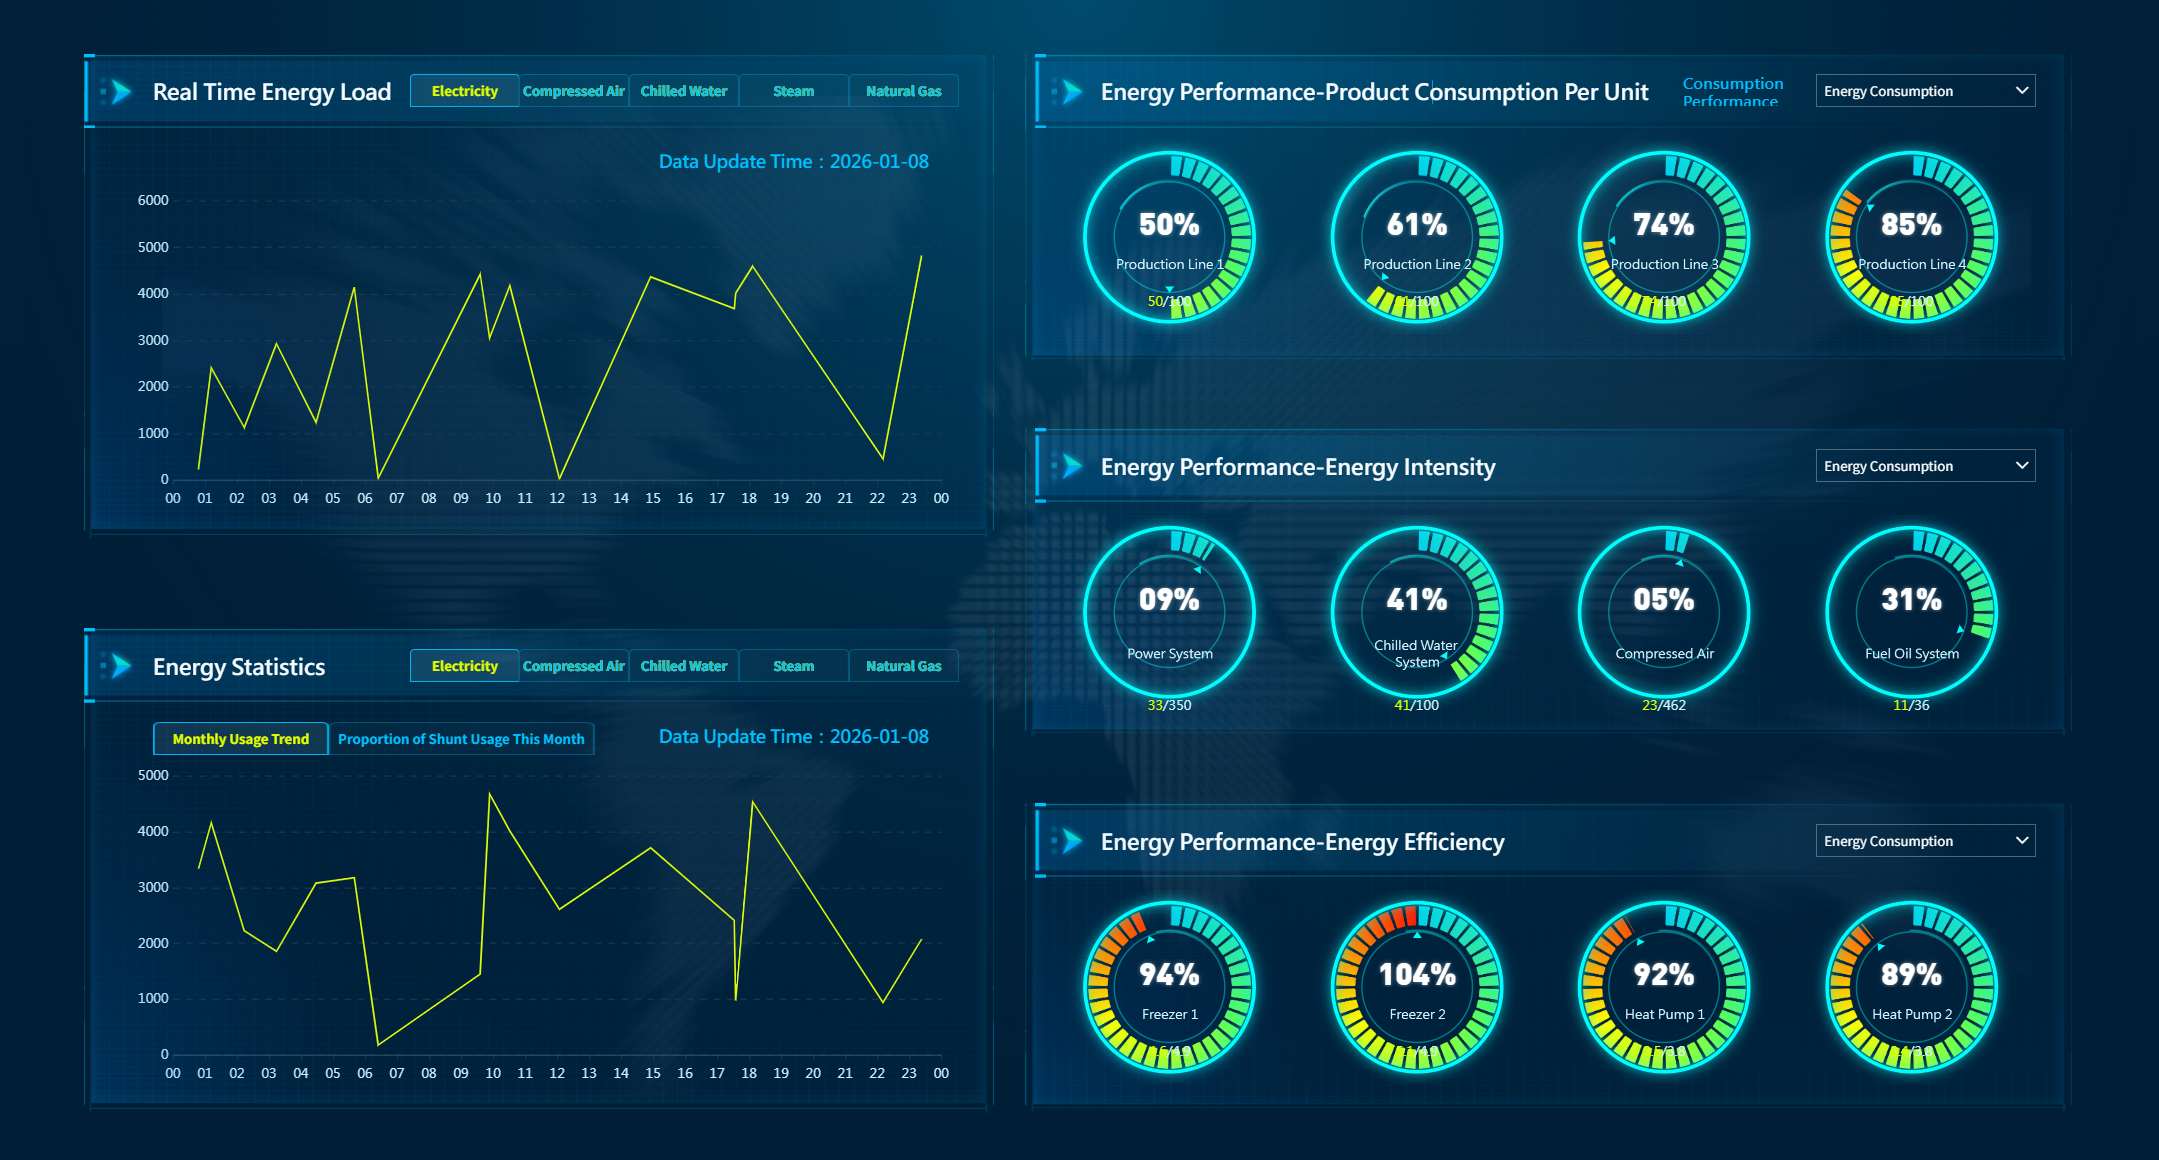
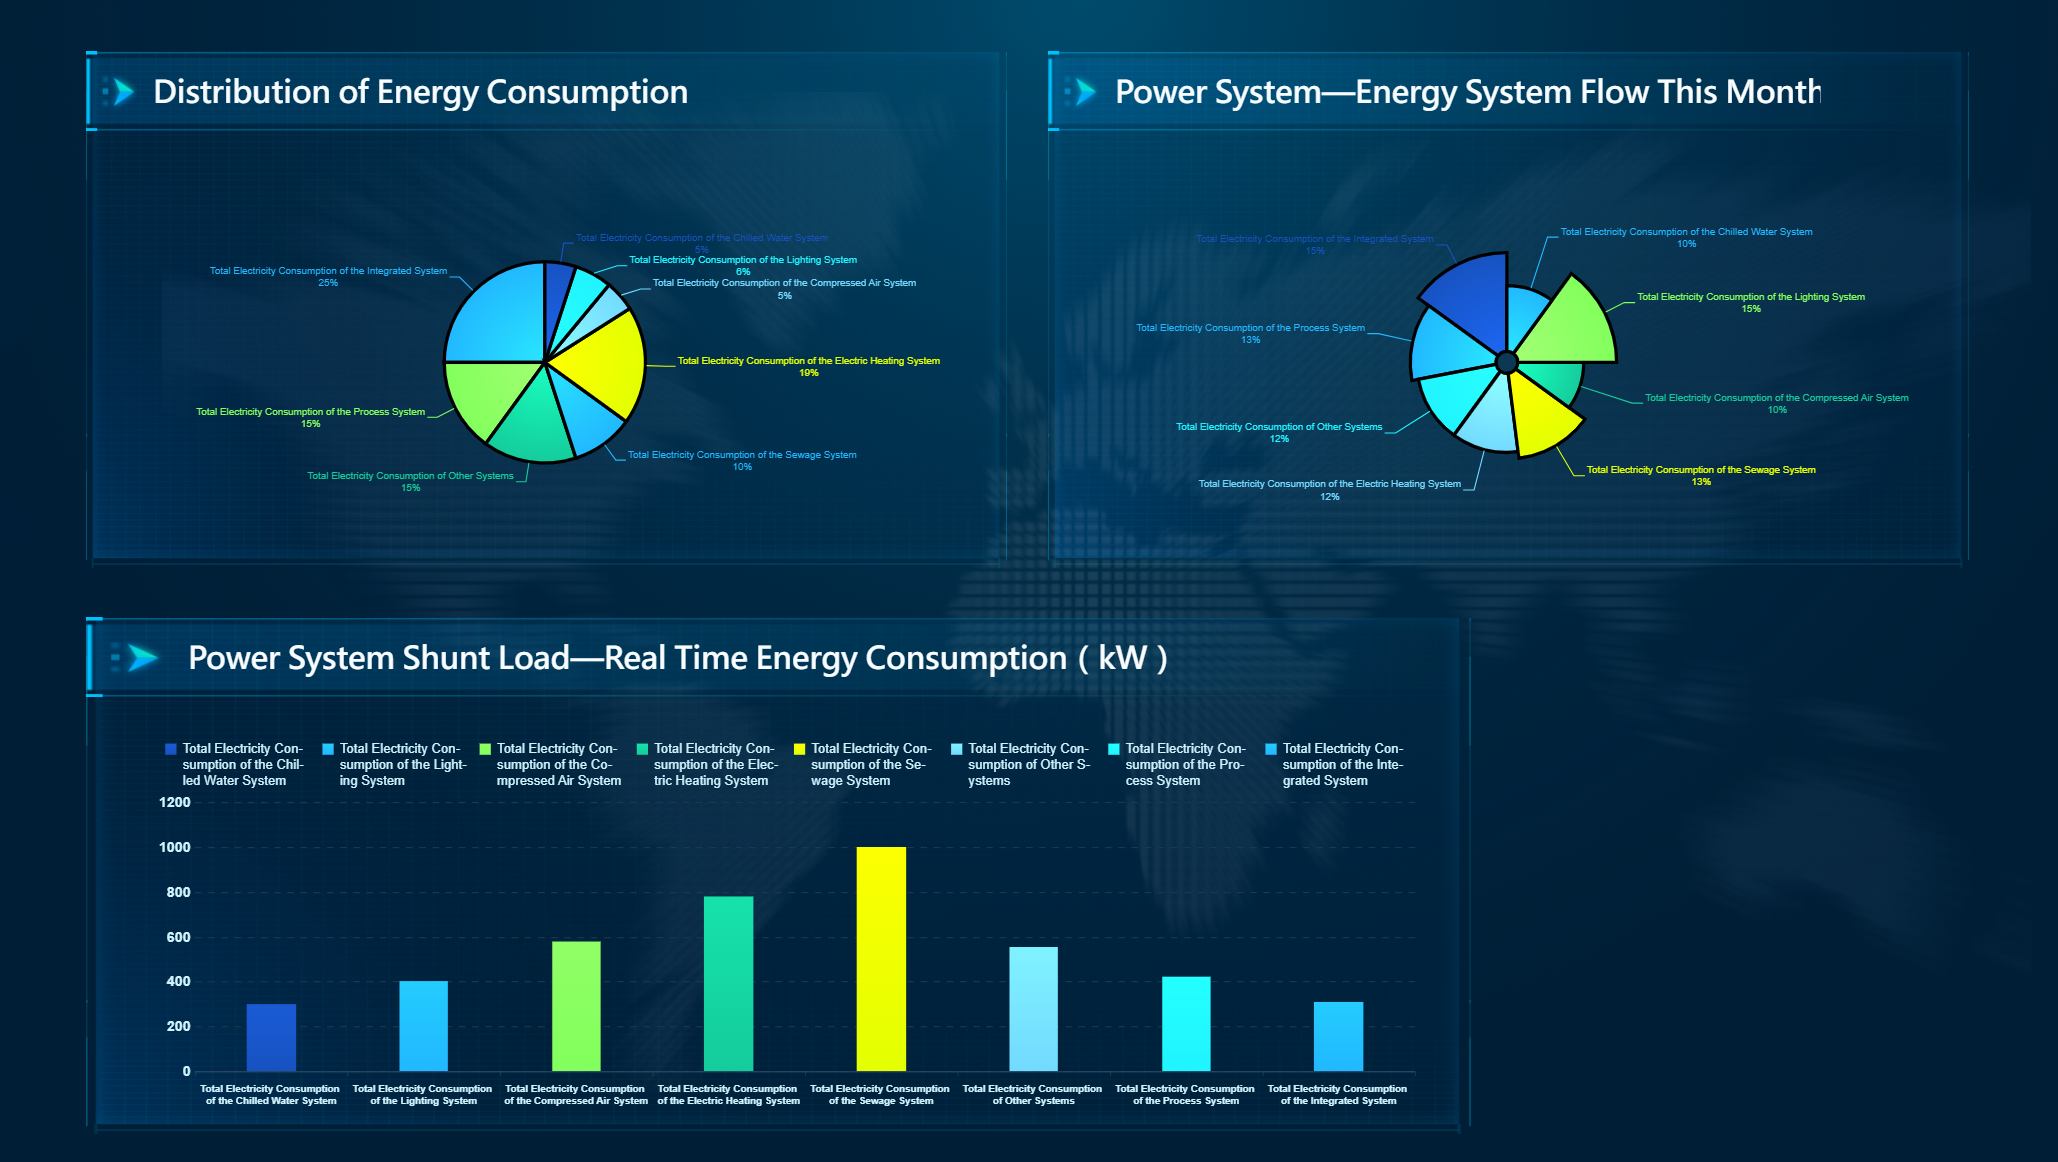
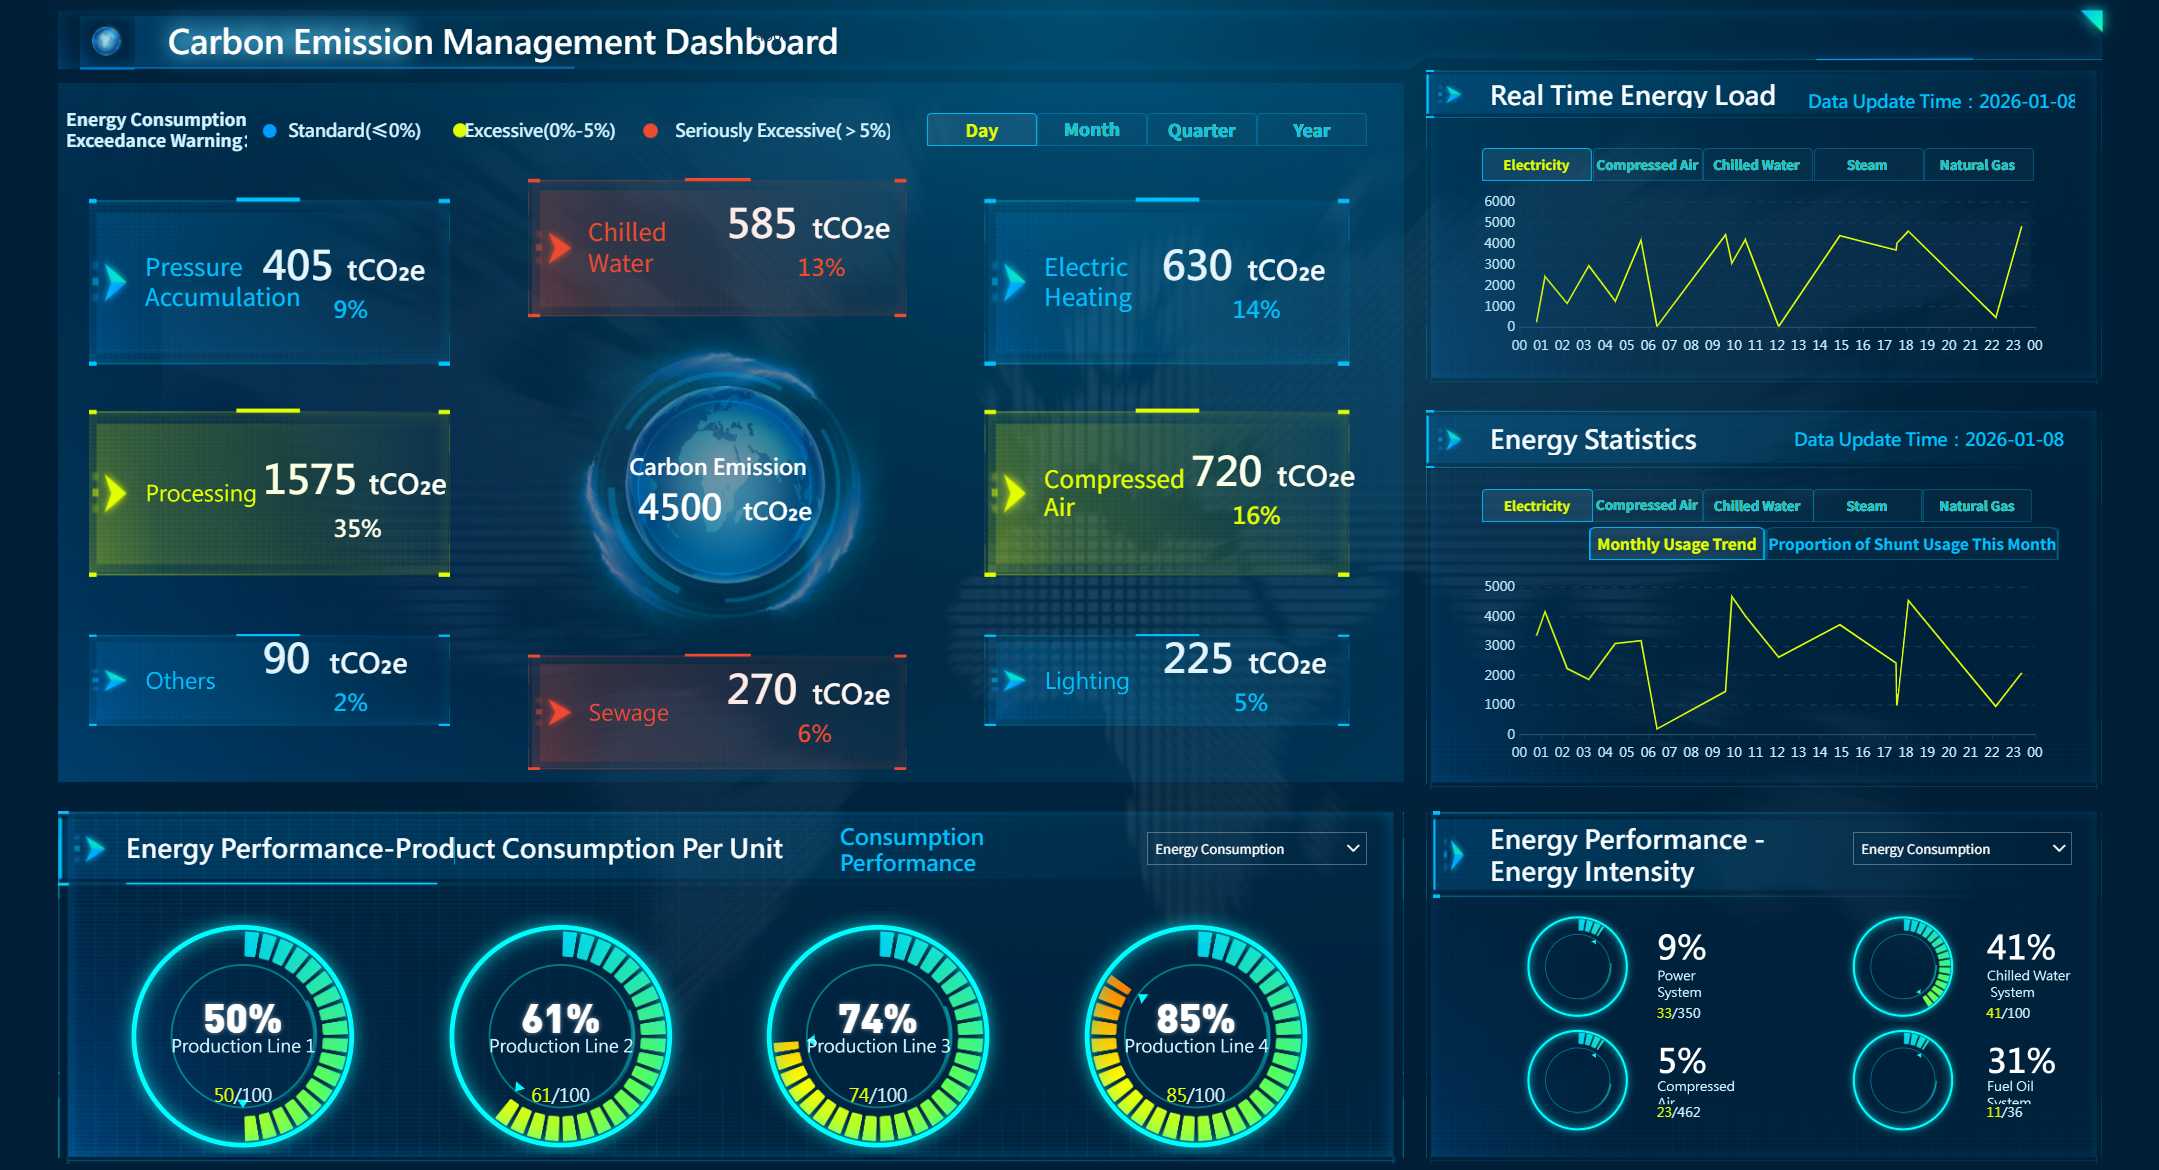
In manufacturing, you often deal with data from energy meters, production equipment, and environmental sensors. FineReport helps you combine these sources into one ESG dashboard. You can monitor energy consumption, carbon emissions, and operational efficiency in real time. This approach supports sustainability reporting and helps you meet global standards.

Key Features and Metrics
You want to track the most important ESG metrics to understand your organization’s impact. FineReport gives you access to standardized KPIs, leading and lagging indicators, and real-time data. You can tailor dashboards for different user roles, making sure each stakeholder sees what matters most. The platform uses intuitive charts and scorecards to make data easy to understand.
| Feature/Metric | Description |
|---|---|
| Standardized KPIs | Metrics like carbon intensity, employee turnover, and board diversity for comparability. |
| Leading and Lagging Indicators | Combination of forward-looking and past metrics for a complete view. |
| Real-Time Data | Use of IoT sensors and automated reporting for up-to-date insights. |
| Customization by User Role | Tailored dashboards for different stakeholders. |
| Intuitive Data Visualization | Use of charts and scorecards for easy understanding. |
| Benchmarking Against Industry Peers | Comparative metrics to highlight performance relative to peers. |
| Progress Toward Targets | Metrics showing alignment with goals and regulatory requirements. |
| Qualitative Insights | Narrative context to complement quantitative metrics. |
| ESG Risks and Opportunities | Visualization of potential risks and opportunities alongside performance data. |
| Data Quality and Governance | Controls to ensure data accuracy and integrity. |
| Stakeholder Feedback Loops | Integration of stakeholder perceptions through surveys. |
| Drill-Down Capabilities | Ability to explore underlying data for deeper analysis. |
| Predictive Analytics | Forecasting models to anticipate ESG trends and risks. |
| Regulatory Compliance | Tracking metrics aligned with ESG disclosure requirements. |
| Automated Reporting and Alerts | Automation for updating metrics and notifying users of significant changes. |
| Integration with Financial Data | Linking ESG metrics to financial performance for integrated decision-making. |
| Transparency and Accountability | Accessible dashboards with clear documentation of methodologies. |
| Continuous Evolution | Regular updates to reflect changing ESG landscapes and stakeholder needs. |

You can measure and report on environmental, social, and governance metrics using both qualitative and quantitative data. Environmental metrics include carbon footprint, water usage, and renewable energy adoption. Social metrics cover living wages, gender pay equity, and employee engagement scores. Governance metrics focus on board diversity, anti-corruption policies, and shareholder voting rights. FineReport helps you collect, manage, and analyze these metrics for frameworks like SASB, GRI, and TCFD.

Real-Time ESG Data Visualization
You need to see ESG data as it happens. FineReport provides real-time visualization tools that let you track trends and receive immediate notifications. This capability is vital for monitoring environmental metrics, which can change quickly. You can spot risks, assess opportunities, and adjust your strategy before issues grow.
Real-time ESG data visualization gives you high-level insights for informed decision-making. You can view dashboards that aggregate targets against actuals, helping you measure progress toward sustainability goals. Automated alerts keep you updated on significant changes, so you stay proactive.
In manufacturing, real-time dashboards help you monitor energy use and carbon emissions. You can detect anomalies, optimize processes, and improve operational efficiency. For example, companies like Danfoss use FineReport to achieve paperless operations, reduce energy costs, and cut carbon emissions. You gain a clear view of your ESG performance and can respond quickly to new challenges.
Tip: Use real-time ESG dashboards to stay ahead of regulatory requirements and support your organization’s sustainability journey.
ESG Dashboard Benefits and Use Cases

Operational Efficiency and Compliance
You can use an esg dashboard to improve how your organization works every day. When you switch from manual reporting to automated dashboards, you save time and reduce mistakes. Many organizations have seen a 65% reduction in manual reporting time and a 98% improvement in data accuracy after using these tools.
| Improvement Type | Percentage Improvement |
|---|---|
| Reduction in manual reporting time | 65% |
| Improvement in data accuracy | 98% |
You also make compliance easier. ESG dashboards automate the alignment of esg disclosure practices with changing regulations. This means you can collect and manage esg data more easily, and you can adapt quickly when new rules appear. As regulations change, you can rely on advanced tools to keep your reporting accurate and up to date. Dashboards also help you spot high-risk vendors and map your compliance efforts, so you avoid penalties and keep your business safe.
ESG Data-Driven Decision Making
You need good data to make smart choices. An esg dashboard brings together information from many sources, giving you a clear view of your environmental, social, and governance performance. This helps you set goals, track progress, and make decisions that support sustainability.
| Evidence Description | Source |
|---|---|
| ESG dashboards integrate data sources, enhancing decision-making through actionable insights. | Zhang et al. (2013) |
| Cross-sector digital collaborations support long-term ESG success by unifying business units with sustainability standards. | Pedersen et al. (2020) |
| Environmental collaboration and cross-functional alignment improve performance and streamline operations. | Gölgeci et al. (2019) |
Dashboards also help leaders by centralizing metrics, making data transparent, and allowing real-time monitoring. Some dashboards even connect sustainability metrics to financial results, showing how your efforts add value to the business.
Industry Applications and Customer Stories
You can use esg dashboards in many industries, but they are especially helpful in manufacturing and finance. In manufacturing, dashboards help you meet compliance standards, collect data from complex supply chains, and find ways to improve sustainability. They also help you engage with stakeholders and develop better esg strategies.
| Application Area | Description |
|---|---|
| Compliance | Helps manufacturing businesses meet ESG regulations and standards. |
| Data Collection | Streamlines the process of collecting and validating ESG data from complex supply chains. |
| Stakeholder Engagement | Enhances confidence among investors and customers by managing ESG performance and scrutiny. |
| Sustainability Improvement | Identifies opportunities for sustainability enhancements and proactive ESG strategy development. |
A real-world example comes from Danfoss, a leader in energy efficiency. Danfoss used FineReport to connect data from its production lines, reduce paper use, and monitor sustainability metrics in real time. The company improved operational efficiency, cut energy costs, and lowered carbon emissions. This shows how you can use dashboards to support sustainability reporting and reach your goals.

Tip: Use dashboards to verify the accuracy of your esg data, monitor the impact of each initiative, and calculate the real return on investment for your sustainability efforts.
Implementing ESG Dashboards
Steps to Deploy ESG Dashboard Solutions
You can start your ESG dashboard journey by following a clear set of steps. Begin by defining your goals and identifying the ESG metrics that matter most to your organization. Next, gather your data from all relevant sources, such as energy meters, HR systems, and supply chain records. FineReport helps you connect these sources and centralize your information for easy access.

You should involve key stakeholders early in the process. This approach builds support and helps you understand what each department needs from the dashboard. Choose an ESG framework that fits your business and consult with experts if needed. When you set up your dashboard, use intuitive layouts and visualizations to make the data easy to understand.
Many organizations face common challenges during implementation. You may see these in your own experience:
| Challenge | Solution |
|---|---|
| Lack of Resources | Use cross-functional teams and technology to streamline ESG efforts. |
| Data Availability & Reporting | Automate tracking and standardize metrics for better data integrity. |
| Resistance to Change | Communicate clearly, provide training, and show long-term value. |
| Regulatory Complexity | Stay updated on rules and seek expert advice for compliance. |
Technical issues can slow you down, but effective software like FineReport can help you monitor and track ESG data with ease. You can also address operational barriers by providing role-specific training and regular check-ins.
Best Practices for ESG Data Management
You need a strong strategy to manage ESG data and ensure reliable reporting. Start by aligning your data management plan with your business goals. Set up structured processes for collecting and validating data. Centralize your ESG data in one system to avoid fragmentation and improve efficiency.
Follow these best practices for success:
- Automate data collection and validation to boost accuracy.
- Maintain clear documentation and audit trails for transparency.
- Foster collaboration across departments to improve data quality.
- Define roles and responsibilities for data management.
- Encourage stakeholder involvement to enhance accountability.
You can use user-friendly dashboards to make adoption easier. Training sessions help employees understand their roles in ESG reporting. Regular progress reviews keep everyone accountable and focused on improving esg performance.
Tip: When you centralize and automate your ESG data, you create a foundation for accurate reporting and better decision-making.
You gain real advantages when you use ESG dashboards. These tools help you improve profit margins, boost employee engagement, and strengthen customer loyalty. You also make your supply chain more resilient and prepare for future regulations. ESG dashboards support transparency and let you track progress every day. FineReport gives you a scalable, user-friendly solution for managing ESG data. Start exploring ESG dashboards to drive sustainability and operational excellence in your organization.
Continue Reading About ESG Dashboard
Top 5 ESG Software Solutions for Businesses in 2025
What is ESG reporting and why it matters for your business
Top ESG Software Solutions Every Business Should Consider
What ESG Risk Management Is and Why It Matters For Companies


FAQ

The Author
Lewis
Senior Data Analyst at FanRuan
Related Articles

How to Build an Investment Portfolio Reporting Dashboard for Executives: KPIs, Benchmarks, and Drill-Down Views
Investment portfolio reporting for executives is not about showing every holding, transaction, and chart your investment team can produce. It is about giving CEOs, CFOs, CIOs, boards, and investment committees a fast, re
Yida YIn
Jun 25, 2026

12 KPI Reporting Examples for Executive Dashboards: What to Show in Weekly, Monthly, and Quarterly Reviews
Executive leaders do not need more data. They need decision ready $1 examples that match how often they review the business and what actions they are expected to take. A weekly $1 should surface fast moving risks and per
Yida YIn
Jun 25, 2026

How to Build a Digital Marketing Reports Dashboard: Executive Examples, KPIs, and Templates
A $1 is the control layer that helps executives and marketing leaders turn scattered channel data into fast, confident decisions. If you are a CEO, CMO, operations director, or marketing analytics lead, the real problem
Yida Yin
May 07, 2026