What is a legal operations dashboard? This tool gives you a centralized view of your legal team's work, showing key metrics and tasks in real time. You use it to monitor workflows, track documents, and analyze performance. With immediate access to data, you make faster and more accurate decisions. The table below shows how a legal operations dashboard improves your team's speed and accuracy.
| Benefit | Description |
|---|---|
| Centralized access | Real-time access to key metrics improves decision-making speed. |
| Data-driven insights | You gain insights that boost accuracy in decisions. |
| Resource allocation | Better resource management helps align legal operations with business goals. |
FineReport stands out as a top solution for building customizable dashboards that fit your legal team's needs.
Legal Operations Dashboard Overview

Definition and Purpose
What is a legal operations dashboard? This tool gives you a single platform to view, manage, and analyze all aspects of your legal team's work. You use it to track cases, monitor deadlines, and measure performance. The dashboard pulls together information from different systems, guiding your next steps and helping you streamline workflows. Unlike general business intelligence dashboards, a legal operations dashboard focuses on directing specific actions and supporting legal professionals with task management.
Tip: A legal operations dashboard helps you automate repetitive tasks, standardize processes, and build stronger relationships with external providers.
Here is a comparison between legal operations dashboards and other business intelligence tools:
| Feature | Legal Operations Dashboards | Business Intelligence Dashboards |
|---|---|---|
| Focus | Directing specific actions and streamlining workflows | Visualizing data for financial metrics and decision-making |
| Functionality | Pulls together information from various systems to guide next tasks | Serves as a presentation layer for data representation |
| Typical Users | Legal professionals needing task management | Partners and decision-makers analyzing financial data |
Value for Legal Teams
You gain several benefits when you use a legal operations dashboard. You reduce risks, save costs, and improve efficiency. The dashboard assists with compliance and helps you measure and analyze metrics that inform decision-making. You can work cross-functionally to show your legal department’s value within the organization.
- You track progress efficiently with centralized case management.
- Real-time communication tools keep your team updated.
- Automated task delegation improves productivity.
- Automated case status updates enhance transparency for clients.
- Secure client portals allow clients to track their cases.
- Shared dashboards promote better collaboration among teams.
Legal teams report a 40% reduction in administrative work and higher client satisfaction scores. Improved time management leads to better revenue. You see the financial benefits of enhanced collaboration and streamlined operations.
Legal Operations Dashboard Features
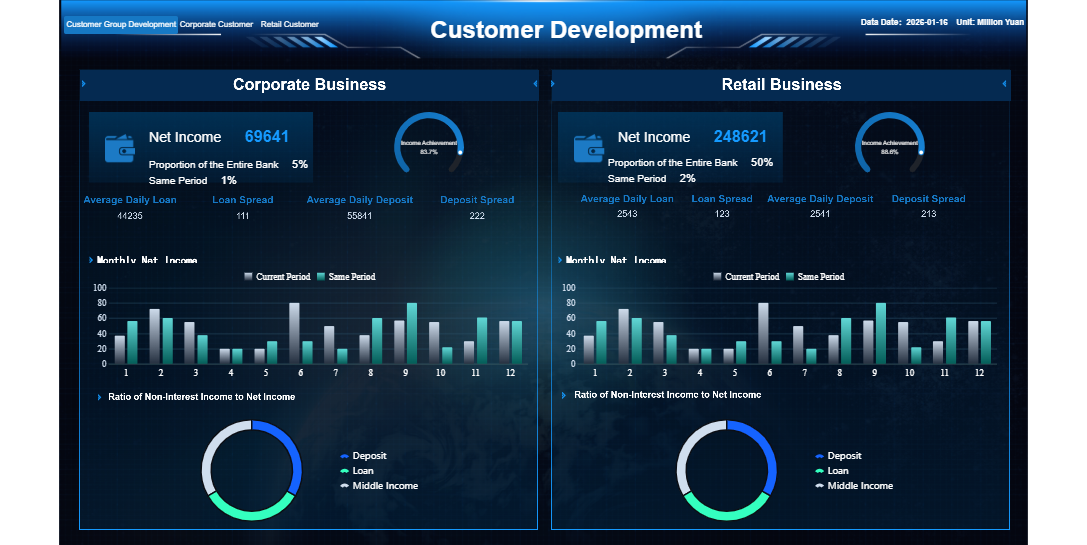
Real-Time Data Visualization
You rely on a legal operations dashboard to see your team's performance as it happens. Real-time data visualization transforms complex information into clear, actionable insights. You view key metrics and trends on user-friendly dashboards that update automatically. This immediate access helps you identify bottlenecks and prioritize urgent matters. You make informed decisions quickly because you always see the latest data.
| Technique | Description |
|---|---|
| Visual dashboards | Turn complex data into insights for legal storytelling and reporting. |
| Real-time reporting dashboards | Show key metrics and trends with interfaces that update live. |
| Dynamic user interface dashboards | Keep teams informed with automatic updates and live data feeds. |
| Visualization methods | Help attorneys understand complex data for better decisions. |
| Data visualization in eDiscovery | Speed up discovery by making data easier to interpret. |
Real-time dashboards give you immediate access to current metrics. You spot issues faster and respond to legal matters without delay.
Task and Workflow Management
A legal operations dashboard streamlines your team's workflow. You automate repetitive tasks, track deliverables, and manage matter creation with ease. You see each team member's workload and distribute tasks efficiently. Secure access ensures only authorized users can view sensitive information. Automated notifications remind you of upcoming deadlines, reducing the risk of missed tasks.
- You automate precedents, deliverables, and matter creation.
- You gain visibility over team members' workloads.
- You access tasks and legal guidance securely.
- You receive automated notifications for task deadlines.
Workflow management tools in your dashboard save time by automating invoice reviews and document generation. You spend less time on manual processes and more time on strategic legal work. Automated workflows handle routine tasks like email forwarding and approval chasing, leading to significant time savings. Stakeholders check progress independently, minimizing interruptions to your team.
Document and Matter Tracking
You use a legal operations dashboard to track documents and matters securely. Best practices include monitoring case duration, outcomes, and task completion rates. You analyze the time taken for matters to progress and compare the number of matters closed to those added. You keep track of settlement values and expenses to manage budgets. You evaluate employee performance to improve overall productivity.
| Best Practice | Description |
|---|---|
| Case duration and outcomes | Track time taken for cases and their results. |
| Client acquisition costs | Monitor costs to optimize marketing strategies. |
| Task completion rates | Measure effectiveness and identify bottlenecks. |
| Matter duration | Analyze time for matters to progress through legal processes. |
| Matters closed vs added | Compare closed matters to new ones for workload management. |
| Total settlement value | Track settlement amounts for financial performance. |
| Expenses during set periods | Review expenses to manage budgets. |
| Employee performance | Evaluate contributions to enhance firm performance. |
Your dashboard protects sensitive data with enterprise-grade encryption and privacy controls. Role-based security limits access to authorized users, ensuring compliance and confidentiality.
| Feature | Description |
|---|---|
| Secure Encryption | Clients access current metrics while meeting security requirements. |
| Role-Based Security | Staff access only relevant information, maintaining data privacy. |
- You protect sensitive data with strong encryption and privacy controls.
Reporting and Analytics Tools
Reporting and analytics tools in a legal operations dashboard help you interpret data and improve decision-making. You use predictive analytics, dynamic reporting dashboards, and smart repositories to anticipate risks and simplify reporting. You gain complete visibility into contract dashboards and business performance. Visualization tools reveal hidden connections between cases, supporting confident strategy and speeding up research.
| Tool Name | Key Features | Benefits |
|---|---|---|
| Ironclad | Predictive analytics, dynamic dashboards, repository | Anticipates risks, simplifies reporting, enhances collaboration |
| LEGALFLY | Legal analytics, contract dashboards, performance | Complete visibility, trend identification, easy interpretation |
| Fastcase | Conceptual analytics, visualization, judge analytics | Reveals connections, supports strategy, speeds research |
| Xakia | Real-time insights, configurable dashboards | Enhances communication, showcases team value, optimizes resources |
| LinkSquares | Predictive analytics for contracts | Improves outcomes, enhances visibility |
“The reports and summaries we regularly export from Xakia are key to elevating our communication with business departments.” – Jiří Pařík, Data Protection Manager, Škoda Auto
Analytics tools in your dashboard offer insights into spending patterns. You manage expenses, collaborate with finance teams, and identify cost-saving opportunities. Automated billing rates and invoicing encourage efficient time and expense tracking. Predictive insights empower you to make informed budgeting decisions.
- You monitor costs and manage budgets effectively.
- You collaborate with finance teams to identify spending trends.
- You establish billing rates and automate invoicing for efficiency.
- You use predictive insights for better budgeting decisions.
Integration with FineReport
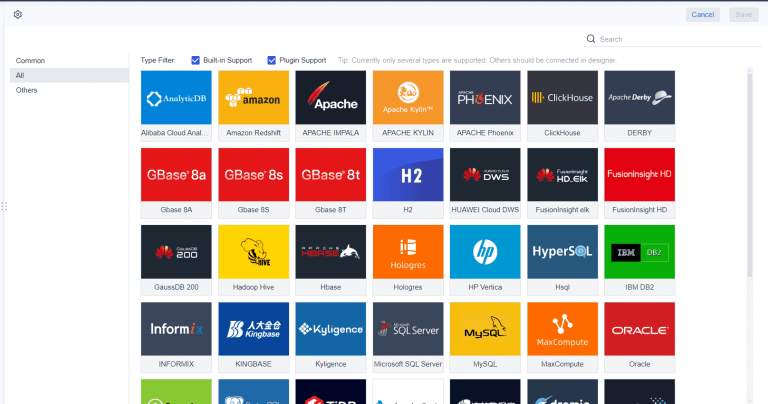
FineReport enhances your legal operations dashboard with advanced data visualization, seamless integration, and mobile access. You connect to multiple data sources, including databases and files, for a unified view of your legal data. The drag-and-drop interface lets you create interactive dashboards quickly, without coding. You customize layouts to display key metrics and drill down into specific datasets for deeper analysis.
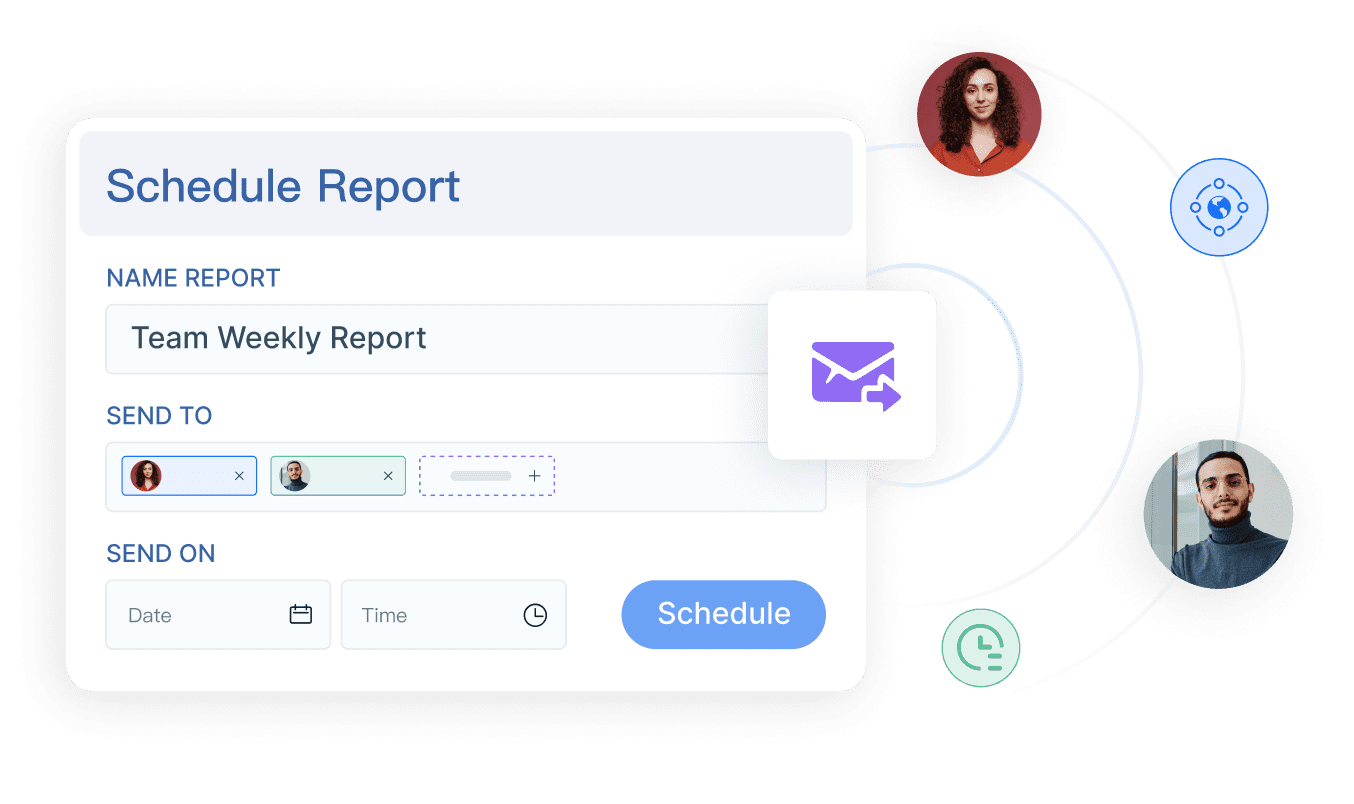
FineReport supports secure data management with role-based permissions and enterprise-grade encryption. You access dashboards on any device, including smartphones and tablets, ensuring you stay informed wherever you are. Automated task scheduling delivers reports to stakeholders on time, improving communication and oversight.
You benefit from FineReport’s flexible customization options, which allow you to tailor your legal operations dashboard to your team’s unique needs. You streamline workflows, enhance collaboration, and make data-driven decisions with confidence.
Key Metrics in Legal Operations Dashboard

Tracking the right metrics in your legal operations dashboard helps you understand your team's performance and make informed decisions. You gain visibility into workload, spending, deadlines, compliance, and productivity. These metrics guide your strategy and improve efficiency.
Matter Volume and Status
You monitor matter volume and status to see how many cases your team handles and their progress. Customizable dashboards let you track trends over time and identify patterns in workload and turnaround times. You generate quarterly and monthly reports for stakeholders and share updates on high-risk matters. This approach helps you spot capability gaps and plan staffing or training.
| Trend Type | Description |
|---|---|
| Matter Volume | Real-time insights on the number of matters being handled by legal teams. |
| Cycle Time | Analysis of the time taken to resolve matters, helping to identify efficiency. |
| Performance | Metrics that track the effectiveness of legal teams over time. |
Legal Spend Tracking
You use spend tracking to control costs and improve budget accuracy. Dashboards provide real-time visibility into spending patterns, making it easier to spot trends and pinpoint inefficiencies. You compare current spending against budgets or historical data and utilize predictive analytics to forecast future expenses. Legal teams report overall savings on total legal spend between 10% and 18%, with typical savings from billing checks at 5%. Budget accuracy improves by up to 70%.
| Description | Savings Percentage |
|---|---|
| Overall savings on total legal spend | 10-18% |
| Typical savings from billing checks | 5% |
| Improvement in budget accuracy | 70% |
Cycle Times and Deadlines
You track cycle times and deadlines to optimize workflows and reduce missed deadlines. Dashboards provide centralized visibility into case activities and automate task management. Integrated calendars highlight significant dates, and reminders for upcoming deadlines help your team stay organized. After implementing dashboards, legal teams see contract cycle times reduced by 30% to 50% and time spent on administrative tasks cut by 40% to 60%.
| Metric | Description | Target Improvement |
|---|---|---|
| Contract cycle time | Time from contract request to execution | 30-50% reduction |
| Administrative task time | Hours spent on document storage and retrieval | 40-60% reduction |
| Task progression velocity | Time for contracts to move through stages | 20-40% improvement |
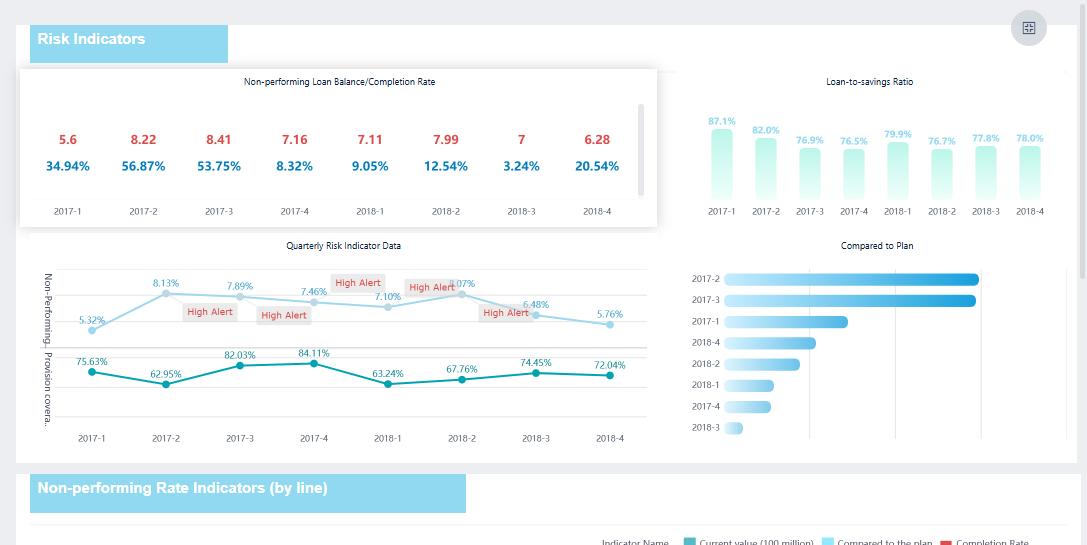
Risk and Compliance Indicators
You monitor risk and compliance indicators to protect your organization. Dashboards track compliance issue resolution rates, contract cycle times, and incident reports. You assess financial impact, staff training status, and audit results. Real-time insights help you identify risks and streamline reporting. Dashboards surface red flags, enabling proactive measures to prevent escalation.
- Track compliance risk levels and incident reports.
- Monitor staff training and audit resolution times.
- Assess cost of non-compliance and rules follow-through rates.
Team Productivity
You measure team productivity using metrics like matter volume, turnaround time, and workload by team member. Dashboards provide real-time visibility into key metrics and enable data-driven decision-making. You monitor performance, optimize resource allocation, and enhance operational efficiency.
| Metric | Description |
|---|---|
| Matter Volume and Type | Tracks the total number of matters over time, categorized by type. |
| Turnaround Time | Measures the average time to close matters, revealing delays and optimizing workflows. |
| SLA & Deadline Compliance | Monitors compliance with SLAs and deadlines, reinforcing accountability. |
| Workload by Team Member | Ensures balanced distribution of work across the team. |
| Outside Counsel Spend vs. Internal | Analyzes outsourcing costs to identify opportunities for in-house handling. |
| Legal Trend Analysis | Reports on increases in specific legal issues over time. |
Tip: Use your legal operations dashboard to centralize matter tracking and automate intake processes. This reduces delays and minimizes administrative overhead.
Legal Operations Dashboard Customization and Implementation
Out-of-the-Box vs. Custom Dashboards
You can choose between out-of-the-box dashboards and custom solutions for your legal team. Out-of-the-box dashboards offer quick setup and standard features. You get basic templates for tracking cases, deadlines, and budgets. These dashboards work well if your needs match common industry standards.
Custom dashboards give you more control. You tailor layouts, data sources, and visualizations to fit your team’s workflow. You select which metrics to display and how to organize information. Customization lets you adapt the dashboard as your legal operations grow or change. You can integrate new data sources and adjust features to match your evolving requirements.
| Option | Advantages | Limitations |
|---|---|---|
| Out-of-the-Box | Fast deployment, easy to use | Limited flexibility |
| Custom Dashboards | Full control, scalable, highly adaptable | Requires more setup and planning |
FineReport for Legal Operations Dashboard
FineReport helps you build dashboards that match your team’s unique needs. You use its drag-and-drop designer to create interactive reports and dashboards without coding. FineReport connects to multiple databases and file types, giving you a unified view of your legal data. You can customize layouts, add charts, and set up automated reporting. Mobile access lets you view dashboards on any device, keeping your team informed wherever they work.
FineReport supports secure data management with role-based permissions. You control who sees sensitive information. The platform’s flexible integration options allow you to connect with existing systems, making it easy to expand or update your dashboard as your needs change.
Factors for Successful Implementation
You improve your dashboard’s impact by focusing on key factors. Legal teams benefit most when they adopt a structured data strategy and track relevant KPIs. You should determine which metrics matter most, monitor and report on them, and share insights with other business units. Building dashboards that help other teams make informed decisions strengthens your department’s value.
| Factor | Description |
|---|---|
| User Experience | Simple and intuitive software for all users |
| Adoption | Easy adoption across the legal department |
| Customization | Ability to customize options independently |
| Mobile Experience | Secure and easy use on mobile devices |
| Accessibility | Features accessible to all users |
| Search Functionality | Accurate and fast search results |
| Product Roadmap | Scalable and robust for future growth |
| AI Capabilities | Inclusion of current and future AI features |
| Vendor Commitment | Regular investment in technology innovation |
| Integration | Seamless integration with existing technologies |
- Determine the metrics and KPIs to track.
- Monitor and report on these metrics to legal and other business units.
- Create and implement a data strategy.
- Build dashboards that help other units make informed decisions.
- Find patterns and share insights for better decision-making.
You set your legal operations dashboard up for success by focusing on user experience, customization, and integration. You empower your team to make data-driven decisions and adapt to future needs.

A legal operations dashboard gives you a clear view of your team’s work and supports better decisions. You benefit from real-time data, custom filters, and drill-down features that help you answer questions quickly and find process improvements. These tools boost efficiency and keep your team focused. FineReport offers a customizable, scalable solution for your legal operations needs.

Continue Reading About Legal Operations Dashboard
Best Dashboard Apps for Business Insights
What is a Call Center Dashboard and Why Does It Matter
What is a Reporting Dashboard and How Does it Work
What is An Interactive Dashboard and How Does It Work
What is a Call Center Metrics Dashboard and How Does It Work


FAQ

The Author
Lewis
Senior Data Analyst at FanRuan
Related Articles

How to Build an Investment Portfolio Reporting Dashboard for Executives: KPIs, Benchmarks, and Drill-Down Views
Investment portfolio reporting for executives is not about showing every holding, transaction, and chart your investment team can produce. It is about giving CEOs, CFOs, CIOs, boards, and investment committees a fast, re
Yida YIn
Jun 25, 2026

12 KPI Reporting Examples for Executive Dashboards: What to Show in Weekly, Monthly, and Quarterly Reviews
Executive leaders do not need more data. They need decision ready $1 examples that match how often they review the business and what actions they are expected to take. A weekly $1 should surface fast moving risks and per
Yida YIn
Jun 25, 2026

How to Build a Digital Marketing Reports Dashboard: Executive Examples, KPIs, and Templates
A $1 is the control layer that helps executives and marketing leaders turn scattered channel data into fast, confident decisions. If you are a CEO, CMO, operations director, or marketing analytics lead, the real problem
Yida Yin
May 07, 2026