What is the Omni dashboard? The Omni dashboard is a business intelligence tool that brings data governance, flexibility, and self-service into one platform. You can use the Omni dashboard to access and analyze data, no matter your technical background. Unlike other tools, it stands out for its simple interface and customizable visualizations.
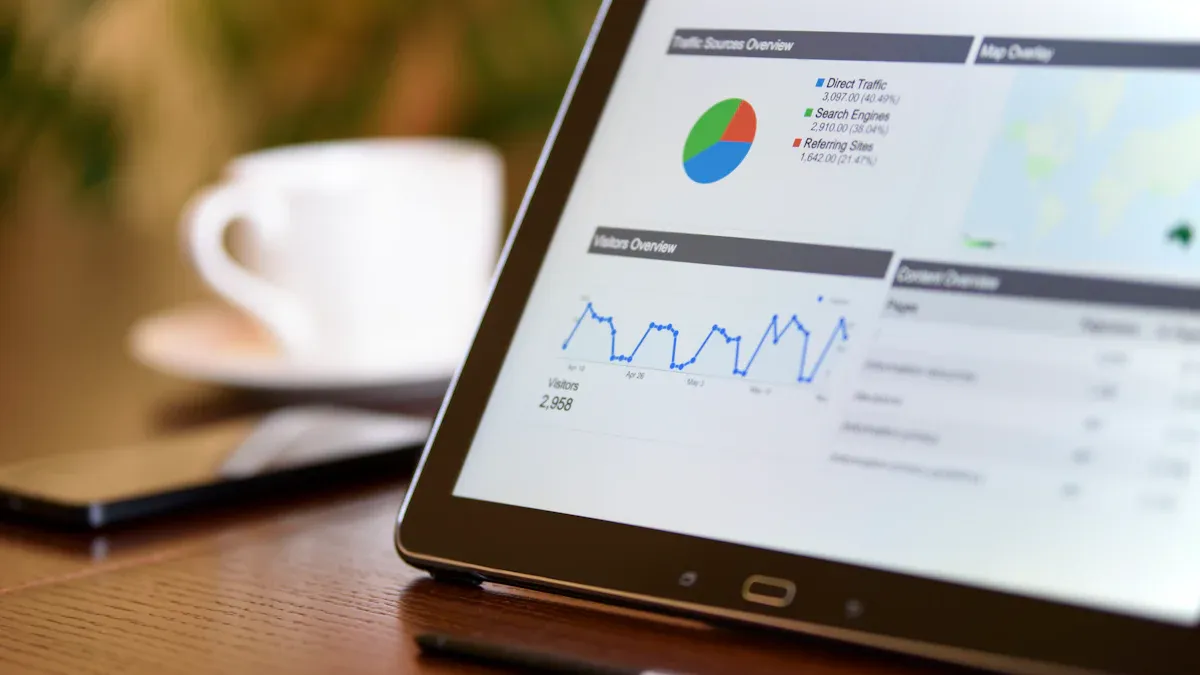
Dashboards play a vital role in business intelligence. They give you real-time insights and a single source of truth, helping you spot problems and make better decisions.
What is the Omni Dashboard
Core Purpose and Value
You need a tool that brings all your data together and helps you make sense of it. The omni dashboard does exactly that. It serves as a central hub for your business intelligence needs. You can use it to collect, organize, and analyze information from every channel your business uses. This approach supports an omnichannel strategy, which means you can see the full picture of your customer interactions and business operations.
The omni dashboard focuses on several core principles that drive its value for you:
- Outlines your business processes based on an omnichannel strategy.
- Structures service journeys to address your customers’ needs.
- Identifies the tools you need for real-time customer engagement.
- Defines a technology architecture that creates seamless experiences.
- Centralizes all customer data for a unified view.
- Maintains consistent branding across every channel.
- Integrates your systems for smooth transitions between channels.
- Personalizes each interaction using customer data.
- Optimizes every channel for mobile devices.
You gain a single source of truth with the omni dashboard. This means you can trust the data you see and use it to make informed decisions. You can track performance, spot trends, and respond quickly to changes in your business environment.
The omni dashboard delivers measurable value to your organization. You can see this value through several frameworks:
| Framework Name | Description |
|---|---|
| Impact-Output-Behavior Model | Links individual contributions to organizational goals, ensuring clarity in performance evaluation. |
| Competency Progression Matrix | Tracks growth and expertise, providing a comprehensive view of employee development. |
| Portfolio Review | Combines quantitative and qualitative insights for a balanced assessment of performance. |
These frameworks help you connect your daily actions to larger business goals. You can measure progress, evaluate performance, and support growth at every level of your organization.
How Omni Differs from FineBI
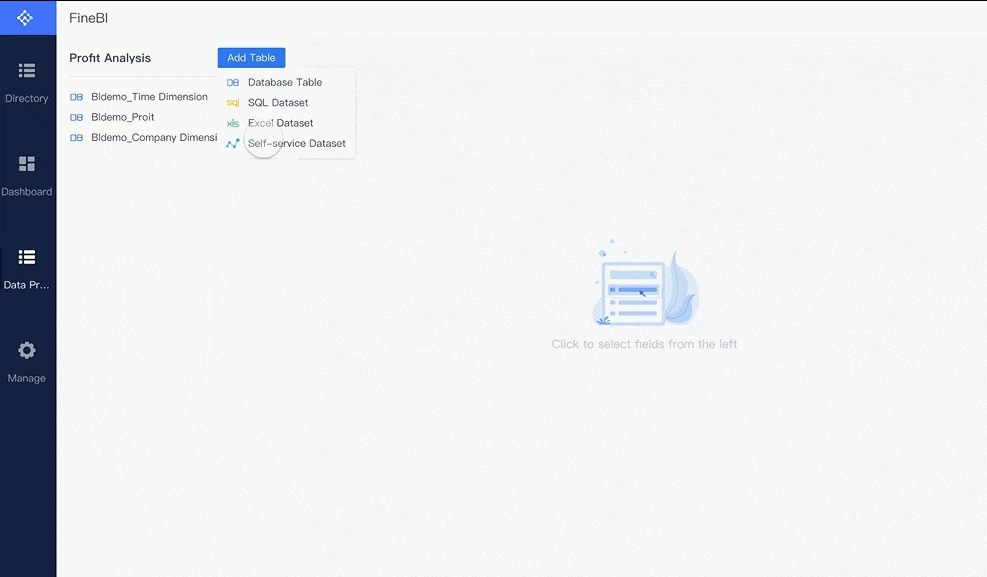
You may wonder how the omni dashboard stands apart from other business intelligence tools like FineBI. The main difference lies in the omni dashboard’s focus on seamless integration and user experience. You get a platform designed for both technical and non-technical users. The interface is simple, so you can build and customize visualizations without advanced skills.
FineBI offers strong self-service analytics and supports a wide range of data sources. It excels in enterprise-level governance and advanced analytics. However, the omni dashboard emphasizes real-time engagement and a unified customer view. You can move between channels without losing context. The omni dashboard also prioritizes mobile optimization and consistent branding, which supports your business as it grows across different platforms.
You benefit from a dashboard that adapts to your needs. Whether you want to track sales, monitor customer service, or analyze marketing campaigns, the omni dashboard gives you the flexibility to do it all in one place. You can personalize your experience and ensure that every team member has access to the insights they need.
By choosing the omni dashboard, you set your business up for success in a fast-changing digital world. You gain the tools to understand your customers, improve your operations, and drive growth with confidence.
Omni Dashboard Features
Interactive Visualizations
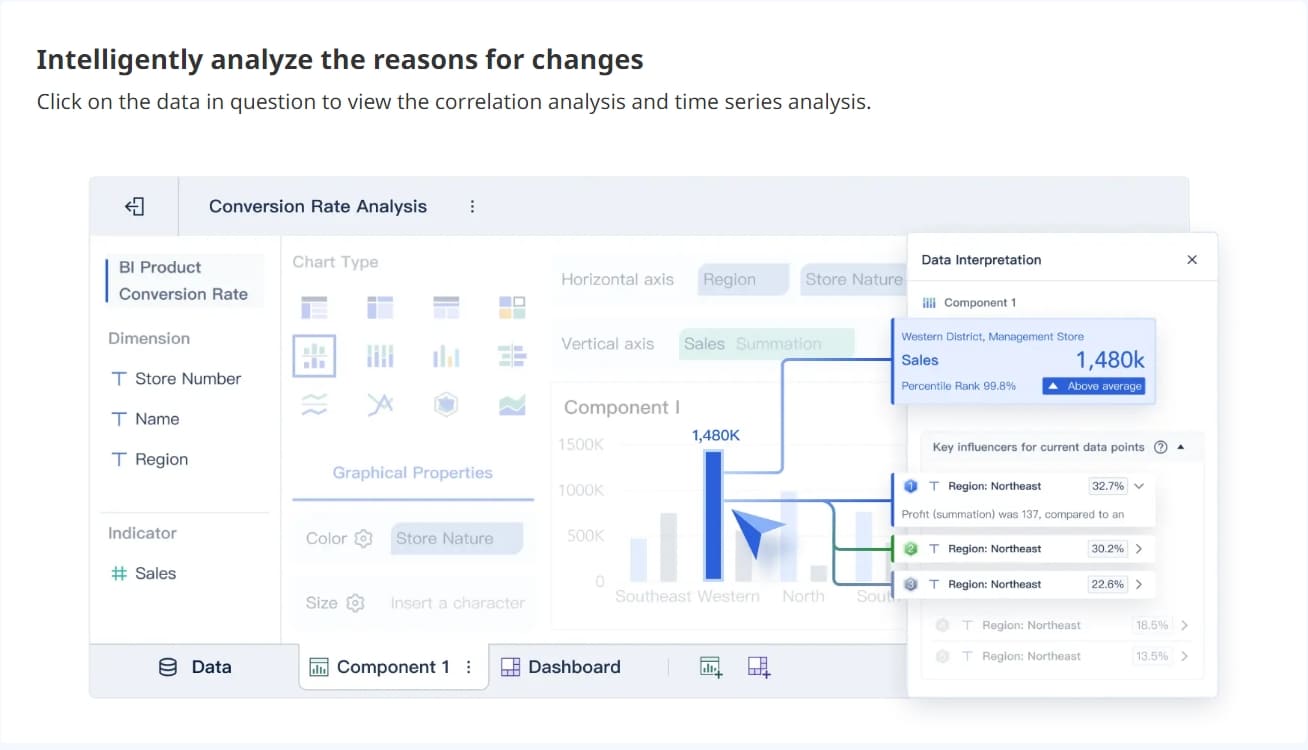
You can use the omni dashboard to create a wide range of interactive visualizations. These features help you turn raw data into clear, actionable insights. The dashboard supports standard charts, KPI cards, geographic maps, and advanced analytics like box plots and Sankey diagrams. You can also add markdown visualizations, tables, and pivot tables for detailed analysis.
| Visualization Type | Description |
|---|---|
| Standard charts | Bar, line, pie, and scatter plots for basic data representation |
| KPI cards | Show single values and their changes |
| Geographic visualizations | Maps for spatial data analysis |
| Advanced analytics | Box plots, Sankey, and Waterfall charts through Vega-Lite integration |
| Markdown visualizations | Add formatted text and images |
| Tables and pivot tables | Structured data for in-depth analysis |
You will find the visualization creation process intuitive and user-friendly. The dashboard offers extensive customization options for colors, positions, and sorting. Over 90% of users report high satisfaction with these visualization features.

Data Connections and Integration
The omni dashboard gives you powerful integration features. You can connect to folders, dashboards, documents, queries, models, and more. The integration system tracks data lineage and ownership, making it easy to manage your analytics assets.
| Type of Asset | Description |
|---|---|
| Folders | Organize your analytics content |
| Dashboards/Documents | Visualizations and reports |
| Queries | SQL queries for analytics |
| Models | Data models in your workspace |
| Lineage | Tracks connections between data sources and dashboards |
| Ownership Information | Shows who owns each asset |
You can bring together data from multiple sources, ensuring a seamless integration process. This feature supports both technical and non-technical users.

Self-Service Analytics
The omni dashboard empowers you with self-service analytics features. You can add filters, create reports, and explore data without needing technical help. Pre-built charts and tables make it easy to visualize information quickly. Teams like merchandising have used these features to analyze trends and improve collaboration. Companies such as Buzzfeed and Ascend have seen faster dashboard performance and higher adoption rates after switching to omni.
Real-Time Insights
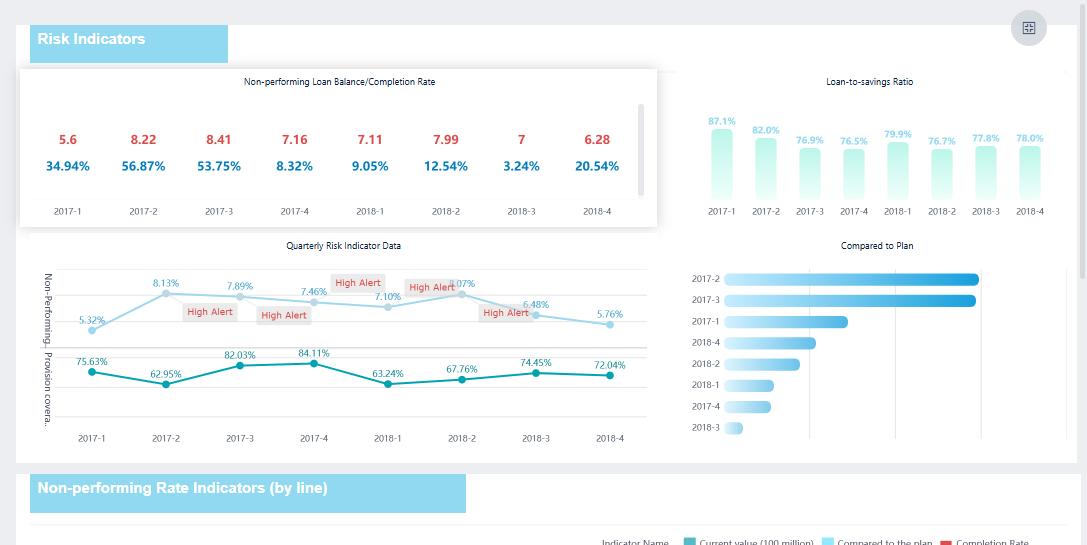
You gain real-time insights with the omni dashboard. Supervisors can monitor key metrics almost instantly. This feature allows you to optimize resource allocation, improve customer support, and track ongoing conversations. Real-time analytics also help industries like manufacturing and banking detect issues and respond quickly, leading to better business outcomes.
Using the Omni Dashboard
Practical Use Cases
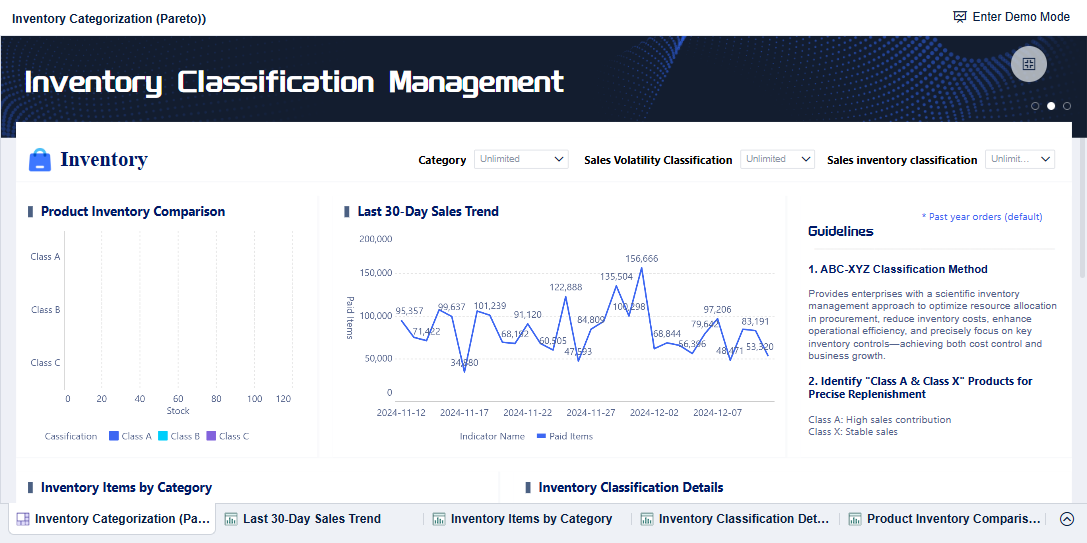
You can use the omniview dashboard to solve real business challenges across industries. In supply chain management, the omniview dashboard gives you visibility into inventory levels, shipment statuses, and demand changes. Companies like DHL and FedEx rely on real-time data from the omniview dashboard to reroute shipments, manage inventory, and predict delays. This approach helps you minimize costs and improve delivery reliability.
In retail analytics, the omniview dashboard enables you to analyze customer behavior as it happens. You can optimize stock levels and enhance customer experiences by tracking sales trends and inventory in real time. The omniview dashboard supports your team in making quick decisions that keep your business competitive.
| Use Case | Description |
|---|---|
| Supply Chain Optimization | Provides visibility into inventory, shipments, and demand. Enables agile responses to disruptions. |
| Retail Analytics | Analyzes customer behavior in real time. Optimizes stock and improves customer experience. |
FineBI also empowers business users and teams to build similar dashboards. You can connect to multiple data sources, create interactive reports, and share insights across your organization. The omniview dashboard and FineBI both support self-service analytics, making it easier for you to explore data without technical barriers.
Business Benefits
When you use the omniview dashboard, you gain several business benefits:
- You minimize lost inventory through precise tracking.
- You streamline billing and payment processes, which improves cash flow.
- You enhance driver dispatch and delivery efficiency, saving time and resources.
- You improve collaboration between departments by sharing real-time insights.
- You make faster, data-driven decisions that support business growth.
The omniview dashboard helps you respond quickly to changes in your business environment. You can monitor key metrics, identify trends, and take action before problems escalate. FineBI complements these benefits by offering robust data integration and governance, ensuring your analytics remain accurate and secure.
Who Needs Omni Dashboard and FineBI
Target Users and Roles
You may wonder if the omni dashboard fits your needs. The omni dashboard serves a wide range of users. If you work in business management, marketing, or operations, you will find value in its features. You can use the omni dashboard to track performance, monitor customer journeys, and manage projects. Team leaders and department heads often rely on the omni dashboard to get a unified view of business activities. Data analysts use it to explore trends and present findings to stakeholders. Even if you have little technical experience, you can use the omni dashboard because of its intuitive design.
FineBI also supports a broad user base. Business analysts, IT professionals, and executives use FineBI to connect data sources and build custom reports. FineBI offers advanced analytics and governance, making it suitable for organizations with complex data needs. You may choose FineBI if your team requires deep data integration and enterprise-level security.
Tip: The omni dashboard works best for teams that want quick insights and easy collaboration. FineBI is ideal for users who need detailed data modeling and robust governance.
Industry Applications
You can apply the omni dashboard in many industries. In retail, you can analyze sales trends and customer behavior. In manufacturing, you can monitor supply chain performance and inventory levels. Healthcare teams use the omni dashboard to track patient outcomes and resource allocation. Financial services rely on it for real-time risk analysis and compliance monitoring.
FineBI also finds use in diverse sectors. Manufacturing companies use FineBI for supply chain analytics and production planning. Retailers leverage FineBI for sales forecasting and inventory optimization. Banks and insurance firms use FineBI to ensure data security and regulatory compliance.
The omni dashboard gives you flexibility across industries. You can adapt it to your specific business goals. FineBI complements this by offering advanced features for organizations with complex data environments.
Why the Omni Dashboard Matters
Impact on Decision-Making
You need to make decisions quickly and confidently in today’s business world. The Omni dashboard gives you the tools to do this. You can create your own reports and explore data that matters to your work. This means you get insights that are relevant and timely. You do not have to wait for the data team to build every report. You can move faster and respond to changes as they happen.
- You build reports that match your business needs.
- You foster a culture of governed self-service, so every department can act without bottlenecks.
- You use consistent metrics, which helps teams collaborate and understand performance.
- You spot bottlenecks and improve handoffs between teams.
“Omni lets our data team get out of the way. Our business users build reports I’d never think of. By opening up the semantic layer to the business, it ends up tightly aligned to how the business actually runs.” – Edward Mancey, GTM & Ops Data Lead
The Omni dashboard helps you connect your actions to business goals. You see the impact of your choices and adjust your strategy in real time.
Comparison with FineBI and Other BI Tools
You may wonder how the Omni dashboard compares to other business intelligence tools. The Omni dashboard stands out because it puts you in control. You do not need advanced technical skills to use it. You can customize your experience and get the answers you need without extra steps.
FineBI offers strong analytics and governance for complex organizations. It works well if you need deep data integration and enterprise-level security. The Omni dashboard focuses on speed, ease of use, and real-time insights. You can switch between channels and keep your data unified. This makes it a great choice for teams that want flexibility and fast results.
You can use the Omni dashboard to drive better decisions, improve teamwork, and stay ahead in a changing market.
You gain unique value from the omni dashboard. The table below shows how omni supports your business:
| Unique Value Proposition | Description |
|---|---|
| Strategic Marketing Expertise | Combines marketing insights with advanced AI technology. |
| Tailored Strategies | Delivers measurable value through customized approaches. |
| Automation and Efficiency | Optimizes marketing efforts through automation and improvement. |
You improve workflows with omni by creating dashboards, reducing reliance on data teams, and making faster decisions. Omni supports Excel-like formulas, SQL, and natural language queries. You see increased engagement and better collaboration. FineBI complements omni by offering advanced analytics and governance for complex needs.

Continue Reading About Omni Dashboard
Best Dashboard Apps for Business Insights
What is a Call Center Dashboard and Why Does It Matter
What is a Reporting Dashboard and How Does it Work
What is An Interactive Dashboard and How Does It Work
What is a Call Center Metrics Dashboard and How Does It Work


FAQ

The Author
Lewis
Senior Data Analyst at FanRuan
Related Articles

How to Build an Investment Portfolio Reporting Dashboard for Executives: KPIs, Benchmarks, and Drill-Down Views
Investment portfolio reporting for executives is not about showing every holding, transaction, and chart your investment team can produce. It is about giving CEOs, CFOs, CIOs, boards, and investment committees a fast, re
Yida YIn
Jun 25, 2026

12 KPI Reporting Examples for Executive Dashboards: What to Show in Weekly, Monthly, and Quarterly Reviews
Executive leaders do not need more data. They need decision ready $1 examples that match how often they review the business and what actions they are expected to take. A weekly $1 should surface fast moving risks and per
Yida YIn
Jun 25, 2026

How to Build a Digital Marketing Reports Dashboard: Executive Examples, KPIs, and Templates
A $1 is the control layer that helps executives and marketing leaders turn scattered channel data into fast, confident decisions. If you are a CEO, CMO, operations director, or marketing analytics lead, the real problem
Yida Yin
May 07, 2026